Review
. 2017 Oct;46(4):935-950.
doi: 10.1002/jmri.25749. Epub 2017 May 11.

Real-time MRI guidance of cardiac interventions

Affiliations
Review

Real-time MRI guidance of cardiac interventions

Adrienne E Campbell-Washburn et al. J Magn Reson Imaging. 2017 Oct.

Abstract

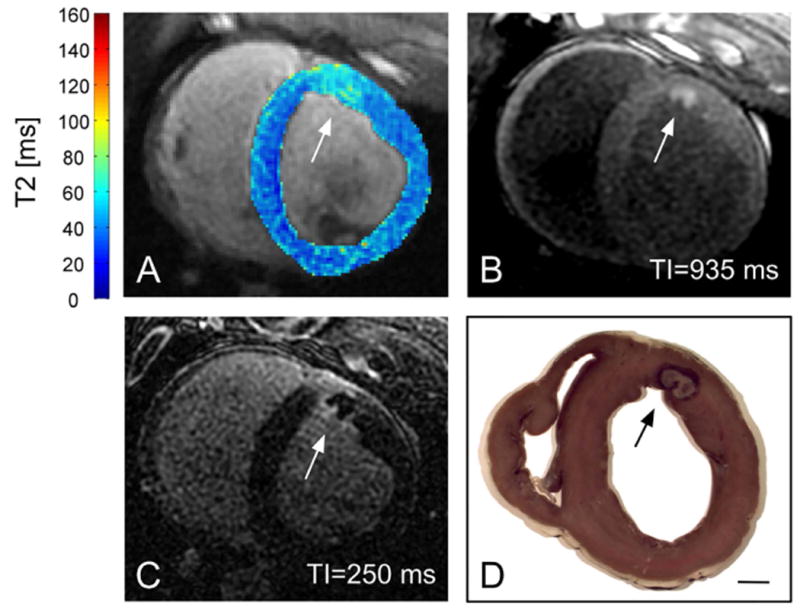
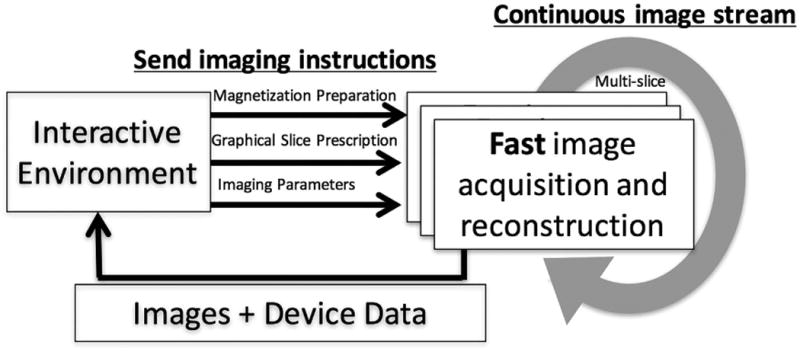
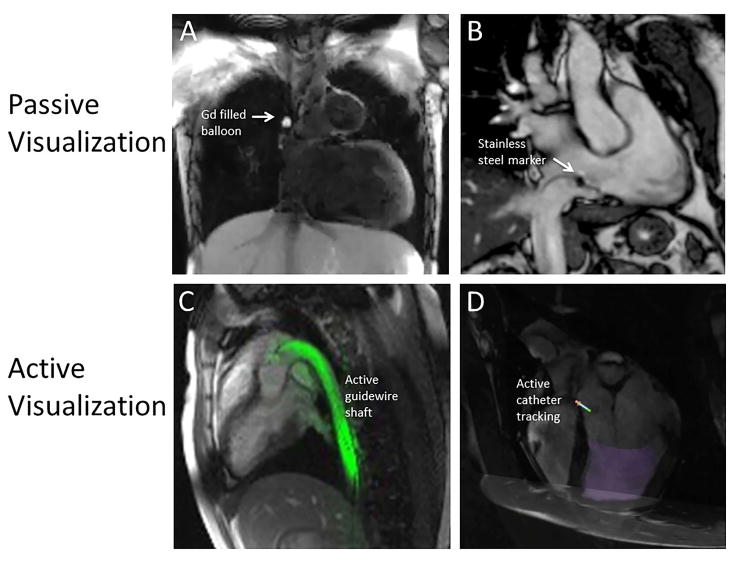
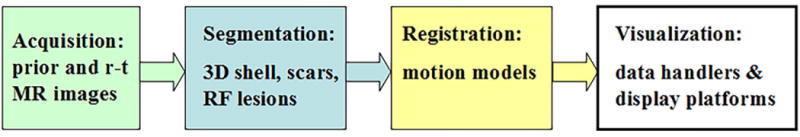
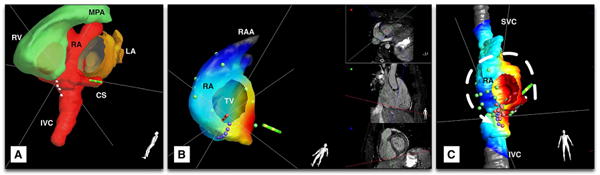
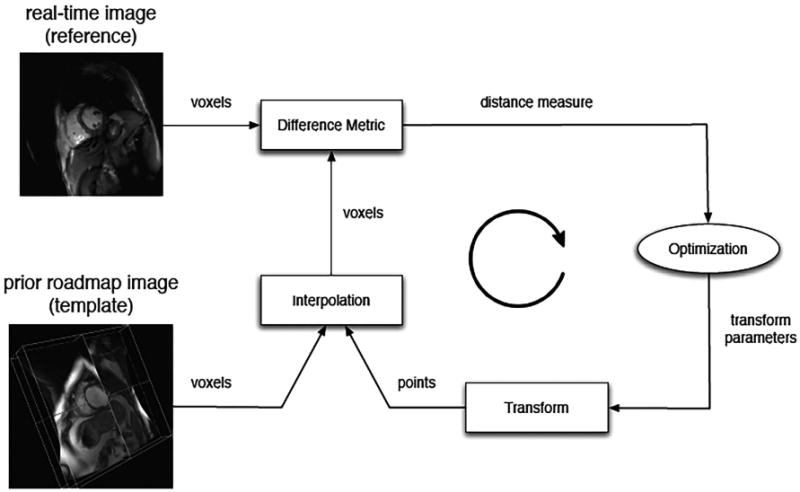
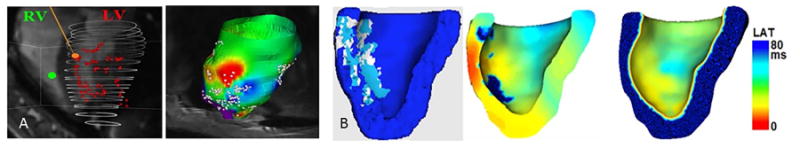
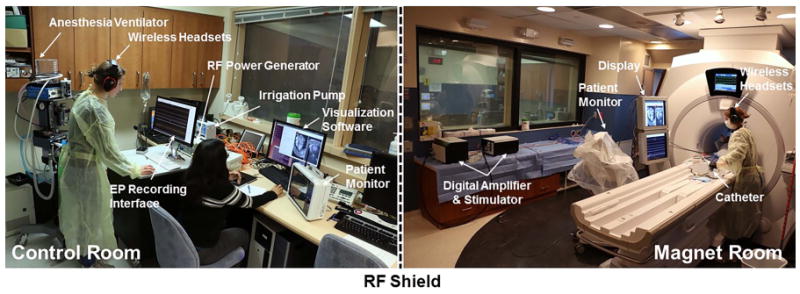
Cardiac magnetic resonance imaging (MRI) is appealing to guide complex cardiac procedures because it is ionizing radiation-free and offers flexible soft-tissue contrast. Interventional cardiac MR promises to improve existing procedures and enable new ones for complex arrhythmias, as well as congenital and structural heart disease. Guiding invasive procedures demands faster image acquisition, reconstruction and analysis, as well as intuitive intraprocedural display of imaging data. Standard cardiac MR techniques such as 3D anatomical imaging, cardiac function and flow, parameter mapping, and late-gadolinium enhancement can be used to gather valuable clinical data at various procedural stages. Rapid intraprocedural image analysis can extract and highlight critical information about interventional targets and outcomes. In some cases, real-time interactive imaging is used to provide a continuous stream of images displayed to interventionalists for dynamic device navigation. Alternatively, devices are navigated relative to a roadmap of major cardiac structures generated through fast segmentation and registration. Interventional devices can be visualized and tracked throughout a procedure with specialized imaging methods. In a clinical setting, advanced imaging must be integrated with other clinical tools and patient data. In order to perform these complex procedures, interventional cardiac MR relies on customized equipment, such as interactive imaging environments, in-room image display, audio communication, hemodynamic monitoring and recording systems, and electroanatomical mapping and ablation systems. Operating in this sophisticated environment requires coordination and planning. This review provides an overview of the imaging technology used in MRI-guided cardiac interventions. Specifically, this review outlines clinical targets, standard image acquisition and analysis tools, and the integration of these tools into clinical workflow.

Level of evidence: 1 Technical Efficacy: Stage 5 J. Magn. Reson. Imaging 2017;46:935-950.

Keywords: cardiac; fast acquisition; image analysis; intervention; real-time.


Figures

Figure 1
Figure 1
RF lesion on the anterior left ventricular wall of a swine. Elevated T2 surrounding the ablation site in (A) (T2 overlaid on anatomical T2-weighted image) demonstrated the development of edema. The more focal hyperenhancement in T1-weighted IR-SSFP (B), consistent with prior studies, likely reflected necrosis. (C) 3D late enhancement acquired 17 min after gadolinium injection. (D) Gross pathology. The scale bar indicates 1 cm (Figure courtesy to Philippa Krahn, Sunnybrook).
Figure 2
Figure 2
Schematic diagram of real-time imaging with interactive control. High frame rate images are continuously acquired. The image acquisition and reconstruction scheme adapts to real-time instructions from the graphical interactive environment. Image and device data returns to interactive environment for display with low-latency.
Figure 3
Figure 3
Examples of passive and active device visualization. A) Gadolinium-filled balloon tip catheter in the superior vena cava. Image contrast is created using a flow-sensitive dark blood saturation pulses during real-time bSSFP imaging. B) Stainless steel imaging marker on a passive catheter (Imricor Medical Systems, Burnsville, MN, USA). C) Color overlay of active guidewire (loopless antenna) depicting the entire device shaft in-plane. D) Active tracking coils used to overlay catheter tip position and orientation on a preacquired image (Imricor Medical Systems, Burnsville, MN, USA).
Figure 4
Figure 4
Diagram of workflow to integrate segmented MR images and registration steps into visualization platforms for MRI-guided interventions.
Figure 5
Figure 5
Segmentation of MR images for catheter navigation: (a) MRI-based segmented 3D whole heart, with left ventricle removed. Note the integration of automated (right ventricle (RV) and left atrium (LA)) segmentations and manual segmentation (right atrium (RA) with coronary sinus (CS) and inferior vena cava (IVC)); (b) reconstructed 3D shell of the RA with color-coded activation map recorded on pacing from the CS (green catheter icon) (red corresponds to early activation times); and c) ablation lesions (pink dots) relative to the anatomic model, with intended ablation line shown in purple dots. A line of conduction block has been created at the location of the ablation lesions, leading to the alteration of intracardiac conduction to take an anticlockwise path around the tricuspid valve (TV) annulus on pacing from the CS. RAA: right atrial appendage.
Figure 6
Figure 6
A general registration framework for aligning RT and prior images is shown. In each iteration, a difference measure reflecting misalignment between the reference and transformed template image is calculated and a spatial transformation is then applied to the template image to minimize the difference, with the process repeated until acceptable alignment is achieved (Figure courtesy Dr. Robert Xu, Sunnybrook).
Figure 7
Figure 7
Integration of real time MRI-guided EP data with predictive computer models in an infarcted pig case: (a) real time EP mapping of the left ventricle (LV) under pacing from right ventricle (left) and associated late activation times (LAT) maps projected onto the LV surface mesh built from prior cine data (right); and (b) MCLE-derived mesh with scar (light blue), VT substrate (white) and healthy zones (dark blue) segmented and labelled correspondingly (left), output of the 3D predictive model (center); and measured LAT map projected onto the MCLE-derived mesh showing a pattern similar to the measured LAT map (right), where red corresponds to early depolarization times.
Figure 8
Figure 8
The interventional MR setup, at the Sunnybrook Research Institute, for electrophysiology procedures is shown.

References

    1. Andreassi MG, Ait-Ali L, Botto N, Manfredi S, Mottola G, Picano E. Cardiac catheterization and long-term chromosomal damage in children with congenital heart disease. Eur Heart J. 2006;27:2703–2708. - PubMed
    1. Johnson JN, Hornik CP, Li JS, et al. Cumulative radiation exposure and cancer risk estimation in children with heart disease. Circulation. 2014;130:161–167. - PMC - PubMed
    1. Andreassi MG, Piccaluga E, Guagliumi G, Del Greco M, Gaita F, Picano E. Occupational Health Risks in Cardiac Catheterization Laboratory Workers. Circ Cardiovasc Interv. 2016;9:e003273. - PubMed
    1. Wijnmaalen AP, Van Der Geest RJ, Van Huls Van Taxis CFB, et al. Head-to-head comparison of contrast-enhanced magnetic resonance imaging and electroanatomical voltage mapping to assess post-infarct scar characteristics in patients with ventricular tachycardias: Real-time image integration and reversed registration. Eur Heart J. 2011;32:104–114. - PubMed
    1. Yang Y, Connelly KA, Zeidan-Shwiri T, et al. Multi-contrast late enhancement CMR determined gray zone and papillary muscle involvement predict appropriate ICD therapy in patients with ischemic heart disease. J Cardiovasc Magn Reson. 2013;15:57. - PMC - PubMed

Publication types

MeSH terms