. 2017 May 11;12(5):e0176985.
doi: 10.1371/journal.pone.0176985. eCollection 2017.

A diffusion based study of population dynamics: Prehistoric migrations into South Asia

Affiliations

A diffusion based study of population dynamics: Prehistoric migrations into South Asia

Mayank N Vahia et al. PLoS One. .

Abstract

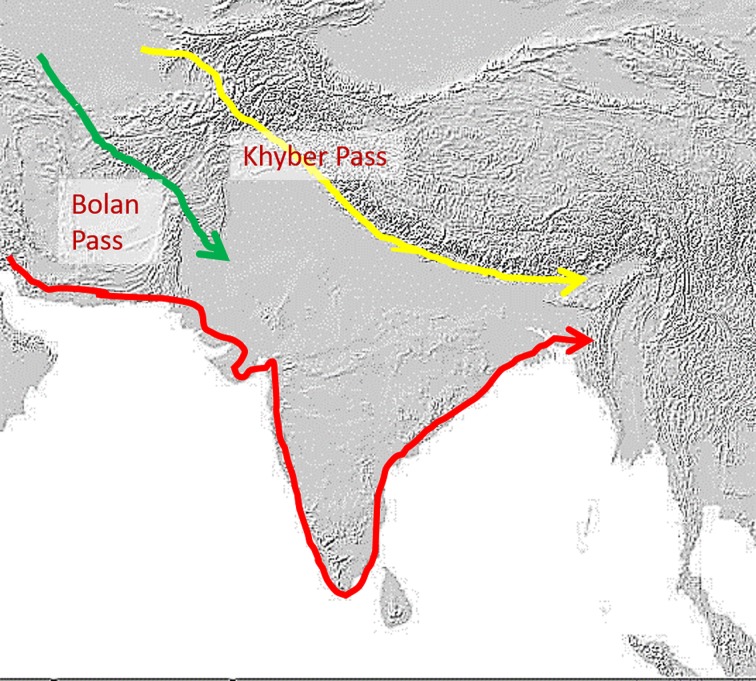
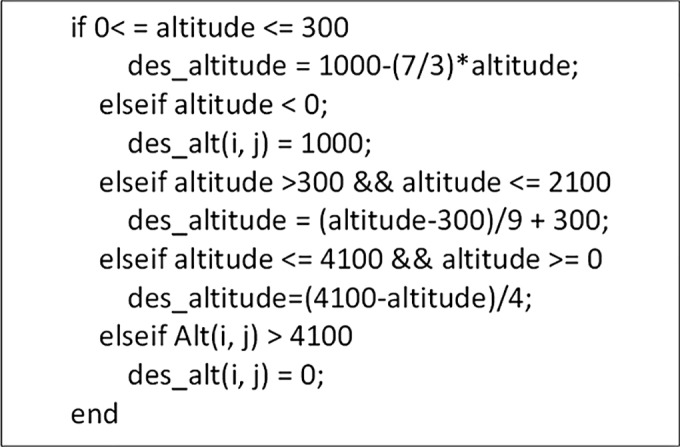
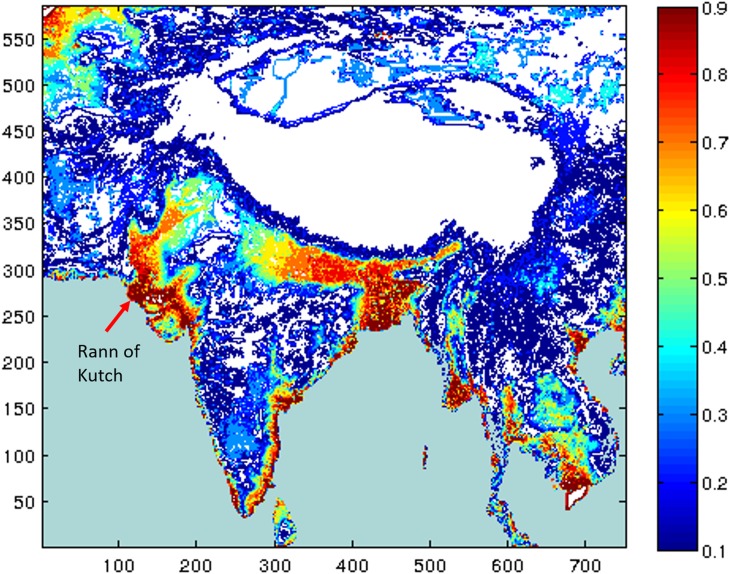
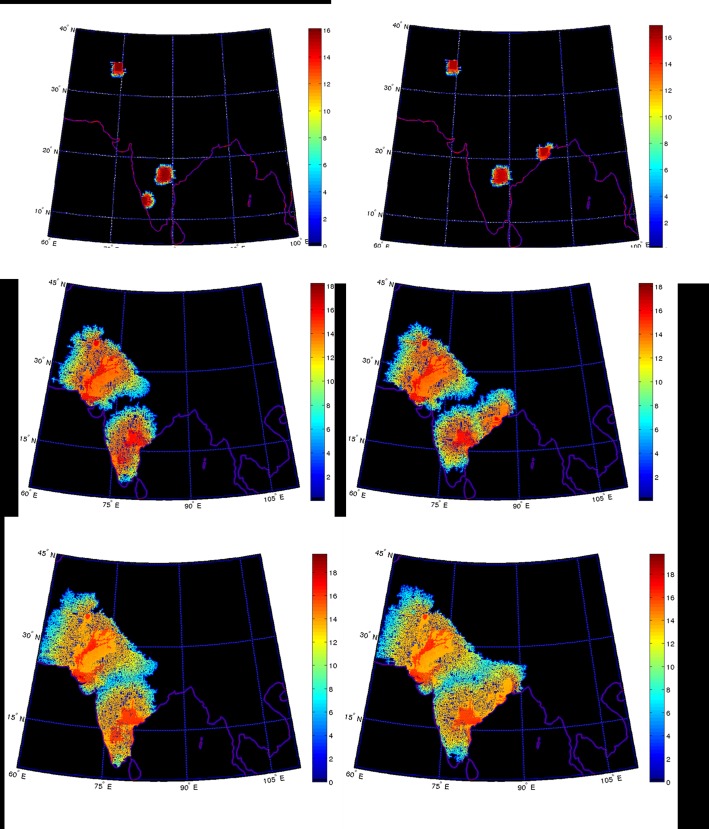
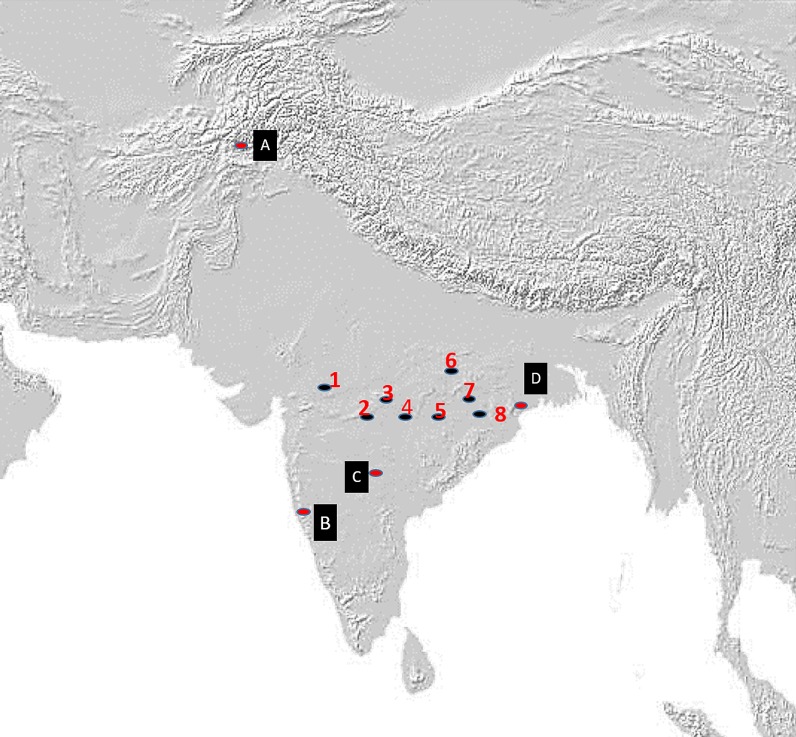
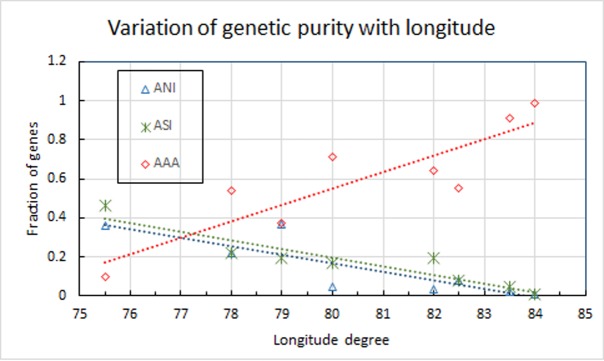
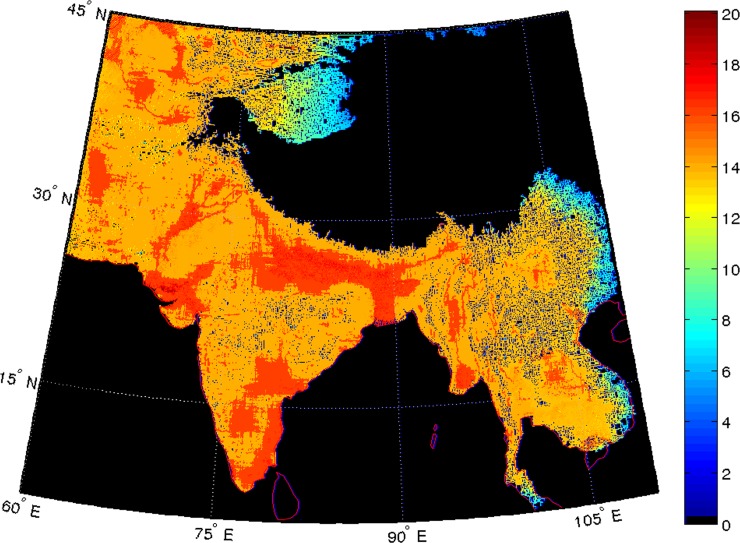
A diffusion equation has been used to study migration of early humans into the South Asian subcontinent. The diffusion equation is tempered by a set of parameters that account for geographical features like proximity to water resources, altitude, and flatness of land. The ensuing diffusion of populations is followed in time-dependent computer simulations carried out over a period of 10,000 YBP. The geographical parameters are determined from readily-available satellite data. The results of our computer simulations are compared to recent genetic data so as to better correlate the migratory patterns of various populations; they suggest that the initial populations started to coalesce around 4,000 YBP before the commencement of a period of relative geographical isolation of each population group. The period during which coalescence of populations occurred appears consistent with the established timeline associated with the Harappan civilization and also, with genetic admixing that recent genetic mapping data reveal. Our results may contribute to providing a timeline for the movement of prehistoric people. Most significantly, our results appear to suggest that the Ancestral Austro-Asiatic population entered the subcontinent through an easterly direction, potentially resolving a hitherto-contentious issue.


Conflict of interest statement

Competing Interests: The authors have declared that no competing interests exist.

Figures

Fig 1
Fig 1. Potential migration routes.
Some potential migration routes of various population groups entering the South Asian subcontinent more than 30,000 years ago. Red indicates the path of the earliest migrants along the coastal route; Yellow denotes entrants from the Khyber Pass and green indicates the path taken by migrants from Iran via the Bolan Pass.
Fig 2
Fig 2. Algorithm used.
The algorithm used for sensitivity of habitability on altitude.
Fig 3
Fig 3. Habitability.
Habitability of locations in the landmass of the South Asian subcontinent. The red regions indicate highly habitable places; white zones denote regions that lie more than 4,000 meters above sea level and are, therefore, deemed uninhabitable. Note that the Rann of Kutch is considered highly habitable due to the fact that it is below sea level and our computer algorithm assumes that all regions below sea level have adequate potable water.
Fig 4
Fig 4. Computer simulations of population dynamics.
Computer simulations of the population dynamics of the South Asian subcontinent using two different initial geographical locations (panels a and d). Panels b and e represent progress of the simulation after 500 steps (~4,000 years), and panels c and f after 800 steps (~6,400 years). Note the high degree of similarity in the “final” population maps in panels c and f.
Fig 5
Fig 5. Location of some central Indian tribes.
Location of tribes of Central India selected for genetic comparison (13, 24) and the simulation. A-D: Initial locations of the start of our computer simulation. A is located at present-day Balkh in present-day Afghanistan, B is at Goa, C is at Hyderabad, and D is located in Bastar in present-day Orissa. Location of the eight tribes used in the present study are marked using numerals 1 to 8 as follows: 1- Bhil, 2- Sahariya, 3- Gond, 4- Ho, 5- Santal, 6- Bharia, 7- Korwa, 8- Birhor.
Fig 6
Fig 6. Latitude-dependence of relative gene fractions.
Plot of longitude pertaining to the genetic data for different tribes as a function of the relative fraction of ANI, ASI, and AAA genes amongst them. The lines joining the points are the best fits. Note that as one travels from West to East, the fraction of ANI and ASI genes decreases monotonically. On the other hand, the fraction of AAA genes increases. This observation is consistent with the results of our simulations (Fig 4F).
Fig 7
Fig 7. Extended simulations.
Temporal extension of the simulation from 800 steps (Fig 3F) to 4,000 steps. The population is seen to skirt around the Tibetan plateau and spread into eastern China. The simulation also suggests that the population entering the Taklamakan Desert would have had a single entry point from the east.

Similar articles

Cited by

References

    1. Barceló JA, Castillo FD, editors. Simulating Prehistoric and Ancient Worlds, Springer; 2016.
    1. Vahia MN, Ladiwala U, Mahathe P, Mathur D., Population Dynamics of Early Human Migration in Britain. PLoS ONE. 2016; 11(5): e0154641 doi: 10.1371/journal.pone.0154641 - DOI - PMC - PubMed
    1. Tamang R, Thangaraj K. Genomic view on the peopling of India. Investig. Genet. 2012; 3: 20 doi: 10.1186/2041-2223-3-20 - DOI - PMC - PubMed
    1. Normile D. SNP study supports southern migration route to Asia. Science. 2009; 326: 1470–1476. doi: 10.1126/science.326.5959.1470 - DOI - PubMed
    1. Reich D, Thangaraj K, Patterson N, Price AL, Singh L. Reconstructing Indian population history. Nature. 2009; 461: 489–494. doi: 10.1038/nature08365 - DOI - PMC - PubMed

Publication types

LinkOut - more resources