. 2017 May 11;12(5):e0177489.
doi: 10.1371/journal.pone.0177489. eCollection 2017.

Ezrin interacts with S100A4 via both its N- and C-terminal domains

Affiliations

Ezrin interacts with S100A4 via both its N- and C-terminal domains

Beáta Biri-Kovács et al. PLoS One. .

Abstract

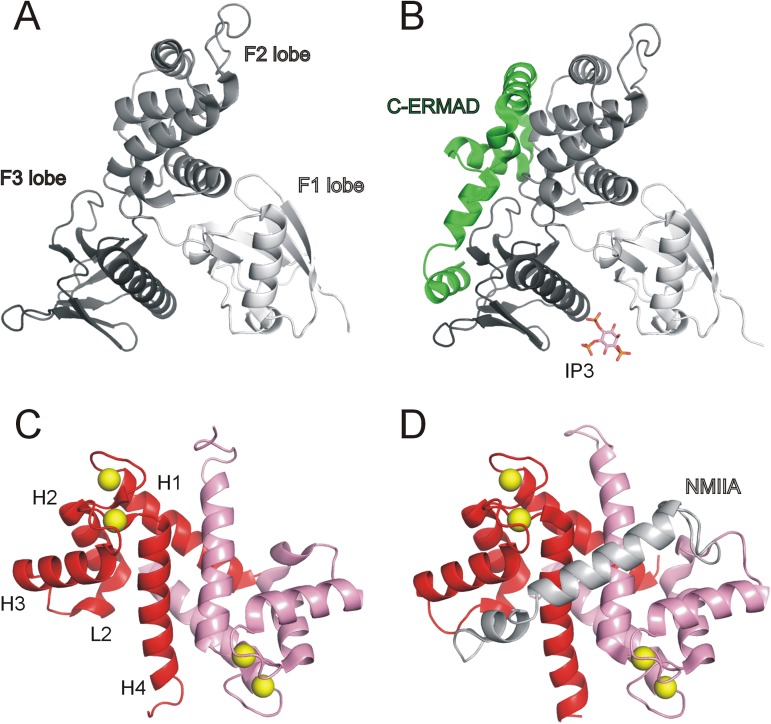
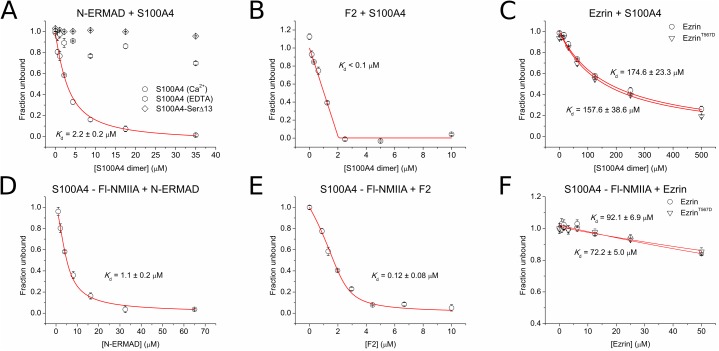
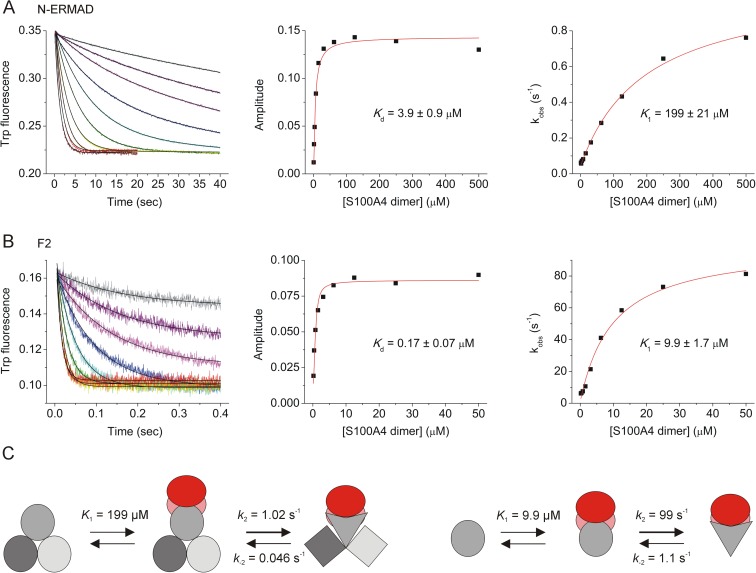
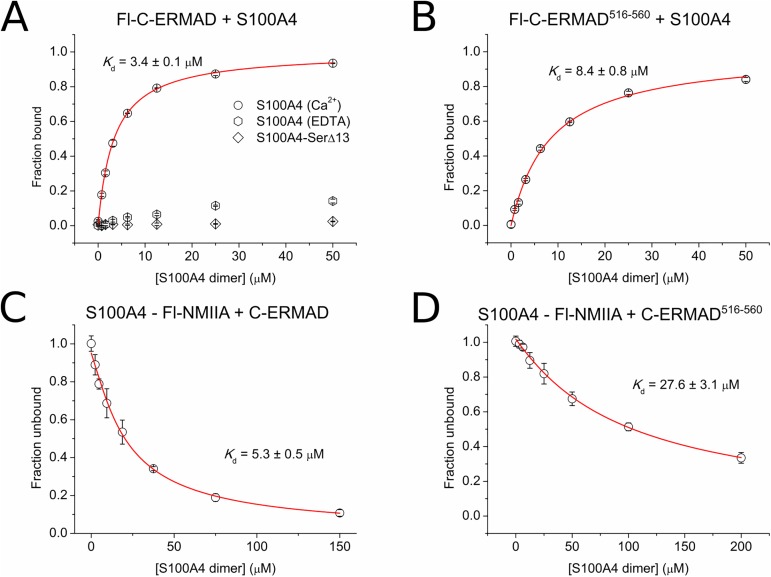
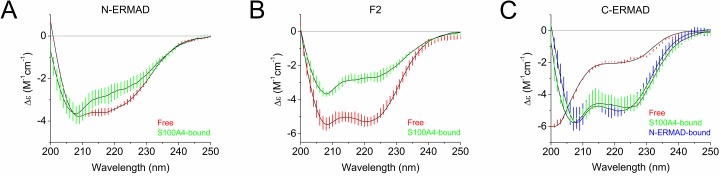
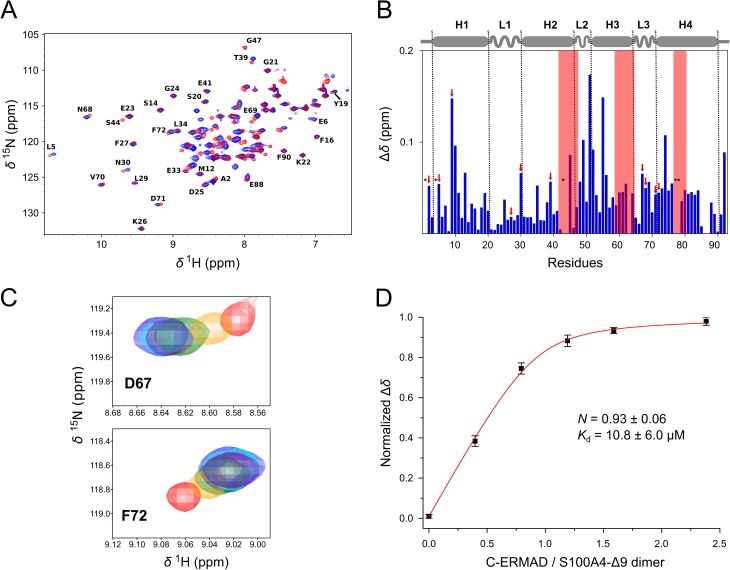
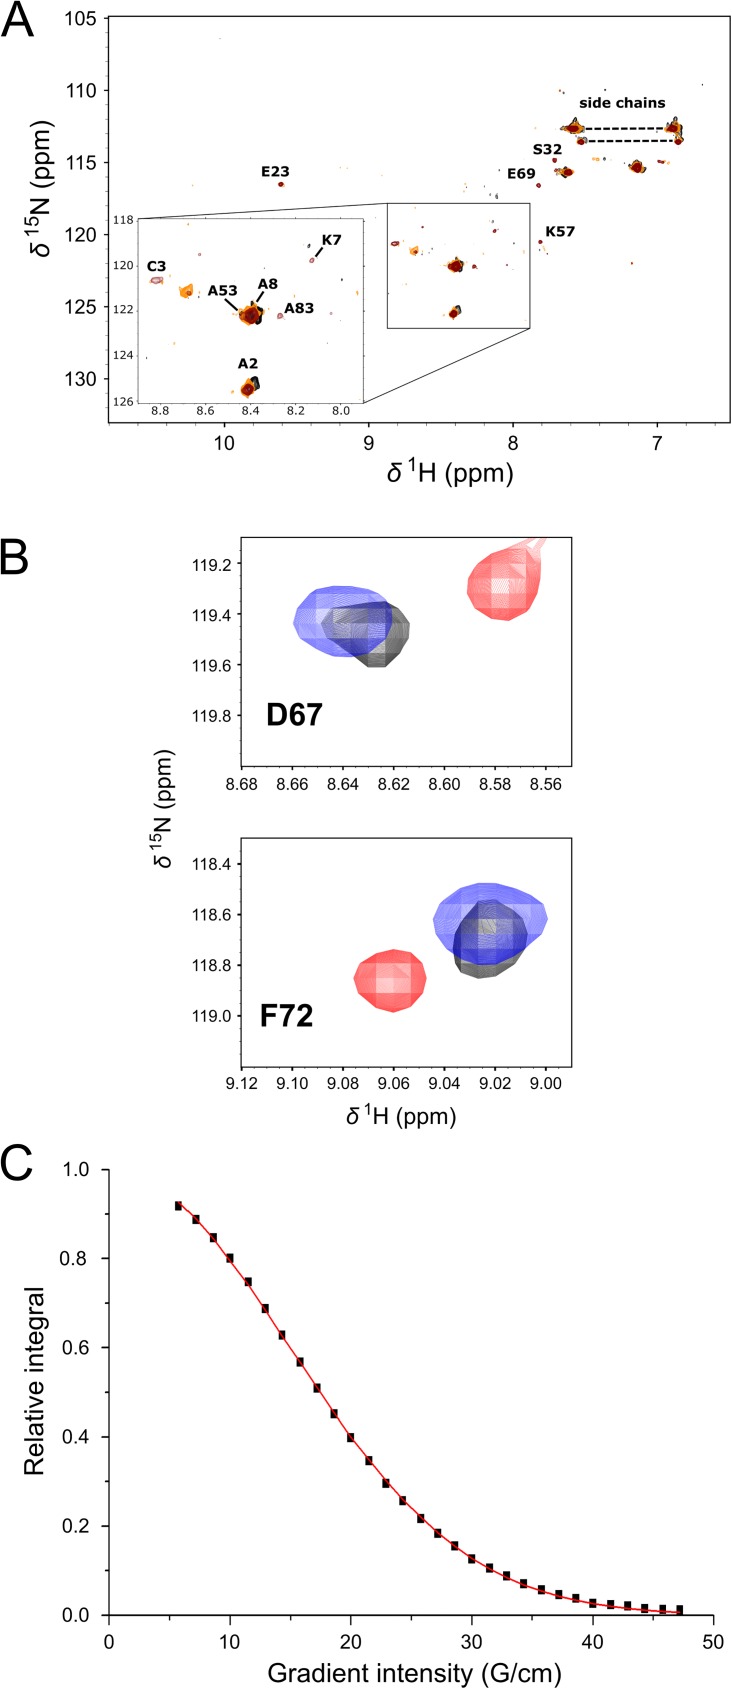
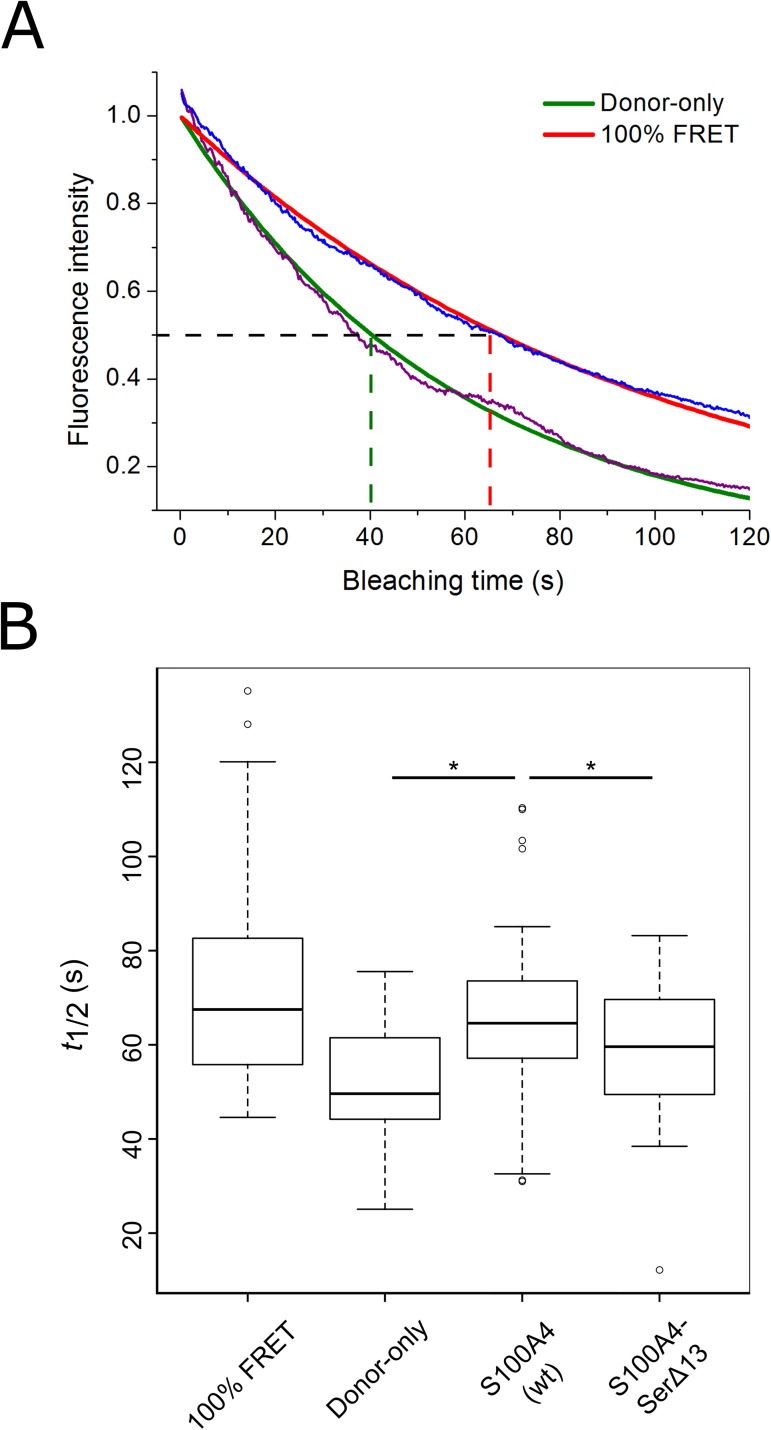
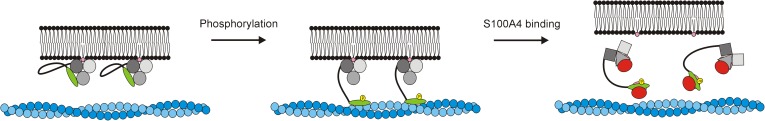
Ezrin belongs to the ERM (ezrin, radixin, moesin) protein family that has a role in cell morphology changes, adhesion and migration as an organizer of the cortical cytoskeleton by linking actin filaments to the apical membrane of epithelial cells. It is highly expressed in a variety of human cancers and promotes metastasis. Members of the Ca2+-binding EF-hand containing S100 proteins have similar pathological properties; they are overexpressed in cancer cells and involved in metastatic processes. In this study, using tryptophan fluorescence and stopped-flow kinetics, we show that S100A4 binds to the N-terminal ERM domain (N-ERMAD) of ezrin with a micromolar affinity. The binding involves the F2 lobe of the N-ERMAD and follows an induced fit kinetic mechanism. Interestingly, S100A4 binds also to the unstructured C-terminal actin binding domain (C-ERMAD) with similar affinity. Using NMR spectroscopy, we characterized the complex of S100A4 with the C-ERMAD and demonstrate that no ternary complex is simultaneously formed with the two ezrin domains. Furthermore, we show that S100A4 co-localizes with ezrin in HEK-293T cells. However, S100A4 very weakly binds to full-length ezrin in vitro indicating that the interaction of S100A4 with ezrin requires other regulatory events such as protein phosphorylation and/or membrane binding, shifting the conformational equilibrium of ezrin towards the open state. As both proteins play an important role in promoting metastasis, the characterization of their interaction could shed more light on the molecular events contributing to this pathological process.


Conflict of interest statement

Competing Interests: The authors have declared that no competing interests exist.

Figures

Fig 1
Fig 1. Structural overview of ezrin and S100A4 proteins.
(A) Crystal structure of the human ezrin N-ERMAD (PDB ID: 4RMA). (B) Crystal structure of full-length human ezrin (PDB ID: 4RM8). Note that the 160 residue-long α-helical domain, which connects the N-ERMAD and the C-ERMAD, and the N-terminal 39 residues of the C-ERMAD (Val477-Glu515) are not visible in the crystal structure. Crystal structure of mouse radixin N-ERMAD in complex with inositol-(1,4,5)-trisphosphate (IP3; PDB ID: 1GC6) was used to demonstrate the putative lipid-binding site of ezrin. (C) Crystal structure of calcium-bound S100A4 (PDB ID: 3C1V) and (D) calcium-bound S100A4 complexed with non-muscle myosin IIA (NMIIA) C-terminal fragment (PDB ID: 3ZWH).
Fig 2
Fig 2. Interaction of the N-ERMAD with S100 proteins.
(A-C) Tryptophan fluorescence-based binding experiments were performed using 2 μM N-ERMAD, F2 lobe and ezrin (or ezrinT567D), respectively, with S100A4. (D-F) In a competitive FP assay, the known S100A4-partner NMIIA1908-1937 peptide (fluorescein-conjugated, 50 nM) was preincubated with 4 μM S100A4 (dimeric concentration) and titrated with the N-ERMAD, F2 lobe or full-length ezrin (or its variant), respectively. Each data point represents the mean ± SEM of three independent experiments. The data were fitted using a quadratic (A-C) or competitive binding equation (D-F) (red line).
Fig 3
Fig 3. Transient kinetic analysis of the S100A4-N-ERMAD interaction.
(A, B) 2 μM N-ERMAD or F2 lobe (respectively) was mixed with an equal volume of S100A4 in different concentrations and a decrease in intrinsic Trp fluorescence was monitored over time (left panel). The equilibrium dissociation constant (Kd) was calculated by fitting the amplitude data to the quadratic binding equation (middle panel). The plot of kobs values versus S100A4 concentration (right panel) was used to obtain the binding constant K1 and the isomerization rate constants (k2 and k-2) by fitting a hyperbola to the data points. (C) Schematic illustration of the measured kinetic models for the N-ERMAD (left) and the isolated F2 lobe (right). After the binding of S100A4 dimer (subunits are red and pink) to F2 lobe (gray) a rapid isomerization of the complex occurs resulting in the structural rearrangement of not only F2 lobe, but also F1 and F3 lobes (light gray and dark gray, respectively).
Fig 4
Fig 4. Interaction of the C-ERMAD with S100A4.
(A) Fl-C-ERMAD (50 nM) was titrated with S100A4 and S100A4-SerΔ13. (B) Fl-C-ERMAD516–560 (50 nM) was titrated with S100A4. (C, D) Competitive FP measurement of Fl-NMIIA-bound S100A4 with the C-ERMAD and the C-ERMAD516–560, respectively. Each data point represents the mean ± SEM of three independent experiments. The data were fitted using a competitive binding equation (red line).
Fig 5
Fig 5. Structural changes in ezrin constructs upon S100A4 binding.
(A) CD spectrum of free (red) and S100A4-bound (green) N-ERMAD. (B) CD spectrum of free (red) and S100A4-bound (green) F2 lobe. (C) CD spectrum of free (red), S100A4-bound (green) and the N-ERMAD-bound (blue) C-ERMAD. The CD spectra of the S100A4-bound ezrin fragments and the N-ERMAD-bound C-ERMAD were calculated by the subtraction of the CD spectrum of free S100A4 or N-ERMAD, respectively, from that of the complex assuming that the secondary structures of S100A4 and the N-ERMAD do not change upon complex formation. The colored vertical lines show the ± SEM of two independent experiments. The experimental data were fitted by the BeStSel software (black line).
Fig 6
Fig 6. NMR spectroscopic analysis of the S100A4-C-ERMAD complex.
(A) 1H-15N HSQC spectra of 0.4 mM free S100A4-Δ9 dimer (red) and upon addition of 0.6 mM C-ERMAD (blue) at 700 MHz and 300 K (for clarity not all assignments are shown) (B) Chemical shift mapping (Δδ) of S100A4 peaks upon C-ERMAD binding. Red frames indicate the three regions that are significantly broadened upon complex formation (i.e. the half width of the Lorentzian peak in 1H dimension increased by more than 50%, for residues Ser44, Asp63, Val77 and Phe78). Asterisks show peaks that are either not detected or assignment is ambiguous. Secondary structural elements are shown above the graph. Red arrows show the residues of which the titration data were applied for the determination of binding parameters. (C) Titration of 15N-labeled S100A4-Δ9 with unlabeled C-ERMAD resulted in the gradual shift of peaks e. g. Asp67 and Phe72. The C-ERMAD / S100A4-Δ9 dimer ratio was 0 (red), 0.35 (orange), 0.7 (green), 1.05 (purple), 1.4 (cyan) and 2.1 (blue). (D) The mean ± SEM of the normalized chemical shift perturbations of ten S100A4-Δ9 residues (Ala2, Leu5, Leu9, Phe27, Asn30, Thr39, Asp67, Asn68, Asp71, Phe72) were plotted against the molar ratio of C-ERMAD to S100A4-Δ9 dimer. Red line indicates the fit to the quadratic binding equation yielding the binding affinity (Kd) and stoichiometry (N).
Fig 7
Fig 7. NMR spectroscopy analysis of the S100A4-N-ERMAD interaction.
(A) 1H-15N HSQC spectra of the 1:1 complex of the N-ERMAD: S100A4-Δ9 dimer (black) and upon addition of C-ERMAD present in 1:1 (orange) and 1:2 molar ratio (maroon). Note that most peaks are broadened below the detection limit. (B) However, successive addition of the C-ERMAD results in the appearance of peaks that coincide to the positions in the C-ERMAD-S100A4-Δ9 complex: Asp67 and Phe72. Free S100A4-Δ9 peaks are shown in red, peaks of the C-ERMAD-S100A4-Δ9 complex are blue, while the peaks of S100A4-Δ9 in the presence of both the N-ERMAD and the C-ERMAD in a molar ratio of 1:1 and 1:2, respectively, are black. (C) A typical translational diffusion experiment representation for the C-ERMAD- S100A4-Δ9 complex integrated in the 1.892–1.276 ppm region: the decay of integrated signal intensity-gradient strength where squares represent measured points and the fitted Stejskal-Tanner equation (that leads to the determination of diffusion constant) is presented in a continuous red curve.
Fig 8
Fig 8. S100A4 interacts with ezrin in living HEK-293T cells.
For FRET measurements, HEK-293T cells were co-transfected with pEGFP-ezrin and pmCherry-S100A4/S100A4-SerΔ13. As controls, cells transfected with pEGFP-ezrin alone (donor-only) or pEGFP-mCherry (100% FRET) were used. Donor photobleaching was performed by confocal microscopy, time constants of at least 80 ROI per sample were determined. (A) Two representative photobleaching curves from donor-only and 100% FRET samples (shown in violet and blue, respectively), the fitted exponential decay curves (green and red lines, respectively) and the calculated time constants (t1/2, marked with dashed lines). (B) Box-and-Whisker plots showing time constants of each sample were generated. Statistical analysis was performed using the Games-Howell test regarding the unequal sample size and inhomogeneous variance. Significant differences (p < 0.05) comparing S100A4 (wt) sample with others are marked with asterisk.
Fig 9
Fig 9. Proposed mechanism of ezrin regulation by S100A4-binding.
In the dormant state, ezrin shows limited cross-linking activity of the actin cytoskeleton (blue) to the plasma membrane. PIP2 is bound by the F1 (light gray) and the F3 (dark gray) subdomains. The actin-binding site on the C-ERMAD is masked by the N-ERMAD lobes F2 (gray) and F3 (dark grey). Upon phosphorylation of Thr567 (yellow), ezrin opens up to acquire its active conformation. Binding of S100A4 to the N-ERMAD and the C-ERMAD leads to allosteric and direct inhibition of ezrin function, respectively.

Similar articles

Cited by

References

    1. Neisch AL, Fehon RG. Ezrin, Radixin and Moesin: key regulators of membrane-cortex interactions and signaling. Curr Opin Cell Biol. 2011;23(4):377–82. Epub 2011/05/20. PubMed Central PMCID: PMC3148288. doi: 10.1016/j.ceb.2011.04.011 - DOI - PMC - PubMed
    1. Clucas J, Valderrama F. ERM proteins in cancer progression. J Cell Sci. 2015;128(6):1253 Epub 2015/03/17. doi: 10.1242/jcs.170027 - DOI - PubMed
    1. Barreiro O, Yanez-Mo M, Serrador JM, Montoya MC, Vicente-Manzanares M, Tejedor R, et al. Dynamic interaction of VCAM-1 and ICAM-1 with moesin and ezrin in a novel endothelial docking structure for adherent leukocytes. The Journal of cell biology. 2002;157(7):1233–45. PubMed Central PMCID: PMC2173557. doi: 10.1083/jcb.200112126 - DOI - PMC - PubMed
    1. Granes F, Urena JM, Rocamora N, Vilaro S. Ezrin links syndecan-2 to the cytoskeleton. J Cell Sci. 2000;113 (Pt 7):1267–76. - PubMed
    1. Martin TA, Harrison G, Mansel RE, Jiang WG. The role of the CD44/ezrin complex in cancer metastasis. Critical reviews in oncology/hematology. 2003;46(2):165–86. - PubMed