

Mechanism of down regulation of Na-H exchanger-2 in experimental colitis
- PMID: 28493993
- PMCID: PMC5426621
- DOI: 10.1371/journal.pone.0176767
Mechanism of down regulation of Na-H exchanger-2 in experimental colitis
Abstract
Background: The Na-H exchanger [NHE] performs an electroneutral uptake of NaCl and water from the lumen of the gastrointestinal tract. There are several distinct NHE isoforms, some of which show an altered expression in the inflammatory bowel diseases (IBD). In this study, we examined a role of NHE-2 in experimental colitis.
Methods: Colitis was induced in male Sprague-Dawley rats by intra-rectal administration of trinitrobenzenesulphonic acid (TNBS). On day 6 post-TNBS, the animals were sacrificed, colonic and ileal segments were taken out, cleaned with phosphate buffered saline and used in this study.
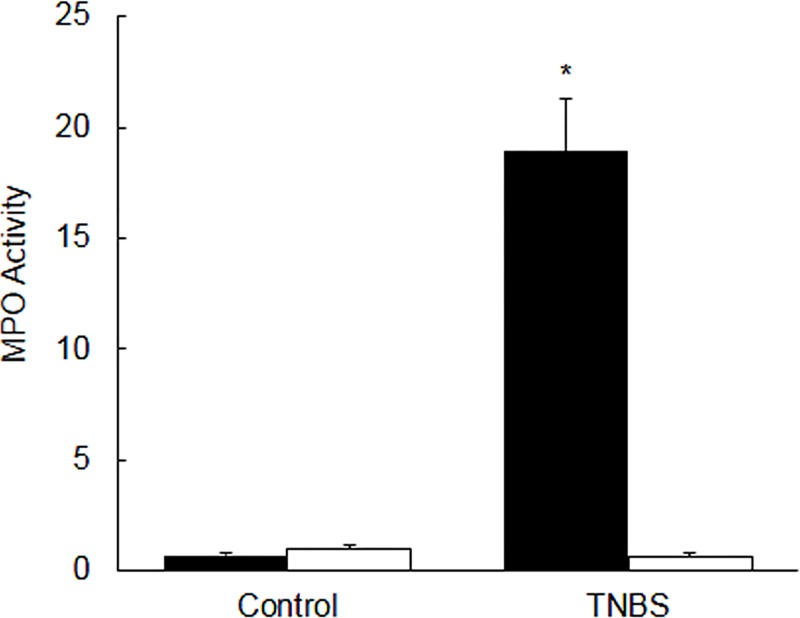
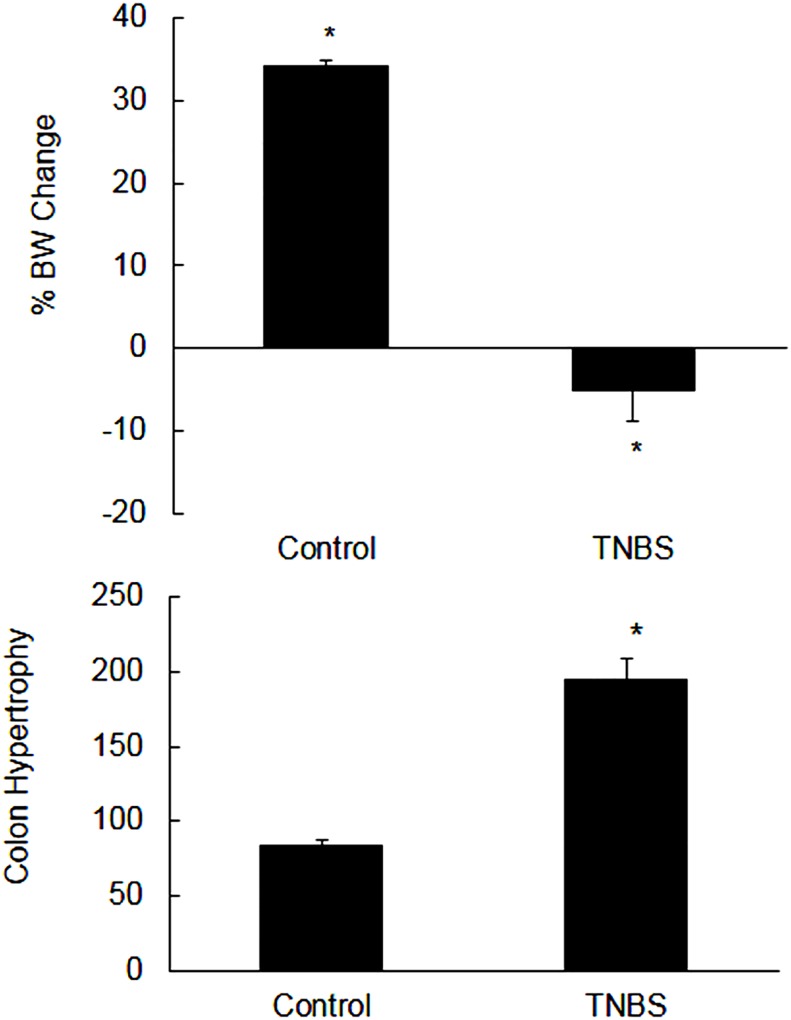
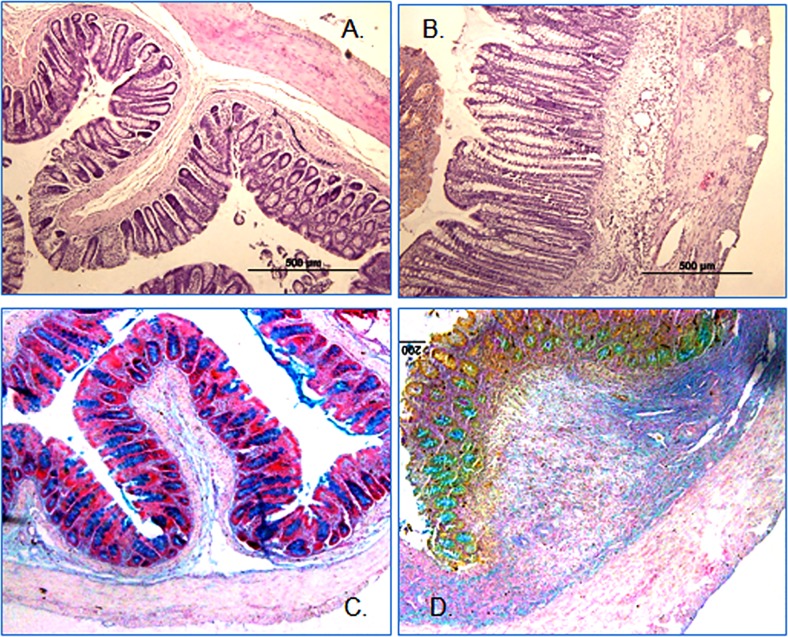
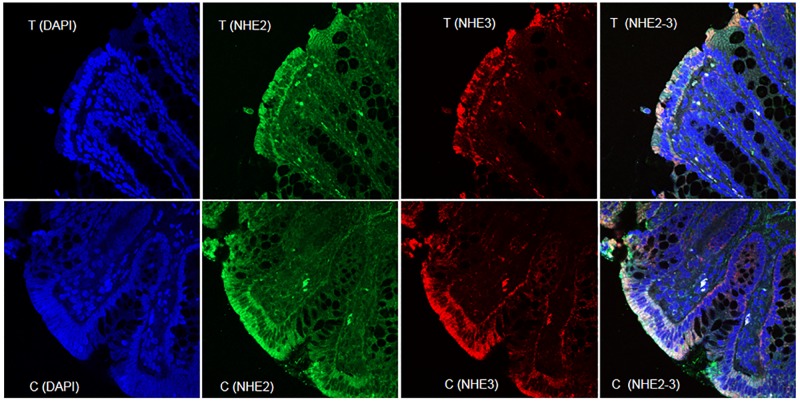
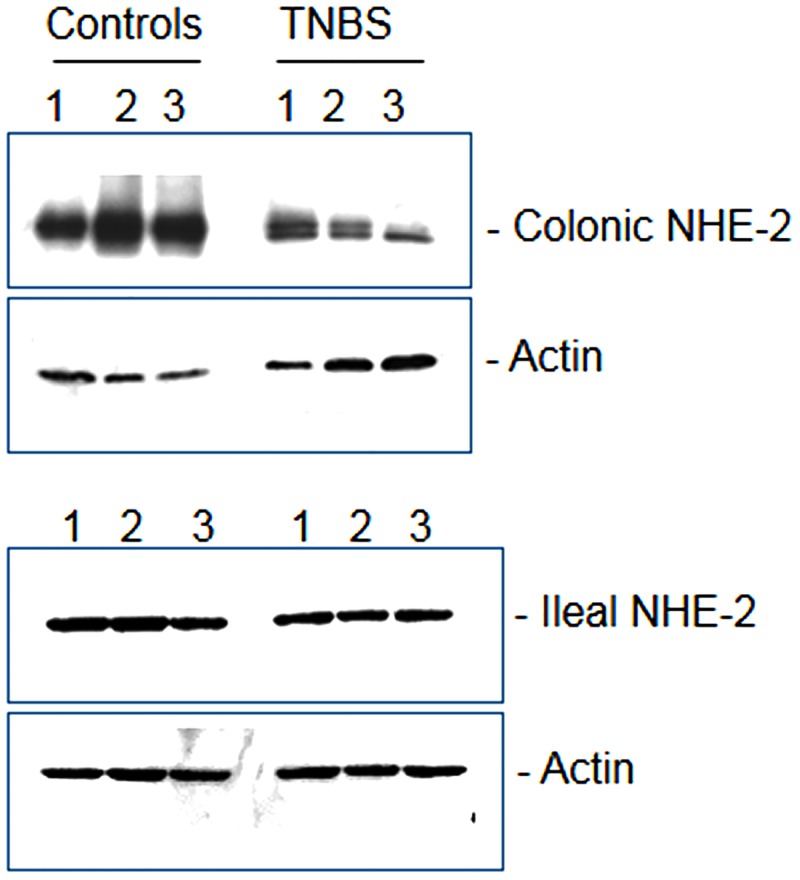
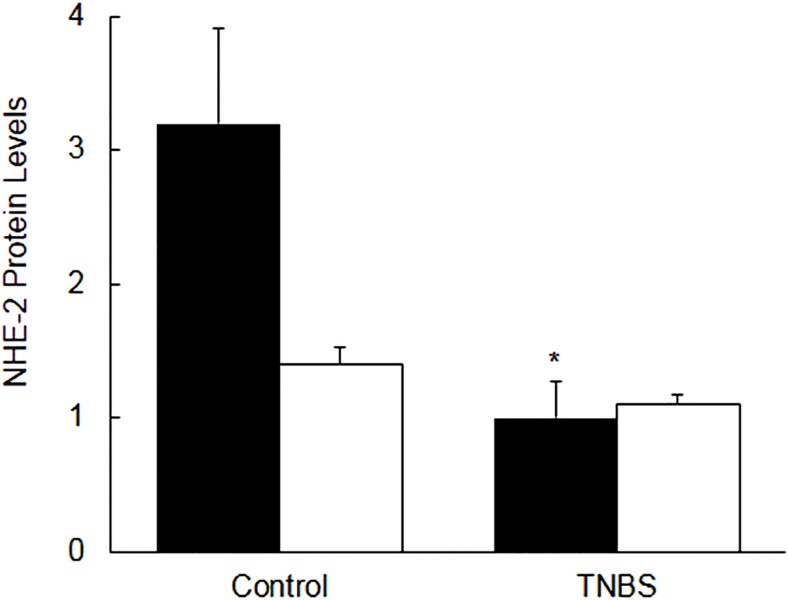
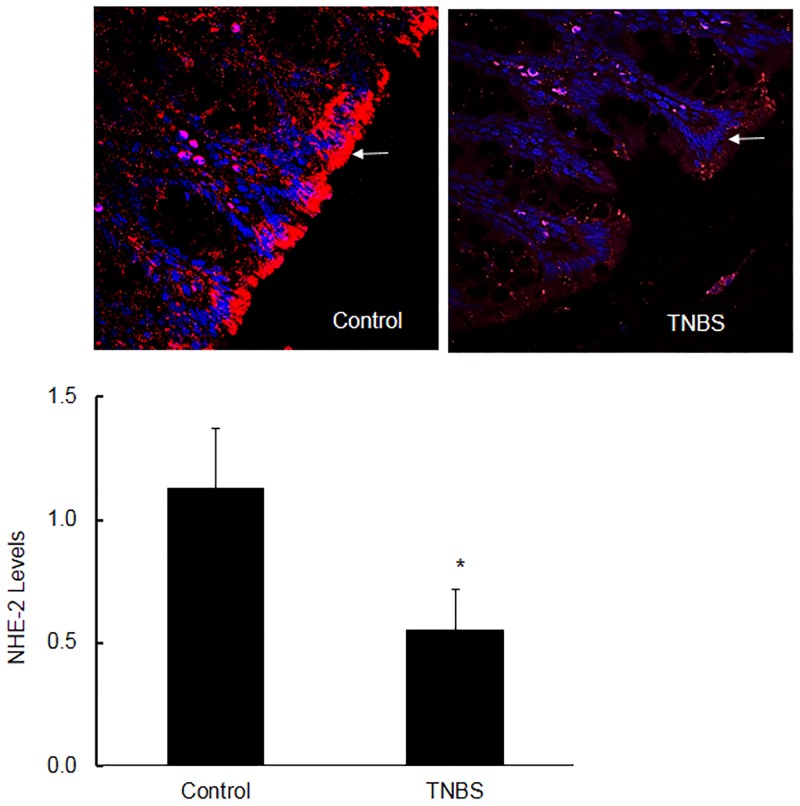
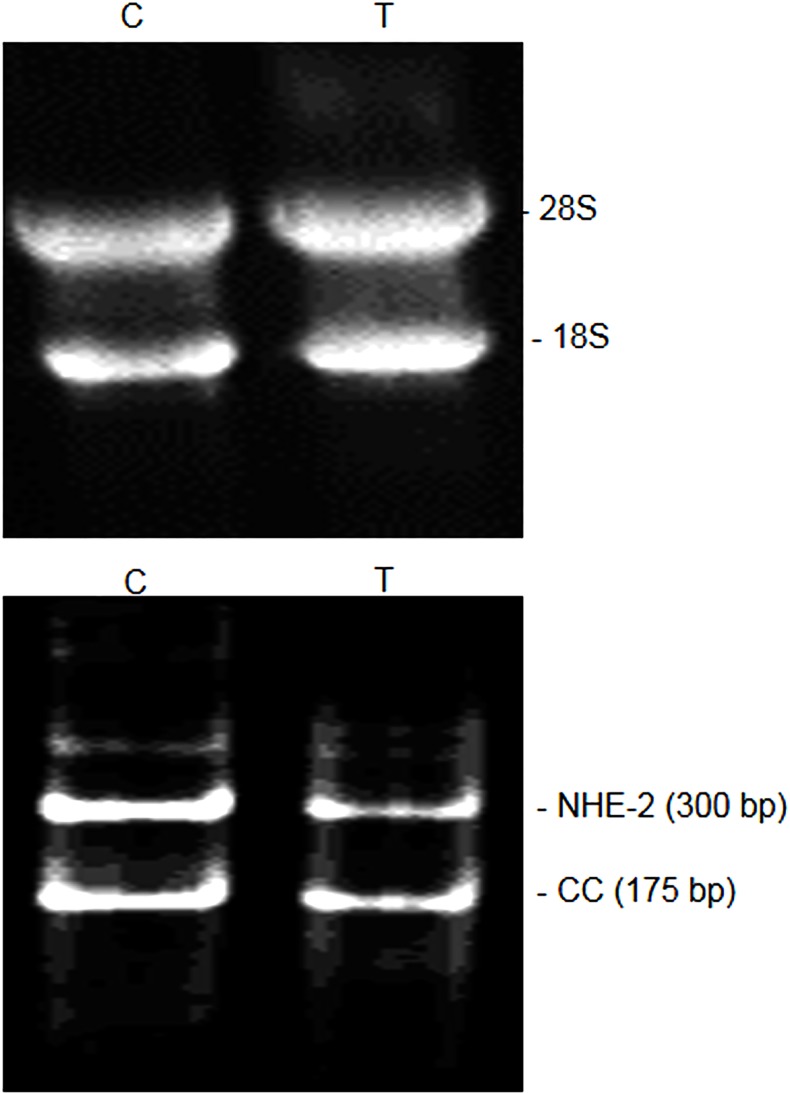
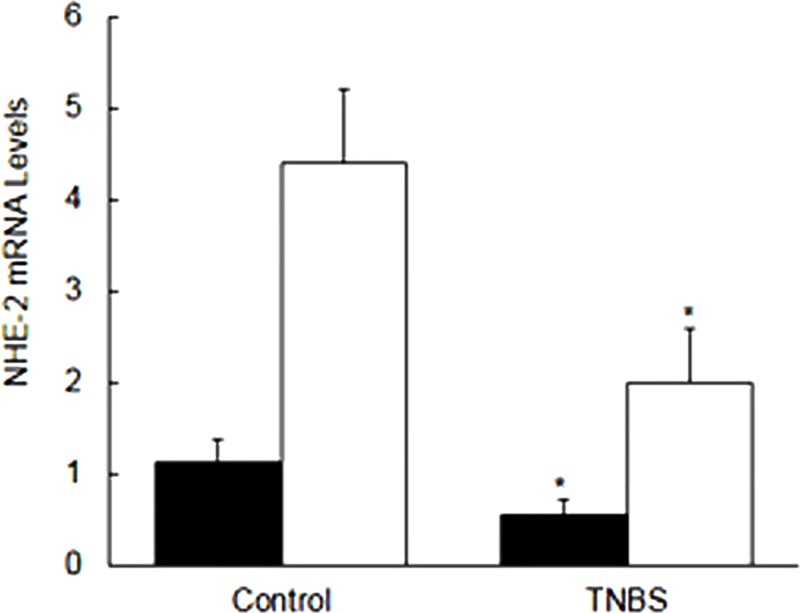
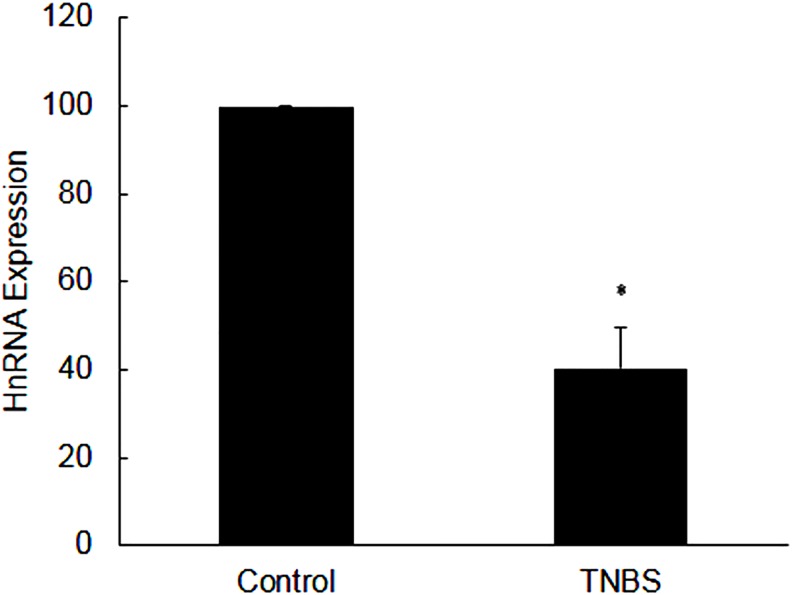
Results: There was a significant decrease in the level of NHE-2 protein as measured by ECL western blot analysis and confocal immunofluorescence microscopy. The levels of NHE-2 mRNA and heteronuclear RNA measured by an end-point RT-PCR and a real time PCR were also decreased significantly in the inflamed colon. However, there was no change in the level of NHE-2 protein in response to in vitro TNF-α treatment of uninflamed rat colonic segment. These changes were selective and localized to the colon as actin, an internal control, remained unchanged. Confocal immunofluorescence microscopy revealed co-localization of NHE-2 and NHE-3 in the brush borders of colonic epithelial cells. Inflamed colon showed a significant increase in myeloperoxidase activity and colon hypertrophy. In addition, there was a significant decrease in body weight and goblet cells' mucin staining in the TNBS treated colon. These changes were not conspicuous in the non-inflamed ileum.
Conclusions: These findings demonstrate suppression of NHE-2 expression on the brush borders in the colonic epithelial cells which is regulated transcriptionally. However a role of TNF-α in the regulation of NHE-2 is discounted in the present model of colitis. This decrease in the NHE-2 expression will lead to a loss of electrolyte and water uptake thus contributing to the symptoms associated with IBD.
Conflict of interest statement
Figures
Similar articles
-
Uncoupling of Carbonic Anhydrase from Na-H exchanger-1 in Experimental Colitis: A Possible Mechanistic Link with Na-H Exchanger.Biomolecules. 2019 Nov 5;9(11):700. doi: 10.3390/biom9110700. Biomolecules. 2019. PMID: 31694264 Free PMC article.
-
(Patho-)Physiology of Na+/H+ Exchangers (NHEs) in the Digestive System.Front Physiol. 2020 Jan 15;10:1566. doi: 10.3389/fphys.2019.01566. eCollection 2019. Front Physiol. 2020. PMID: 32009977 Free PMC article. Review.
-
Altered expression of the Na+/H+ exchanger isoform-3 in experimental colitis: effect of garlic.Mol Cell Biochem. 1999 Oct;200(1-2):77-84. doi: 10.1023/a:1006990027764. Mol Cell Biochem. 1999. PMID: 10569186
-
Antisense inhibition of cyclooxygenase-2 causes a selective suppression of the Na+-H+ exchanger isoform 3 in rat kidney in experimental colitis.Nephron. 2002 May;91(1):120-8. doi: 10.1159/000057613. Nephron. 2002. PMID: 12021528
-
Suppression of Na+/H+ exchanger isoform-3 in human inflammatory bowel disease: lack of reversal by 5'-aminosalicylate treatment.Scand J Gastroenterol. 2009;44(1):56-64. doi: 10.1080/00365520802321253. Scand J Gastroenterol. 2009. PMID: 18785066
Cited by
-
The Role of Claudins in the Pathogenesis of Dextran Sulfate Sodium-Induced Experimental Colitis: The Effects of Nobiletin.Biomolecules. 2024 Sep 4;14(9):1122. doi: 10.3390/biom14091122. Biomolecules. 2024. PMID: 39334888 Free PMC article.
-
Pathophysiological role of ion channels and transporters in gastrointestinal mucosal diseases.Cell Mol Life Sci. 2021 Dec;78(24):8109-8125. doi: 10.1007/s00018-021-04011-5. Epub 2021 Nov 15. Cell Mol Life Sci. 2021. PMID: 34778915 Free PMC article. Review.
-
Pathophysiology of IBD associated diarrhea.Tissue Barriers. 2018;6(2):e1463897. doi: 10.1080/21688370.2018.1463897. Epub 2018 May 8. Tissue Barriers. 2018. PMID: 29737913 Free PMC article. Review.
-
Uncoupling of Carbonic Anhydrase from Na-H exchanger-1 in Experimental Colitis: A Possible Mechanistic Link with Na-H Exchanger.Biomolecules. 2019 Nov 5;9(11):700. doi: 10.3390/biom9110700. Biomolecules. 2019. PMID: 31694264 Free PMC article.
-
(Patho-)Physiology of Na+/H+ Exchangers (NHEs) in the Digestive System.Front Physiol. 2020 Jan 15;10:1566. doi: 10.3389/fphys.2019.01566. eCollection 2019. Front Physiol. 2020. PMID: 32009977 Free PMC article. Review.
References
MeSH terms
Substances
LinkOut - more resources
Full Text Sources
Other Literature Sources
Molecular Biology Databases
Research Materials
