

Spatiotemporal analysis of microbial community dynamics during seasonal stratification events in a freshwater lake (Grand Lake, OK, USA)
- PMID: 28493994
- PMCID: PMC5426677
- DOI: 10.1371/journal.pone.0177488
Spatiotemporal analysis of microbial community dynamics during seasonal stratification events in a freshwater lake (Grand Lake, OK, USA)
Abstract
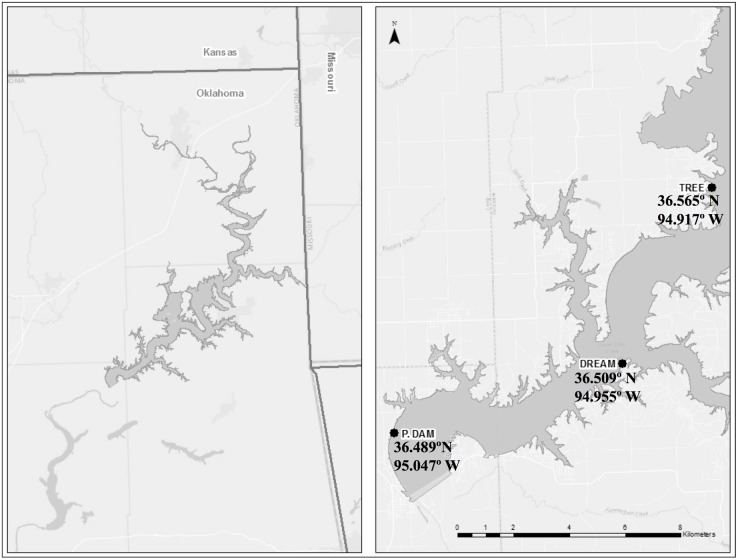
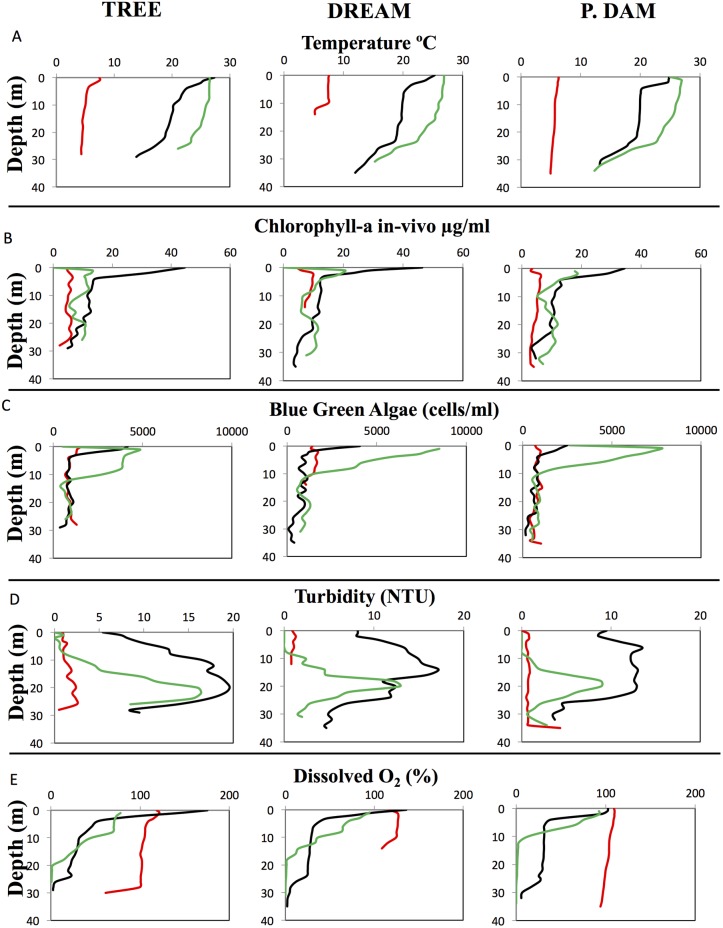
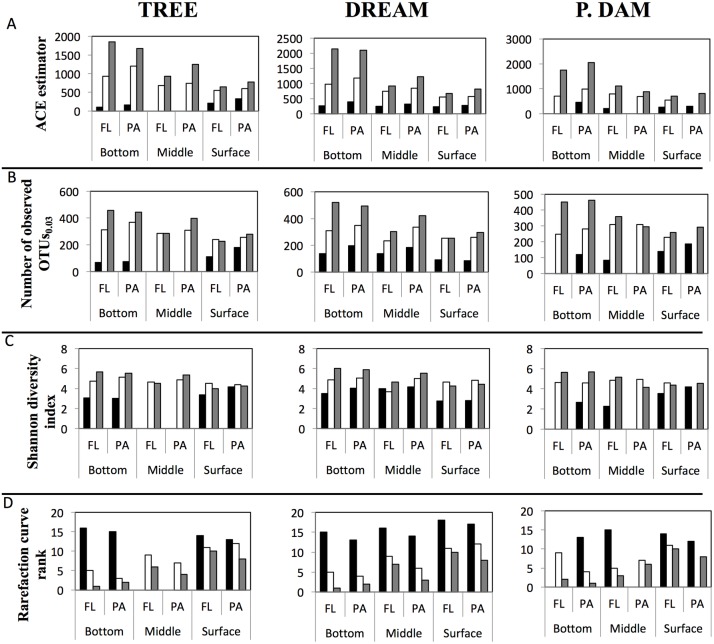
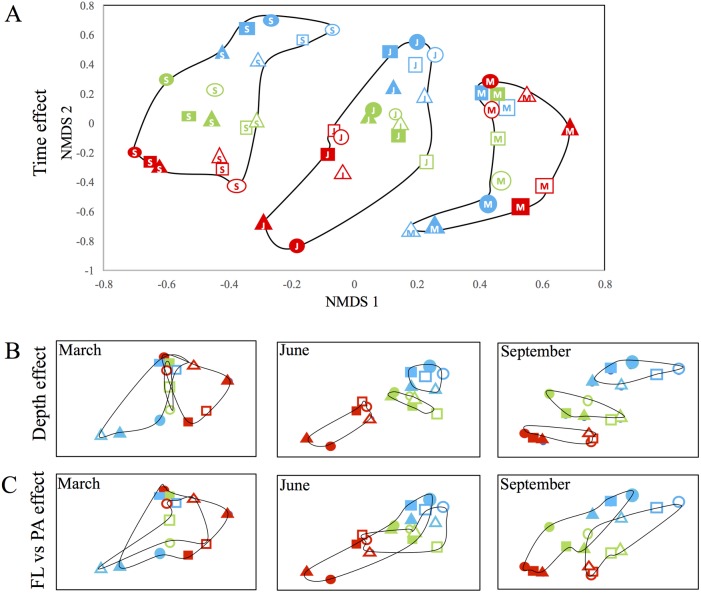
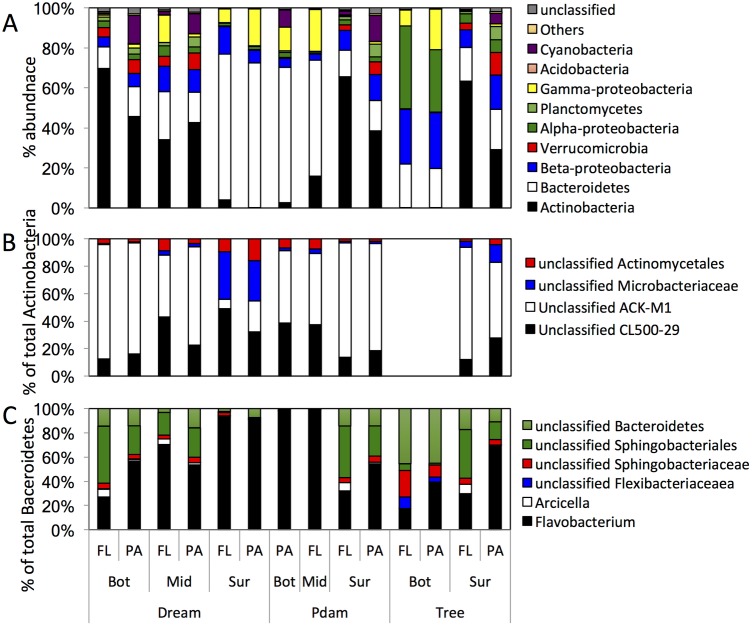
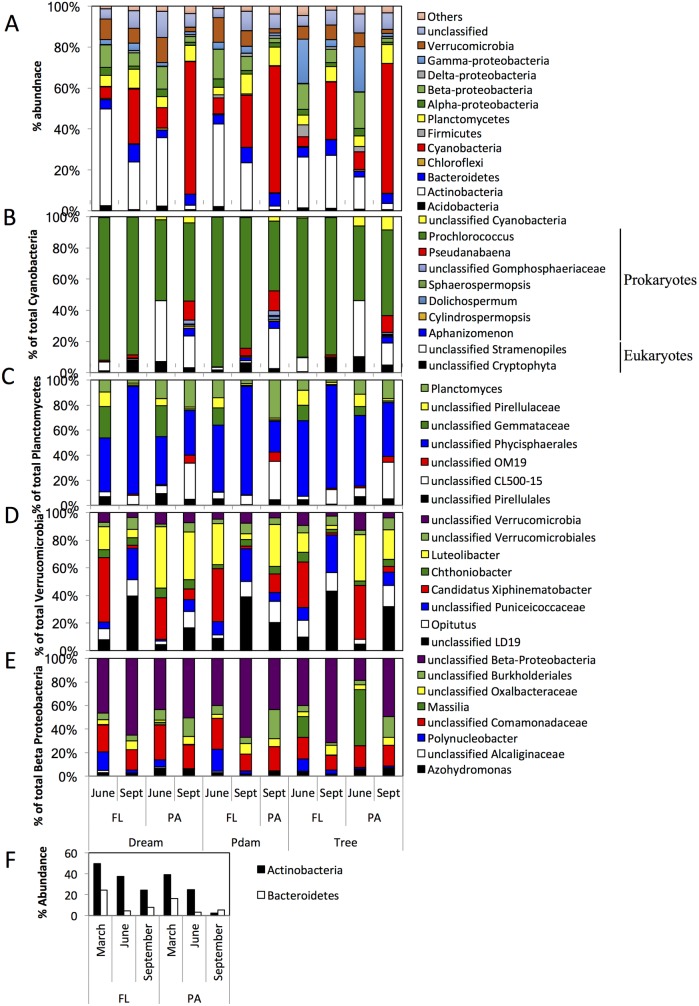
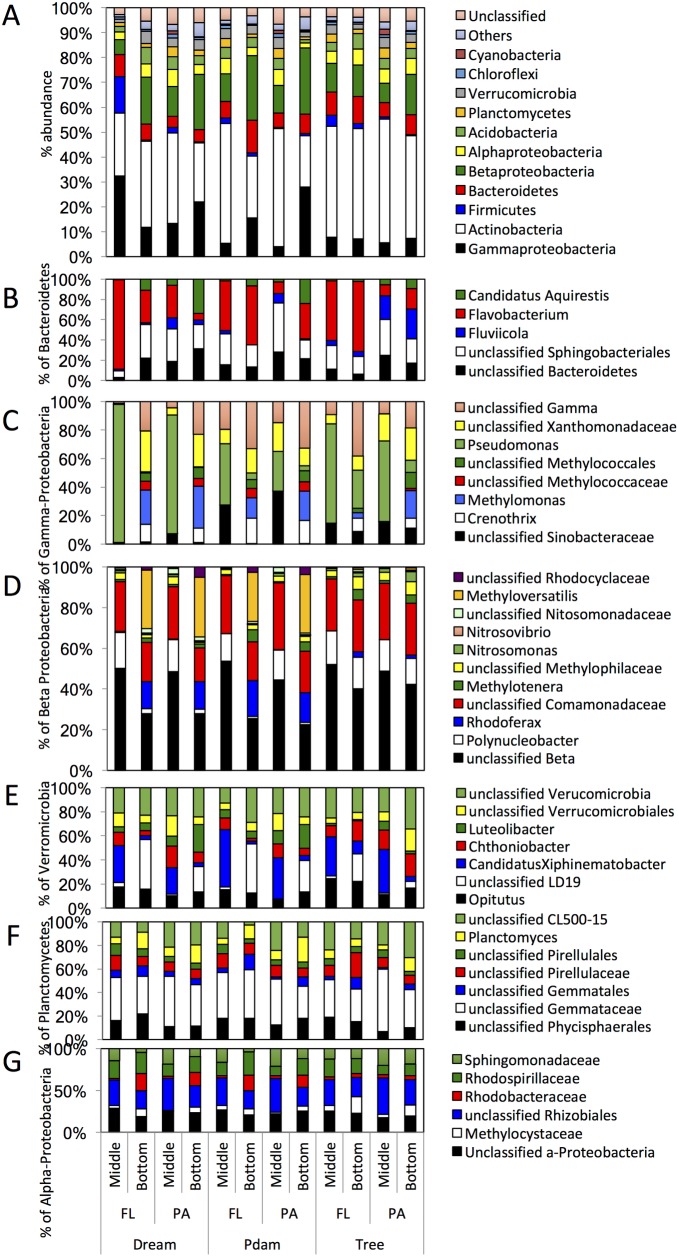
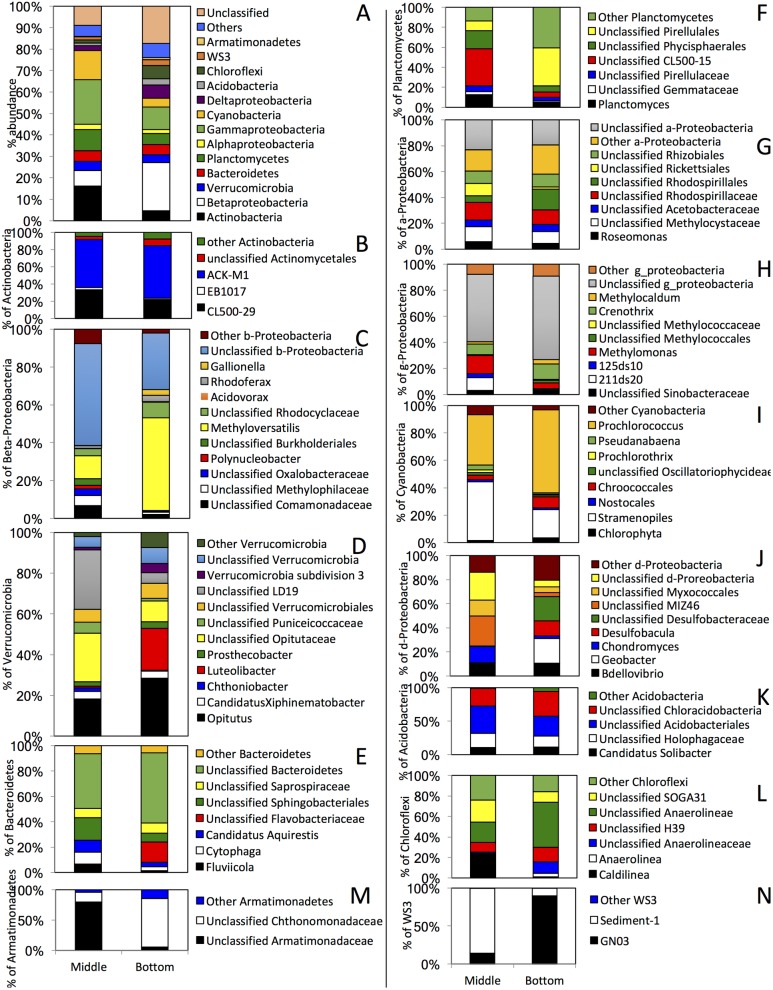
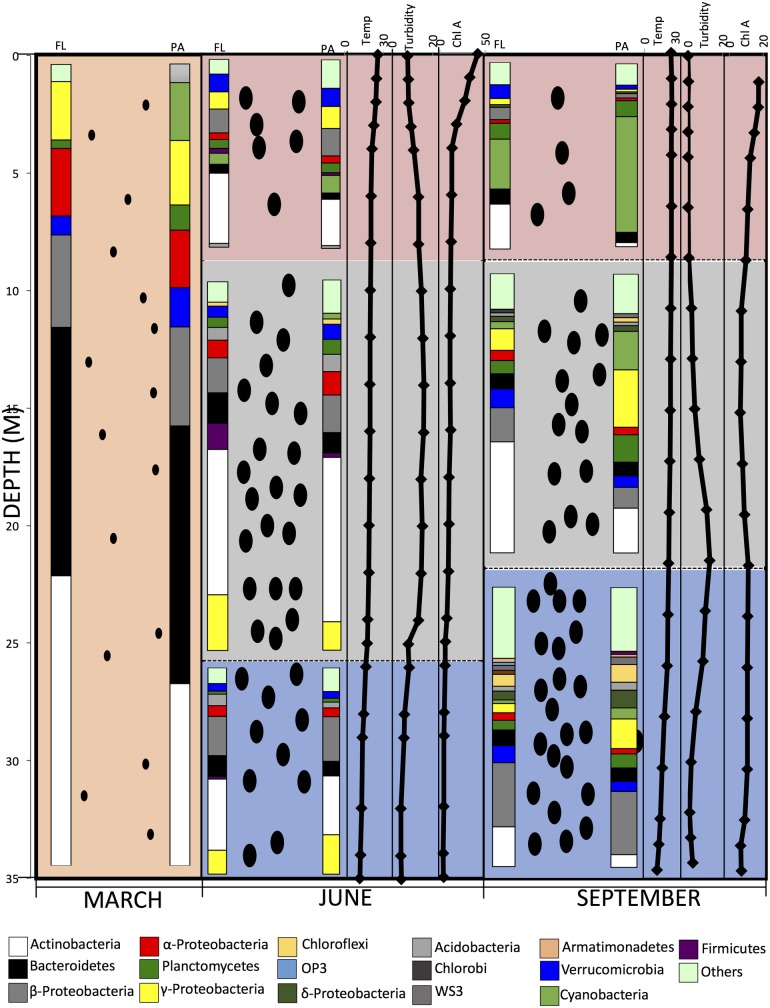
Many freshwater lakes undergo seasonal stratification, where the formation of phototrophic blooms in the epilimnion and subsequent sedimentation induces hypoxia/anoxia in the thermocline and hypolimnion. This autochthonously produced biomass represents a major seasonal organic input that impacts the entire ecosystem. While the limnological aspects of this process are fairly well documented, relatively little is known regarding the microbial community response to such events, especially in the deeper anoxic layers of the water column. Here, we conducted a spatiotemporal survey of the particle-associated and free-living microbial communities in a warm monomictic freshwater reservoir (Grand Lake O' the Cherokees) in northeastern Oklahoma, USA. Pre-stratification samples (March) harbored a homogeneous community throughout the oxygenated water column dominated by typical oligotrophic aquatic lineages (acl clade within Actinobacteria, and Flavobacterium within the Bacteroidetes). The onset of phototrophic blooming in June induced the progression of this baseline community into two distinct trajectories. Within the oxic epilimnion, samples were characterized by the propagation of phototrophic (Prochlorococcus), and heterotrophic (Planctomycetes, Verrucomicrobia, and Beta-Proteobacteria) lineages. Within the oxygen-deficient thermocline and hypolimnion, the sedimentation of surface biomass induced the development of a highly diverse community, with the enrichment of Chloroflexi, "Latescibacteria", Armatimonadetes, and Delta-Proteobacteria in the particle-associated fraction, and Gemmatimonadetes and "Omnitrophica" in the free-living fraction. Our work documents the development of multiple spatially and temporally distinct niches during lake stratification, and supports the enrichment of multiple yet-uncultured and poorly characterized lineages in the lake's deeper oxygen-deficient layers, an ecologically relevant microbial niche that is often overlooked in lakes diversity surveys.
Conflict of interest statement
Figures
Similar articles
-
Intra- and inter-lake variability of free-living and particle-associated Actinobacteria communities.Environ Microbiol. 2007 Nov;9(11):2728-41. doi: 10.1111/j.1462-2920.2007.01385.x. Environ Microbiol. 2007. PMID: 17922757
-
Seasonal dominance of CL500-11 bacterioplankton (phylum Chloroflexi) in the oxygenated hypolimnion of Lake Biwa, Japan.FEMS Microbiol Ecol. 2013 Jan;83(1):82-92. doi: 10.1111/j.1574-6941.2012.01451.x. Epub 2012 Aug 20. FEMS Microbiol Ecol. 2013. PMID: 22809435
-
Spatiotemporal variation of planktonic and sediment bacterial assemblages in two plateau freshwater lakes at different trophic status.Appl Microbiol Biotechnol. 2016 May;100(9):4161-75. doi: 10.1007/s00253-015-7253-2. Epub 2015 Dec 28. Appl Microbiol Biotechnol. 2016. PMID: 26711281
-
Cyanobacteria blooms: effects on aquatic ecosystems.Adv Exp Med Biol. 2008;619:733-47. doi: 10.1007/978-0-387-75865-7_33. Adv Exp Med Biol. 2008. PMID: 18461790 Review.
-
Quantified hypoxia and anoxia in lakes and reservoirs.ScientificWorldJournal. 2004 Feb 26;4:42-54. doi: 10.1100/tsw.2004.5. ScientificWorldJournal. 2004. PMID: 15004318 Free PMC article. Review.
Cited by
-
Niche selection in bacterioplankton: A study of taxonomic composition and single-cell characteristics in an acidic reservoir.Environ Microbiol Rep. 2024 Aug;16(4):e13255. doi: 10.1111/1758-2229.13255. Environ Microbiol Rep. 2024. PMID: 38940640 Free PMC article.
-
Diversity dynamics of aerobic anoxygenic phototrophic bacteria in a freshwater lake.Environ Microbiol Rep. 2023 Feb;15(1):60-71. doi: 10.1111/1758-2229.13131. Epub 2022 Dec 12. Environ Microbiol Rep. 2023. PMID: 36507772 Free PMC article.
-
Parallel and non-parallel changes of the gut microbiota during trophic diversification in repeated young adaptive radiations of sympatric cichlid fish.Microbiome. 2020 Oct 29;8(1):149. doi: 10.1186/s40168-020-00897-8. Microbiome. 2020. PMID: 33121541 Free PMC article.
-
A quantitative sequencing method using synthetic internal standards including functional and phylogenetic marker genes.Environ Microbiol Rep. 2023 Dec;15(6):497-511. doi: 10.1111/1758-2229.13189. Epub 2023 Jul 18. Environ Microbiol Rep. 2023. PMID: 37465846 Free PMC article.
-
Multi-environment ecogenomics analysis of the cosmopolitan phylum Gemmatimonadota.Microbiol Spectr. 2023 Sep 21;11(5):e0111223. doi: 10.1128/spectrum.01112-23. Online ahead of print. Microbiol Spectr. 2023. PMID: 37732776 Free PMC article.
References
-
- Carpenter S. R., Stanley E. H., and Vander Zanden M. J.. 2011. State of the world's freshwater ecosystems: physical, chemical, and biological changes. Ann. Rev. Environ. Res. 36: 75–99.
-
- Bahr M., Hobbie J. E., and Sogin M. L.. 1996. Bacterial diversity in an arctic lake: a freshwater SAR11 cluster. Aquat. Microb. Ecol. 11: 271–277.
-
- Chauhan A., and Ogram A.. 2006. Fatty acid-oxidizing consortia along a nutrient gradient in the Florida Everglades. Appl. Environ. Microbiol. 72: 2400–2406. doi: 10.1128/AEM.72.4.2400-2406.2006 - DOI - PMC - PubMed
-
- Hahn M. W. 2003. Isolation of strains belonging to the cosmopolitan Polynucleobacter necessarius cluster from freshwater habitats located in three climatic zones. Appl. Environ. Microbiol. 69: 5248–5254. doi: 10.1128/AEM.69.9.5248-5254.2003 - DOI - PMC - PubMed
-
- Hahn M. W., Stadler P., Wu Q. L., and Pockl M.. 2004. The filtration-acclimatization method for isolation of an important fraction of the not readily cultivable bacteria. J. Microbiol. Meth. 57: 379–390. - PubMed
MeSH terms
LinkOut - more resources
Full Text Sources
Other Literature Sources
