

Metabolomics analysis: Finding out metabolic building blocks
- PMID: 28493998
- PMCID: PMC5426688
- DOI: 10.1371/journal.pone.0177031
Metabolomics analysis: Finding out metabolic building blocks
Erratum in
-
Correction: Metabolomics analysis: Finding out metabolic building blocks.PLoS One. 2017 Oct 12;12(10):e0186626. doi: 10.1371/journal.pone.0186626. eCollection 2017. PLoS One. 2017. PMID: 29023538 Free PMC article.
Abstract
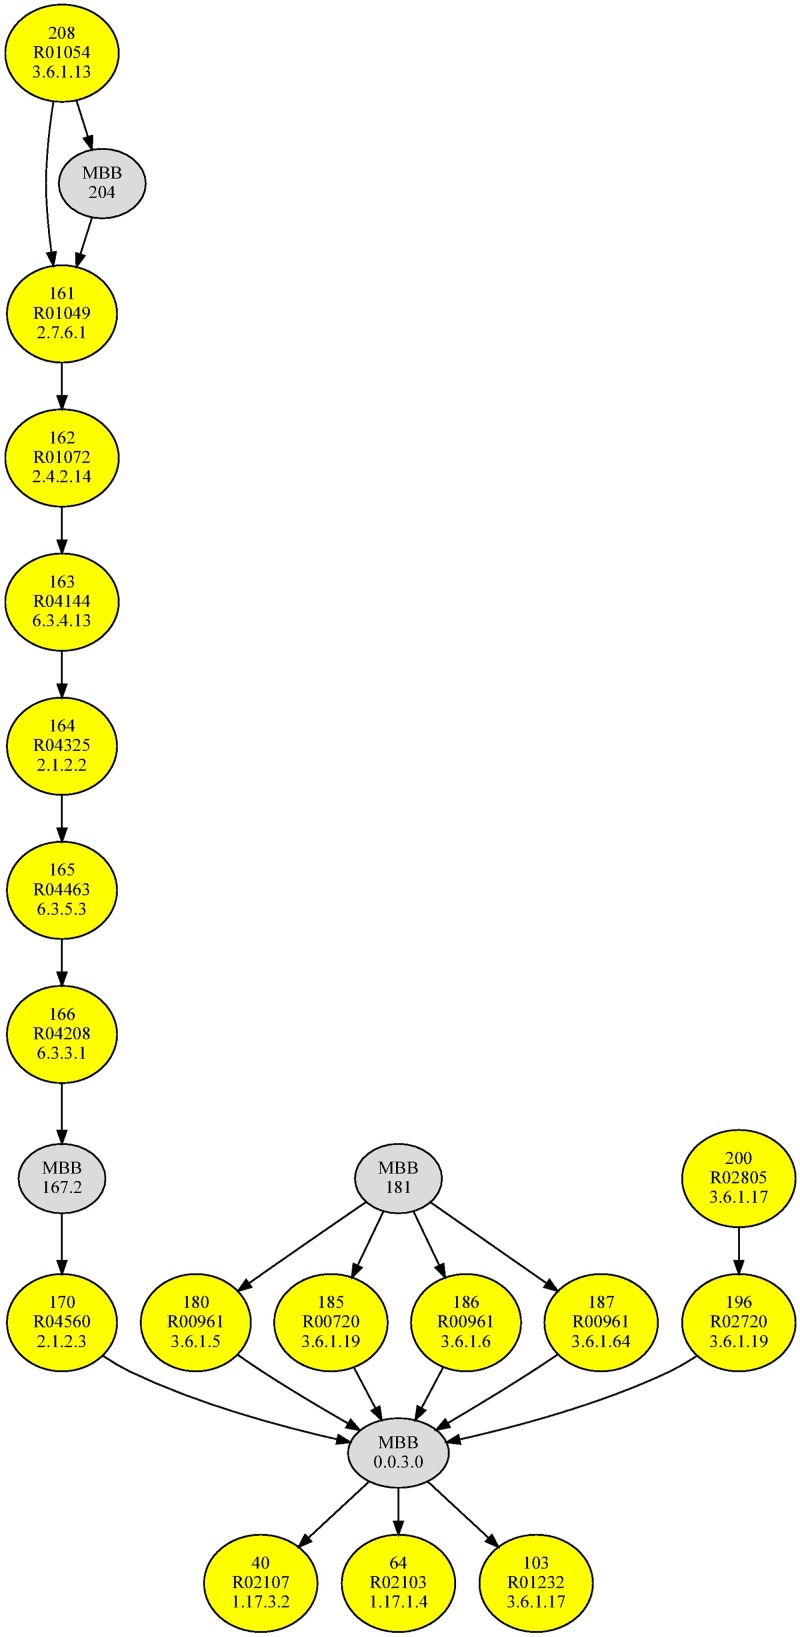
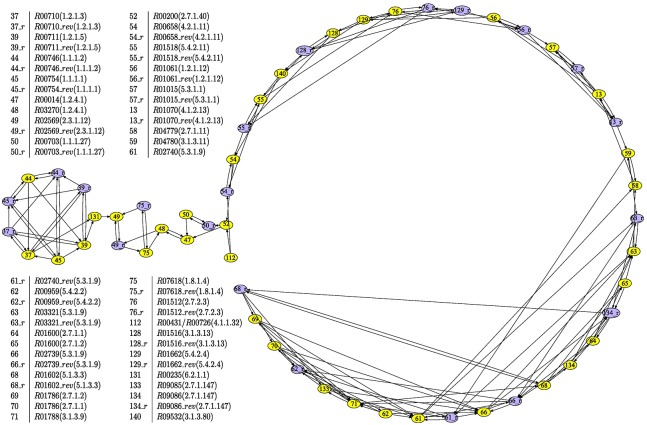
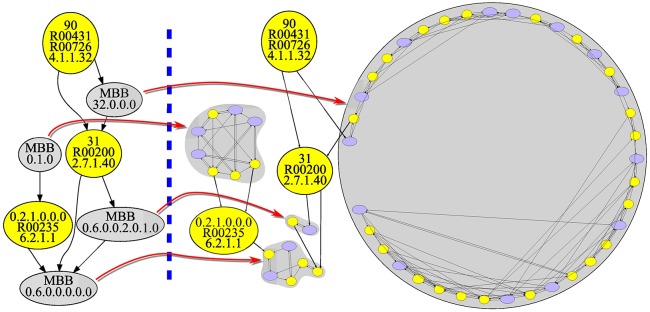
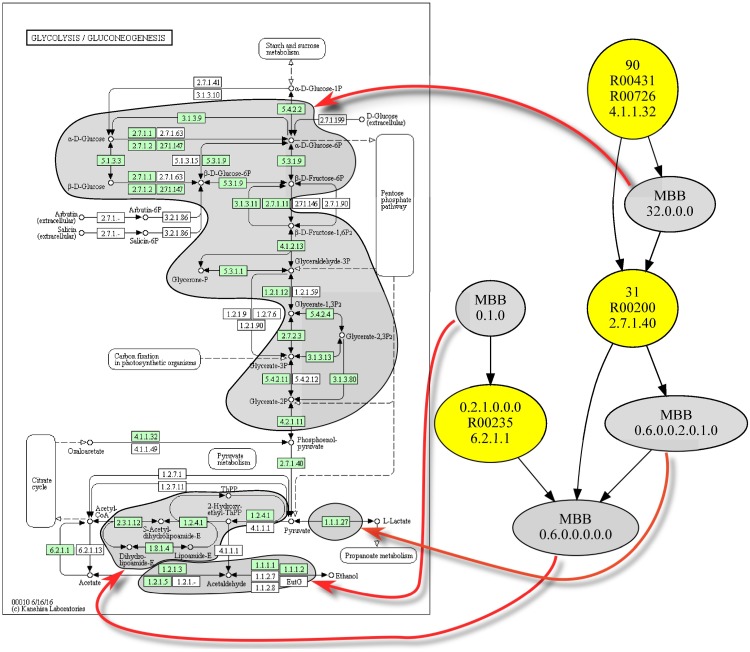
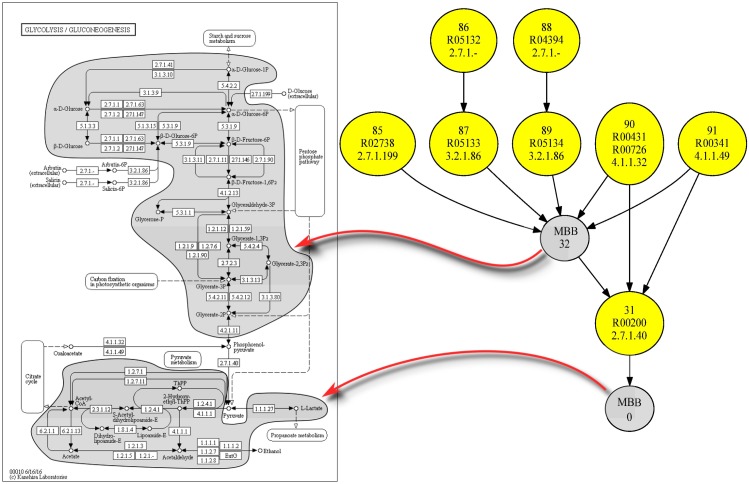
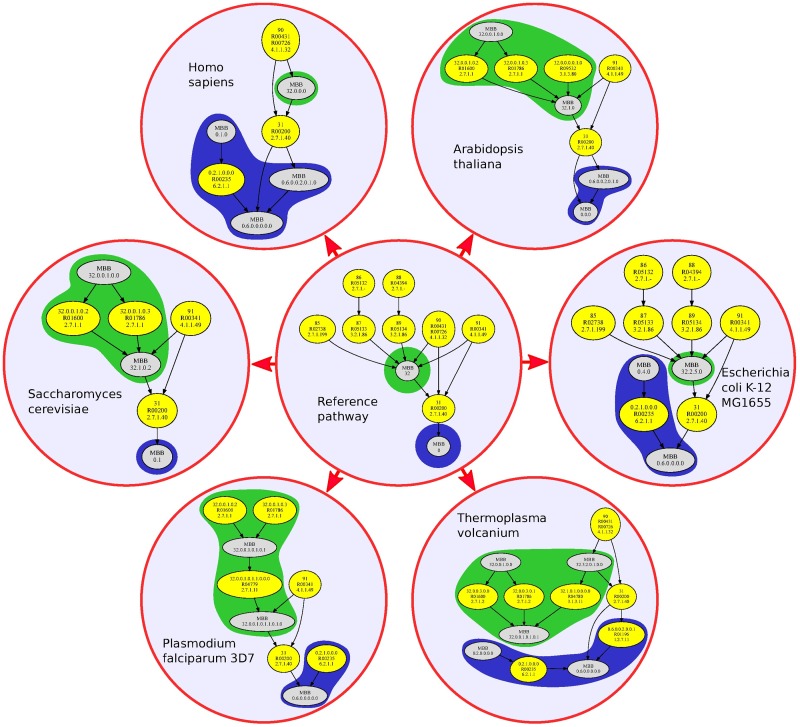
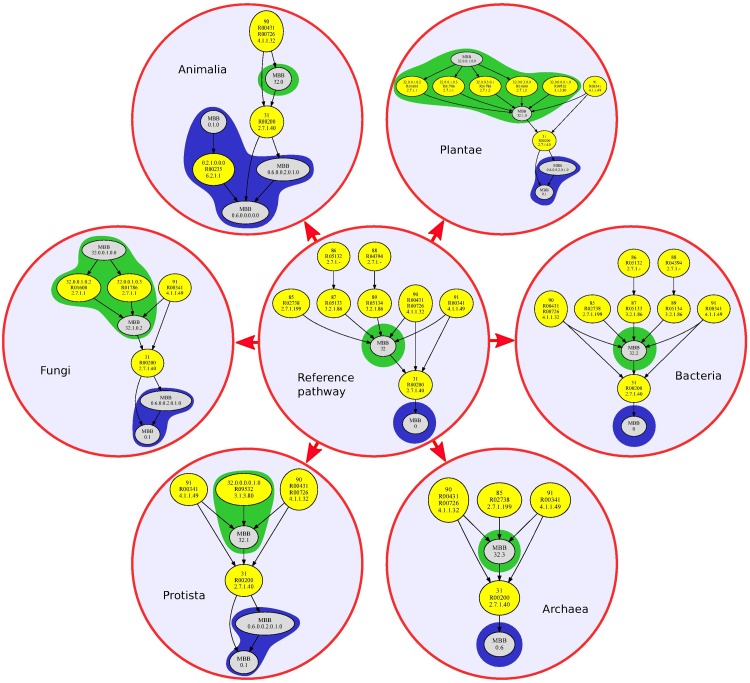
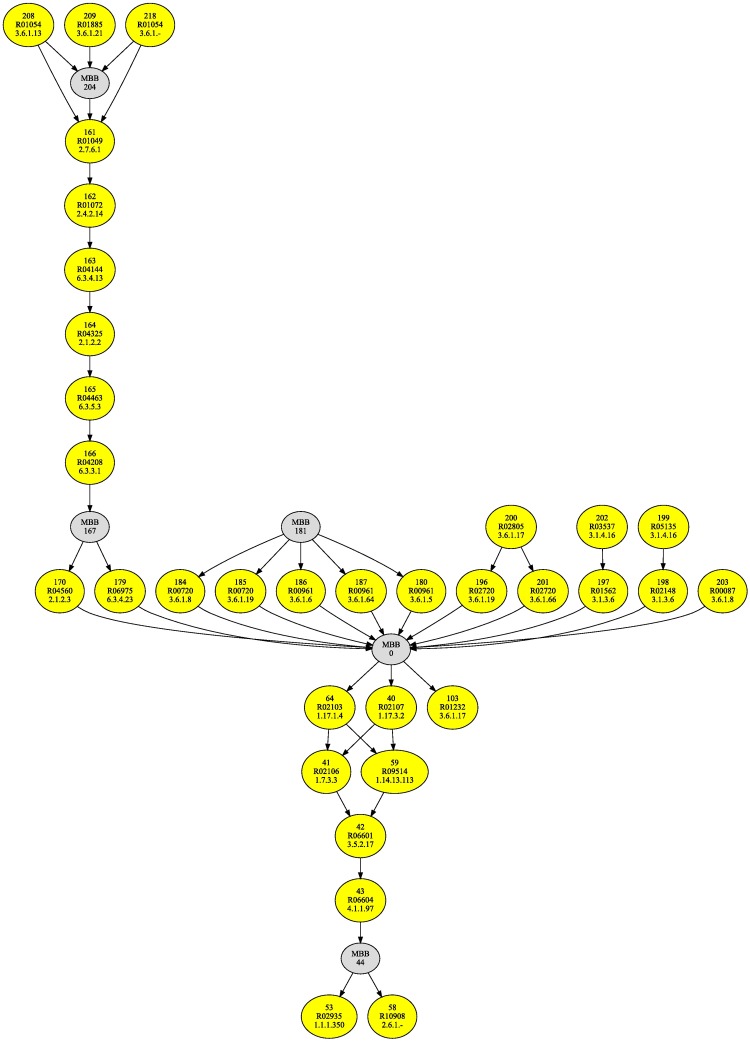
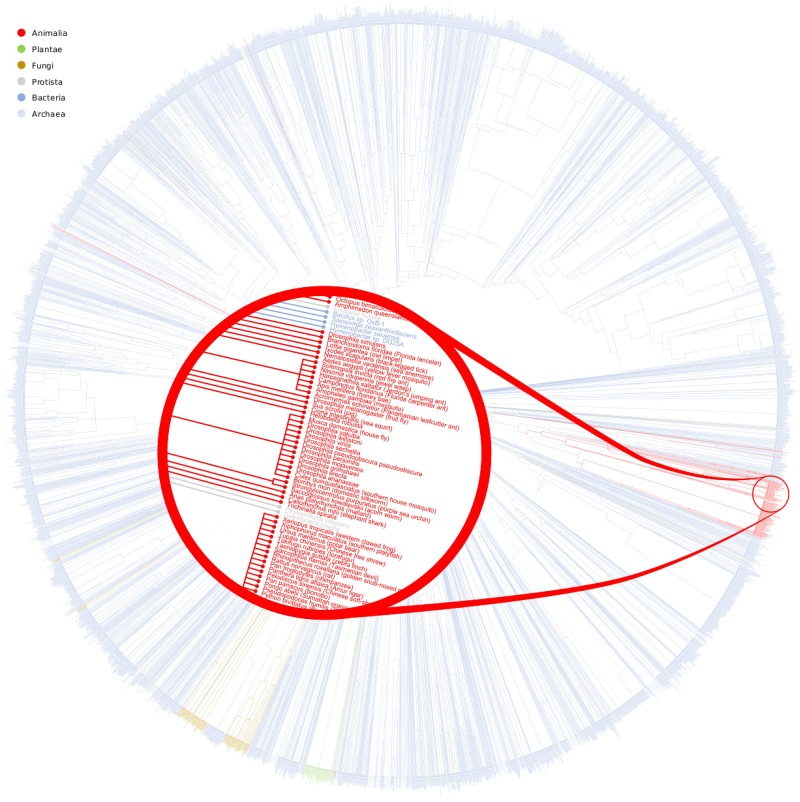
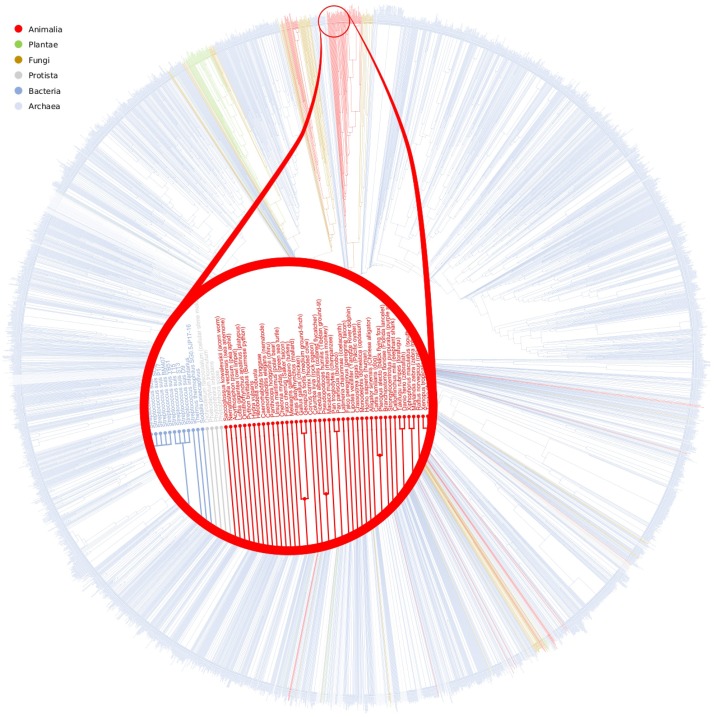
In this paper we propose a new methodology for the analysis of metabolic networks. We use the notion of strongly connected components of a graph, called in this context metabolic building blocks. Every strongly connected component is contracted to a single node in such a way that the resulting graph is a directed acyclic graph, called a metabolic DAG, with a considerably reduced number of nodes. The property of being a directed acyclic graph brings out a background graph topology that reveals the connectivity of the metabolic network, as well as bridges, isolated nodes and cut nodes. Altogether, it becomes a key information for the discovery of functional metabolic relations. Our methodology has been applied to the glycolysis and the purine metabolic pathways for all organisms in the KEGG database, although it is general enough to work on any database. As expected, using the metabolic DAGs formalism, a considerable reduction on the size of the metabolic networks has been obtained, specially in the case of the purine pathway due to its relative larger size. As a proof of concept, from the information captured by a metabolic DAG and its corresponding metabolic building blocks, we obtain the core of the glycolysis pathway and the core of the purine metabolism pathway and detect some essential metabolic building blocks that reveal the key reactions in both pathways. Finally, the application of our methodology to the glycolysis pathway and the purine metabolism pathway reproduce the tree of life for the whole set of the organisms represented in the KEGG database which supports the utility of this research.
Conflict of interest statement
Figures
Similar articles
-
MetNet: A two-level approach to reconstructing and comparing metabolic networks.PLoS One. 2021 Feb 12;16(2):e0246962. doi: 10.1371/journal.pone.0246962. eCollection 2021. PLoS One. 2021. PMID: 33577575 Free PMC article.
-
The Metabolic Building Blocks of a Minimal Cell.Biology (Basel). 2020 Dec 24;10(1):5. doi: 10.3390/biology10010005. Biology (Basel). 2020. PMID: 33374107 Free PMC article.
-
A graph-based approach to analyze flux-balanced pathways in metabolic networks.Biosystems. 2018 Mar;165:40-51. doi: 10.1016/j.biosystems.2017.12.001. Epub 2018 Jan 12. Biosystems. 2018. PMID: 29337084
-
Analyzing methods for path mining with applications in metabolomics.Gene. 2014 Jan 25;534(2):125-38. doi: 10.1016/j.gene.2013.10.056. Epub 2013 Nov 12. Gene. 2014. PMID: 24230973 Review.
-
From metabolic reactions to networks and pathways.Methods Mol Biol. 2012;804:93-106. doi: 10.1007/978-1-61779-361-5_6. Methods Mol Biol. 2012. PMID: 22144150 Review.
Cited by
-
MetNet: A two-level approach to reconstructing and comparing metabolic networks.PLoS One. 2021 Feb 12;16(2):e0246962. doi: 10.1371/journal.pone.0246962. eCollection 2021. PLoS One. 2021. PMID: 33577575 Free PMC article.
-
The Metabolic Building Blocks of a Minimal Cell.Biology (Basel). 2020 Dec 24;10(1):5. doi: 10.3390/biology10010005. Biology (Basel). 2020. PMID: 33374107 Free PMC article.
-
Correction: Metabolomics analysis: Finding out metabolic building blocks.PLoS One. 2017 Oct 12;12(10):e0186626. doi: 10.1371/journal.pone.0186626. eCollection 2017. PLoS One. 2017. PMID: 29023538 Free PMC article.
-
An update on the Symbiotic Genomes Database (SymGenDB): a collection of metadata, genomic, genetic and protein sequences, orthologs and metabolic networks of symbiotic organisms.Database (Oxford). 2020 Jan 1;2020:baz160. doi: 10.1093/database/baz160. Database (Oxford). 2020. PMID: 32055857 Free PMC article.
-
Metadag: a web tool to generate and analyse metabolic networks.BMC Bioinformatics. 2025 Jan 28;26(1):31. doi: 10.1186/s12859-025-06048-w. BMC Bioinformatics. 2025. PMID: 39875845 Free PMC article.
References
-
- Ebenhöh O, Handorf T, Heinrich R. Structural analysis of expanding networks. Genome Information, 15:35–45, 2004. - PubMed
MeSH terms
Substances
LinkOut - more resources
Full Text Sources
Other Literature Sources
Research Materials
