. 2017 Jul 3;14(7):905-913.
doi: 10.1080/15476286.2017.1325067. Epub 2017 May 11.

MicroRNA-338 modulates cortical neuronal placement and polarity

Affiliations

MicroRNA-338 modulates cortical neuronal placement and polarity

Aron Kos et al. RNA Biol. .

Abstract

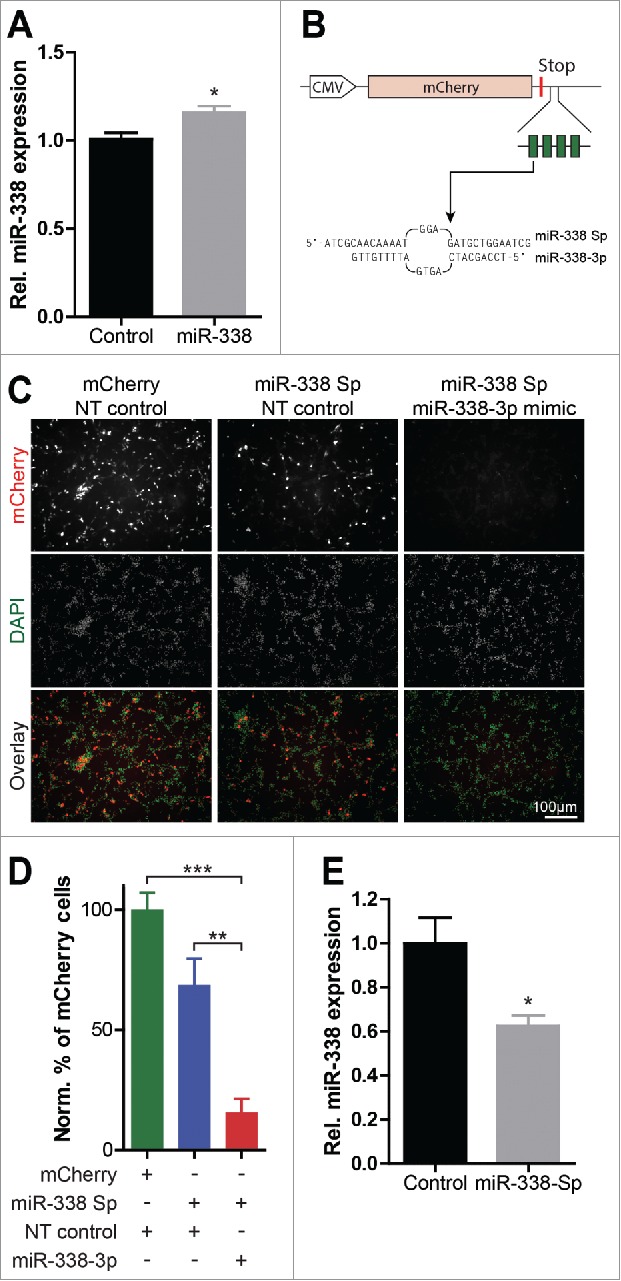
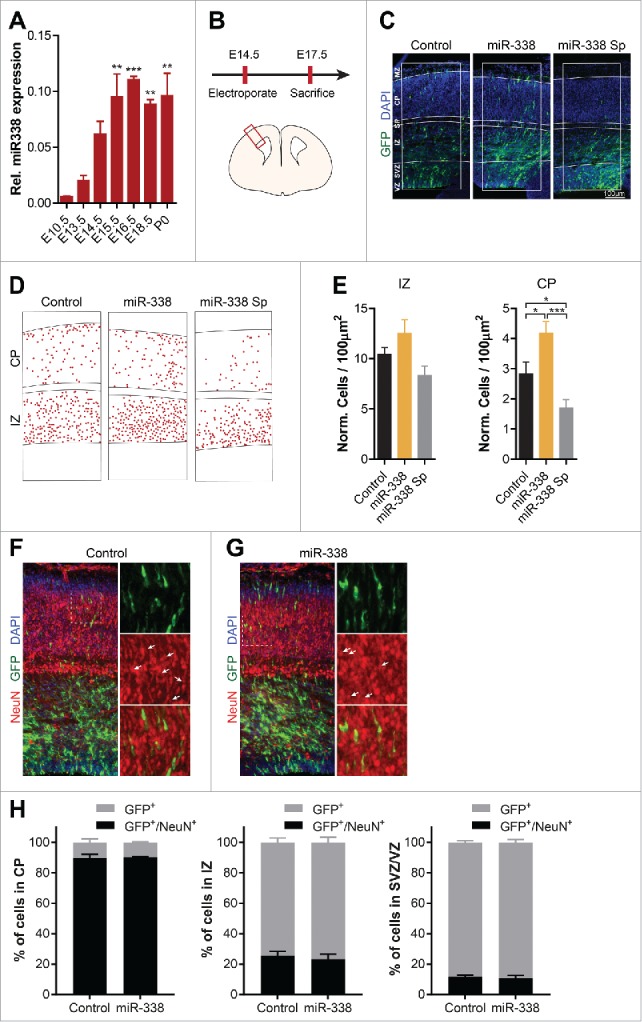
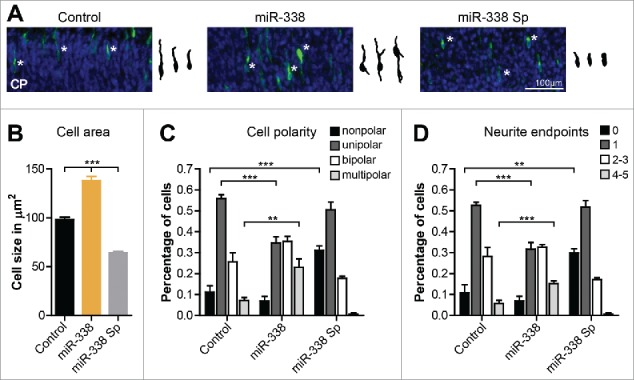
The precise spatial and temporal regulation of gene expression orchestrates the many intricate processes during brain development. In the present study we examined the role of the brain-enriched microRNA-338 (miR-338) during mouse cortical development. Reduction of miR-338 levels in the developing mouse cortex, using a sequence-specific miR-sponge, resulted in a loss of neuronal polarity in the cortical plate and significantly reduced the number of neurons within this cortical layer. Conversely, miR-338 overexpression in developing mouse cortex increased the number of neurons, which exhibited a multipolar morphology. All together, our results raise the possibility for a direct role for this non-coding RNA, which was recently associated with schizophrenia, in the regulation of cortical neuronal polarity and layer placement.

Keywords: Epigenetic gene regulation; in utero electroporation; neurodevelopment; neuronal migration; schizophrenia.


Figures

Figure 1.
Figure 1.
Characterization of the miR-338 overexpression vector and the miR-338-inhibiting sponge construct. (A) Analysis of miR-338 overexpression on mature miR-338 levels following IUE. Bars represent mean relative values to control with error bars ± s.e.m. Two-tailed unpaired student's t test, n = 6–7 samples; *P < 0.05. (B) The cytomegalovirus (CMV) promoter-driven miR-338-inhibiting sponge design. The 4 partially-complementary miR-338–3p binding sites are depicted as green blocks within the 3′ UTR of the mCherry gene. The sequence of both the miR-338 sponge (Sp) and mature miR-338–3p is shown, containing a central bulge to increase the efficiency of miR inhibition and a 4 nucleotide arbitrary linker sequence between each binding site. (C) Representative images of B35 neuroblastoma cells transfected with a control empty vector or the miR-338-sponge, co-transfected with a NT control or a miR-338 mimic to show the sensing capacity of this sponge for miR-338–3p activity. (D) Quantification of the percentage of cells displaying a fluorescent signal normalized to the total number of cells relative to the mCherry transfected control. Figure shows an expected decrease in the number of bright fluorescent cells under increasing levels of miR-338. Data represents mean percentage with error bars ± s.e.m. One-way ANOVA with Bonferroni multiple comparison test, average cell numbers collected from n = 3 experiments; ***P < 0.0001. (E) qPCR analysis of DIV 4 primary cortical neurons electroporated at DIV 1 with the miR-338 sponge or a GFP control vector. Bars represent mean relative values to control with error bars ± s.e.m. Two-tailed unpaired student's t test, n = 5 samples from independent experiments; *P < 0.05.
Figure 2.
Figure 2.
miR-338 affects neuronal migration within the developing cortex. (A) Expression level of mature miR-338 in the whole mouse brain from embryonic day 10.5 (E10.5) up to postnatal day 0 (P0). Data represents the relative fold change to E10.5 ± s.e.m. One-way ANOVA with Bonferroni multiple comparison test, n = 3 samples collected from independently isolated brains; ** P< 0.01, ***P < 0.001. (B) Outline of the performed IUE experiment and a graphic illustration of a cortical slice with the red box denoting the analyzed cortical area. (C) Representative micrographs of control GFP, miR-338 overexpression and miR-338 sponge in electroporated cortical slices with 300 µm wide masks highlighting the cortical layers ventricular zone (VZ); subventricular zone (SVZ); intermediate zone (IZ); subplate (SP); cortical plate (CP); marginal zone (MZ). The IUE targeted cells are depicted in green and DAPI nuclear staining is shown in blue. (D) Representative analysis of miR-338 overexpression and inhibition compared with the control with each dot defining a single neuron. (E) Quantification of IUE neurons within 100 µm2 IZ and CP corrected for the total number of cells. Bars represent mean relative numbers to control with error bars ± s.e.m. Two-tailed unpaired student's t test, n = 4–5 brains per condition from independent experiments; *P < 0.05 and ***P < 0.001. (F-G) Representative images of cortical slices electroporated with (F) a control GFP vector or (G) the miR-338 overexpresssion vector with DAPI in blue, GFP in red and NeuN depicted in red. The dotted white box illustrates the zoomed in areas on the right. The white arrows highlight electroporated cells which are positive for NeuN. (H) Quantification of the percentage of GFP-positive control or miR-338 electroporated cells within the CP, IZ and VZ/SVZ, which are positive for NeuN. The error bars represent ± s.e.m, n = 3 brains per condition from independent experiments.
Figure 3.
Figure 3.
Modulation of miR-338 levels leads to alteration of neuronal morphologies within the cortical plate. (A) Representative images of neurons electroporated at E14.5 with either the control, miR-338 overexpression or the miR-338-sponge vector and analyzed at E17.5. The manipulated neurons are shown in green and the DAPI nuclear staining is shown in blue. Corresponding traced neurons within the CP are highlighted with a white asterisk within each image. (B) The total cellular area in µm2. Mean values with error bars ± s.e.m. One-way ANOVA with Bonferroni multiple comparison test; ***P < 0.001. (C) Neuronal polarity classified in the percentage of nonpolar, unipolar, bipolar and multipolar cells. (D) The percentage of neurons having no, 1, 2–3 or more number of neurite endpoints. Graphs represent mean values with error bars ± s.e.m. One-way ANOVA with Bonferroni multiple comparison test, average of 150 cells measured collected from n = 3 brains per condition from independent experiments; *P < 0.05, **P < 0.01 and ***P < 0.001.

References

    1. Franco SJ, Muller U. Shaping our minds: stem and progenitor cell diversity in the mammalian neocortex. Neuron 2013; 77:19-34; PMID:23312513; https://doi.org/10.1016/j.neuron.2012.12.022 - DOI - PMC - PubMed
    1. Lui JH, Hansen DV, Kriegstein AR. Development and evolution of the human neocortex. Cell 2011; 146:18-36; PMID:21729779; https://doi.org/10.1016/j.cell.2011.06.030 10.1016/j.cell.2011.07.005 - DOI - DOI - PMC - PubMed
    1. Schubert D, Martens GJ, Kolk SM. Molecular underpinnings of prefrontal cortex development in rodents provide insights into the etiology of neurodevelopmental disorders. Mol Psychiatry 2015; 20:795-809; PMID:25450230; https://doi.org/10.1038/mp.2014.147 - DOI - PMC - PubMed
    1. van Bokhoven H. Genetic and epigenetic networks in intellectual disabilities. Annu Rev Genet 2011; 45:81-104; PMID:21910631; https://doi.org/10.1146/annurev-genet-110410-132512 - DOI - PubMed
    1. Stark KL, Xu B, Bagchi A, Lai WS, Liu H, Hsu R, Wan X, Pavlidis P, Mills AA, Karayiorgou M, et al.. Altered brain microRNA biogenesis contributes to phenotypic deficits in a 22q11-deletion mouse model. Nat Genet 2008; 40:751-60; PMID:18469815; https://doi.org/10.1038/ng.138 - DOI - PubMed

Publication types

LinkOut - more resources