. 2017 May 9;19(6):1141-1150.
doi: 10.1016/j.celrep.2017.04.044.

Distinct Translaminar Glutamatergic Circuits to GABAergic Interneurons in the Neonatal Auditory Cortex

Affiliations

Distinct Translaminar Glutamatergic Circuits to GABAergic Interneurons in the Neonatal Auditory Cortex

Rongkang Deng et al. Cell Rep. .

Abstract

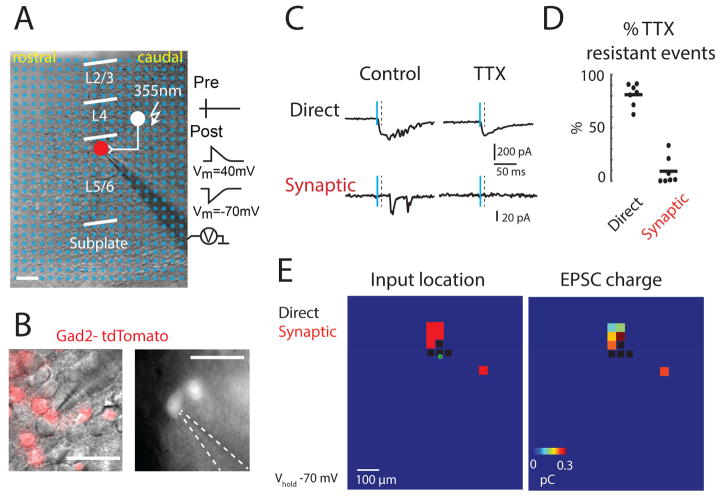
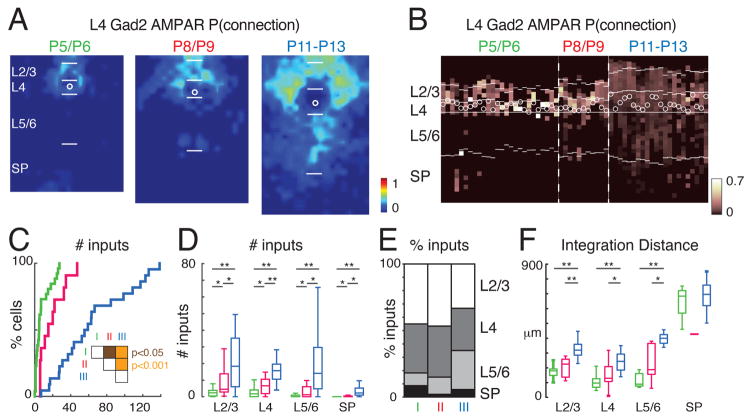
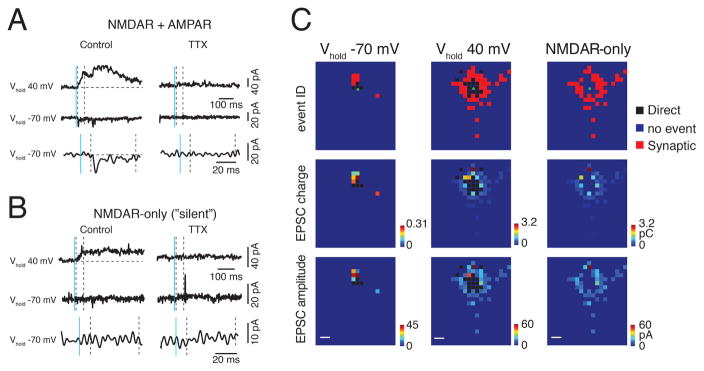
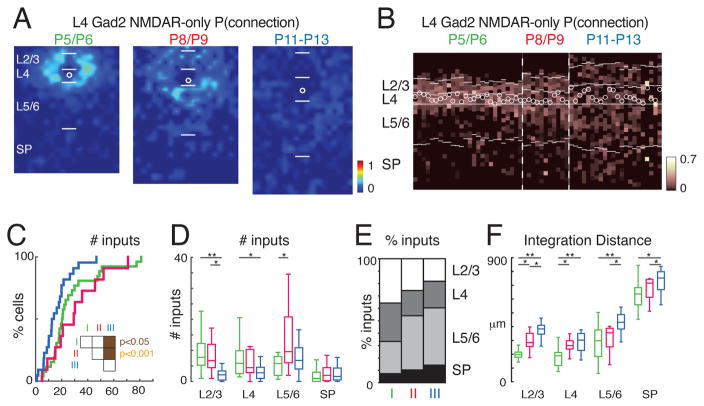
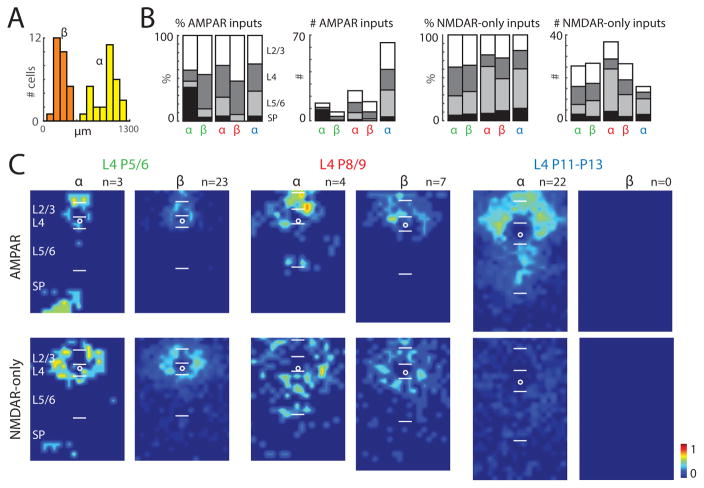
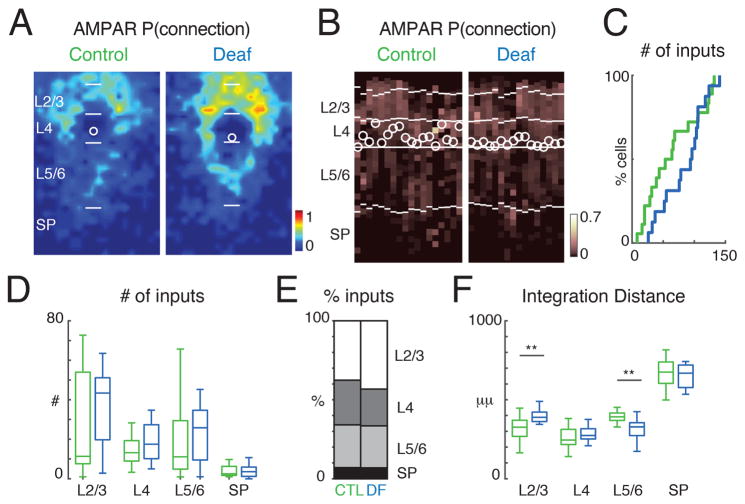
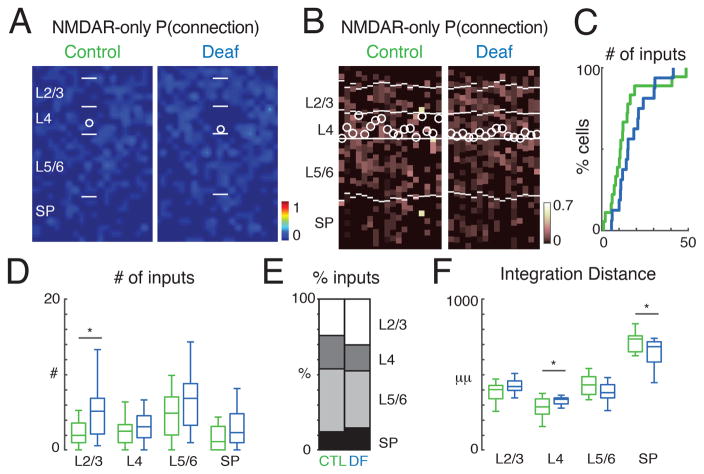
GABAergic activity is important in neocortical development and plasticity. Because the maturation of GABAergic interneurons is regulated by neural activity, the source of excitatory inputs to GABAergic interneurons plays a key role in development. We show, by laser-scanning photostimulation, that layer 4 and layer 5 GABAergic interneurons in the auditory cortex in neonatal mice (<P7) receive extensive translaminar glutamatergic input via NMDAR-only synapses. Extensive translaminar AMPAR-mediated input developed during the second postnatal week, whereas NMDAR-only presynaptic connections decreased. GABAergic interneurons showed two spatial patterns of translaminar connection: inputs originating predominantly from supragranular or from supragranular and infragranular layers, including the subplate, which relays early thalamocortical activity. Sensory deprivation altered the development of translaminar inputs. Thus, distinct translaminar circuits to GABAergic interneurons exist throughout development, and the maturation of excitatory synapses is input-specific. Glutamatergic signaling from subplate and intracortical sources likely plays a role in the maturation of GABAergic interneurons.

Keywords: GABA; NMDA; auditory cortex; development; interneuron; silent synapse; subplate; translaminar.


Figures

Figure 1
Figure 1. Laser-Scanning photostimulation (LSPS) of Gad2 interneurons
A: An example LSPS experiment in an auditory thalamocortical slice. LSPS stimulation locations (blue dots) are superimposed on DIC image of the slice (scale bar 100 μm). Red circle indicates the soma location of the recorded interneuron. A 355-nm laser is targeted to the stimulus locations. Targeted presynaptic neuron (filled white circle) fires an action potential (‘Pre’ trace on the right). If the presynaptic neuron synapses on the recorded interneuron a PSC is observed (‘Post’ traces on the right), with the recorded neuron held at −70 mV or +40 mV for AMPAR-mediated EPSC and/or NMDAR-mediated EPSC, respectively. B: Images of recorded Gad2 interneuron expressing red fluorescent protein (RFP); left frame shows RFP fluorescence superimposed on DIC image; right frame shows fluorescence from a different neuron by itself. Scale bar = 50 μm. C: Mapping glutamatergic inputs to GABAergic interneurons by LSPS glutamate uncaging. Traces show example responses to photostimulation at −70 mV holding potential. Vertical solid blue line indicates uncaging pulse; vertical dashed line indicates time window to discriminate direct responses. Direct activations were resistant to TTX while synaptic responses were blocked by TTX. D: Percentage of TTX-resistant events in the direct time window (< 10 ms latency) and synaptic time window (> 10 ms and <50 ms). 81% of short-latency (< 10 ms) responses were TTX-resistant while 8.5% of synaptic responses (> 10 ms and < 50 ms) were TTX-resistant (n = 7 cells each). E: Maps of an exemplar cell from P5/6 group showing stimulus locations that evoked responses and the charge at each stimulus location when Vhold is −70 mV. Green circle indicates soma position. Left: Map of synaptic (red) or direct (black) responses. Note that direct responses occur close to the soma. Right: Map of EPSC charge at each location. Scale bar = 100 μm.
Figure 2
Figure 2. AMPAR-mediated cortical inputs to L4 Gad2 interneurons increase during development
A: Map shows spatial connection probability of AMPAR-mediated inputs to layer 4 Gad2 interneurons during development (P5/P6, n = 26 cells; P8/P9 n = 11 cells; P11–P13 n = 22 cells). The input maps (Fig. 1E) of cells were aligned to the somata and averaged. The color scale indicates the fraction of cells that received an input from a particular spatial location. AMPAR-mediated inputs increase over development. The length of bars marking the layer boundaries is 100 μm. White circles indicates soma location. B: Laminar distribution of inputs for each cell. Plotted is the fraction of inputs each cell received at each laminar location. Soma location is indicated by white circles; cells are aligned to L4. Layer borders for each cell are indicated by white horizontal lines. Note that a subset of cells received AMPAR-mediated input from deep layers (including subplate, SP) at P5/6. C: Cumulative distribution function (CDF) of the number of input locations with AMPAR responses. The amount of inputs increased during development (median ± SD P5/6: 4.86 ± 8.6; P8/9: 15.14 ± 13.96; P11–13: 57.13 ± 39.58). Significance tests between groups indicated by inset. White: P > 0.05, brown: P < 0.05, orange: P < 0.001. D: Boxplots show the amount of inputs from each layer. Inputs from all layers increased over development. Significance tests between groups indicated by horizontal bars. * P < 0.05, ** P < 0.001. E: Average fraction of inputs from each layer. Initially cells received most input from L2/3 and L4. F: Plotted is the distance that 80% of inputs from each layer originate. * P < 0.05, ** P < 0.001. Average values can be found in Supplementary Table 1.
Figure 3
Figure 3. GABAergic interneurons have NMDAR-only synapses
A: Sample records of AMPAR-mediated synaptic inputs (lower traces with expanded scale) and NMDAR inputs (upper) revealed by LSPS glutamate uncaging experiments. EPSCs were detected at both holding potentials (−70 mV and +40 mV) for AMPAR-mediated inputs. B: Sample records of NMDAR-only input. EPSCs were only detectable at +40 mV holding potential. Bath application of TTX abolished the event, confirming that the responses were synaptic. Solid blue line indicates the time of uncaging; dashed black lines delimit the window for distinguishing direct activation (< 10 ms after uncaging) and synaptic inputs (> 10 ms and < 50 ms after uncaging). C: Representative input maps. AMPAR-mediated inputs are revealed at the holding potential of −70 mV (left); NMDAR-mediated inputs are observed at +40 mV (middle). NMDAR-only events are those where inputs are observed only in the +40 mV map (right). Pseudocolor scales for charge and peak amplitudes are shown next to each map.
Figure 4
Figure 4. NMDAR-only cortical inputs to L4 Gad2 interneurons reorganize during development
A: Average spatial connection probability maps of NMDAR-only mediated inputs to layer 4Gad2 interneurons during development (same neurons as in Figure 2). The color scale indicates the fraction of cells that received an input from a particular spatial location. NMDAR-only input decreases over development. The length of bars marking layer boundaries is 100 μm. White circles indicates soma location. B: Laminar input distribution for each cell showing the fraction of input each cell received at each laminar location. Layer borders for each cell are indicated by horizontal white lines. Soma location is indicated by white circle; cells are aligned to L4. Cell order is identical to Figure 2B. Note that a subset of cells received NMDAR-only input from deep layers (including subplate) at P5/6 and that most of these cells did not receive AMPAR-mediated input from these layers. C: Cumulative distribution function (CDF) of the number of input locations with NMDAR-only responses. The amount of inputs decreased during development (median ± SD P5/6: 20.45 ± 19.5; P8/9: 29.23 ± 19.8; P11–13: 13.25 ± 10.8). Significance tests between groups indicated by inset. White: P > 0.05, brown: P < 0.05, orange: P < 0.001. D: Boxplots show the amount of inputs from each layer. Inputs from all layers increased over development. Significance tests between groups indicated by horizontal bars. * P < 0.05, ** P < 0.001. E: Average fraction of inputs from each layer. Cells received substantial input from deep layers. F: Plotted is the distance that 80% of inputs from each layer originate. * P < 0.05, ** P < 0.001. Average values can be found in Supplementary Table 1.
Figure 5
Figure 5. Two classes of GABAergic interneurons based on translaminar AMPAR-mediated inputs
A: Results of K-means clustering based on the amount of AMPAR-mediated translaminar inputs for L4 Gad2 interneurons. Optimal cluster size of two was determined by silhouette criterion. Group α GABAergic interneurons integrate more translaminar inputs. B: Average fraction and average amount of inputs from each group for L4 GABAergic interneurons from different age groups. Green, P5/6; red, P8/9; blue, P11–P13. Left: AMPAR-mediated inputs, right: NMDAR-only inputs. Inputs from different layers were coded with different gray values. C: Average connection probability maps for L4 GABAergic interneurons in group α and β across ages. The color scale indicates the fraction of cells that received an AMPAR-mediated (top) or NMDAR-only input (bottom) from a particular spatial location. The length of bars marking the layer boundaries is 100 μm. White circles indicates soma location.
Figure 6
Figure 6. Sensory experience alters AMPAR connections onto GABAergic interneurons
A: Average spatial connection probability maps of AMPAR-mediated inputs to L4 Gad2 interneurons at P13–P14 in control and deaf animals (cochlear ablation at P6) (green: control n = 18; blue: deaf n = 16). Maps show the fraction of cells that received an input from a particular spatial location. AMPAR-mediated inputs from superficial layers seem increased in deaf mice. The length of bars marking layer boundaries is 100 μm. B: Laminar input distribution for each cell. Plotted is the fraction of input each cell received at each laminar location. Layer borders for each cell are indicated by horizontal white lines. Soma locations are indicated by white circle; cells are aligned to L4. C: Cumulative distribution function (CDF) of the number of input locations. Cells from deaf mice show a trend towards increased inputs (median ± SD Control: 58.6 ± 42.6; Deaf: 94.99 ± 34.6). D: Boxplots show the amount of inputs from each layer. All P > 0.05. E: Average fraction of inputs from each layer. F: Plotted is the distance that 80% of inputs from each layer originate. Inputs from L2/3 originated further away in deaf animals (P < 0.001) while input from L5/6 originated from closer locations (P < 0.001). Average values can be found in Supplementary Table 2.
Figure 7
Figure 7. Sensory experience alters NMDAR-only connections onto GABAergic interneurons
A: Average spatial connection probability maps of NMDAR-mediated inputs to L4 Gad2 interneurons at P13–P14 in control and deaf animals (same neurons as in Figure 6, green: control; blue: deaf). Maps show the fraction of cells that received an input from a particular spatial location. The length of bars marking layer boundaries is 100 μm. B: Laminar input distribution for each cell. Plotted is the fraction of input each cell received at each laminar location. Layer borders for each cell are indicated by horizontal white lines. Soma locations are indicated by white circle; cells are aligned to L4. C: Cumulative distribution function (CDF) of the number of input locations. Cells from deaf mice show a trend towards increased inputs (median ± SD Control: 10.8 ± 12.2; Deaf: 15.13 ± 9.8). D: Boxplots show the amount of inputs from each layer. Inputs from L2/3 are increased (p < 0.05), rest are all P > 0.05. E: Average fraction of inputs from each layer. F: Plotted is the distance that 80% of inputs from each layer originate. Inputs from L4 originated further away in deaf animals (P < 0.05) while input from SP originated from closer locations (P < 0.05). Average values can be found in Supplementary Table 2.

Similar articles

Cited by

References

    1. Anastasiades PG, Butt SJ. A role for silent synapses in the development of the pathway from layer 2/3 to 5 pyramidal cells in the neocortex. J Neurosci. 2012;32:13085–13099. - PMC - PubMed
    1. Ascoli GA, Alonso-Nanclares L, Anderson SA, Barrionuevo G, Benavides-Piccione R, Burkhalter A, Buzsáki G, Cauli B, Defelipe J, Fairén A, et al. Petilla terminology: nomenclature of features of GABAergic interneurons of the cerebral cortex. Nat Rev Neurosci. 2008;9:557–568. - PMC - PubMed
    1. Barkat TR, Polley DB, Hensch TK. A critical period for auditory thalamocortical connectivity. Nat Neurosci. 2011;14:1189–1194. - PMC - PubMed
    1. Bartolini G, Ciceri G, MarÌn O. Integration of GABAergic interneurons into cortical cell assemblies: lessons from embryos and adults. Neuron. 2013;79:849–864. - PubMed
    1. Cobos I, Long JE, Thwin MT, Rubenstein JL. Cellular patterns of transcription factor expression in developing cortical interneurons. Cereb Cortex. 2006;16(Suppl 1):i82–88. - PubMed

Publication types

LinkOut - more resources