. 2017 May 9;112(9):1841-1851.
doi: 10.1016/j.bpj.2017.04.003.

Environmental Calcium Controls Alternate Physical States of the Caulobacter Surface Layer

Affiliations

Environmental Calcium Controls Alternate Physical States of the Caulobacter Surface Layer

Jonathan Herrmann et al. Biophys J. .

Abstract

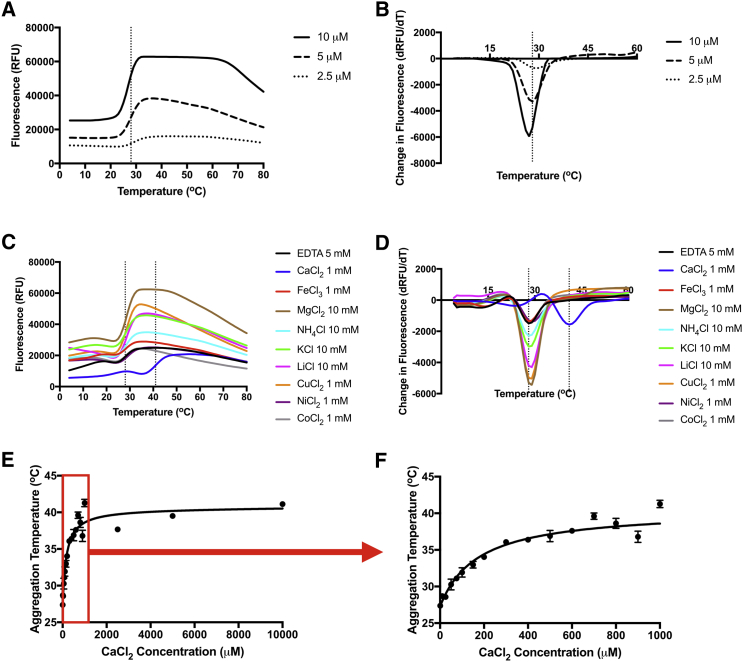
Surface layers (S-layers) are paracrystalline, proteinaceous structures found in most archaea and many bacteria. Often the outermost cell envelope component, S-layers serve diverse functions including aiding pathogenicity and protecting against predators. We report that the S-layer of Caulobacter crescentus exhibits calcium-mediated structural plasticity, switching irreversibly between an amorphous aggregate state and the crystalline state. This finding invalidates the common assumption that S-layers serve only as static wall-like structures. In vitro, the Caulobacter S-layer protein, RsaA, enters the aggregate state at physiological temperatures and low divalent calcium ion concentrations. At higher concentrations, calcium ions stabilize monomeric RsaA, which can then transition to the two-dimensional crystalline state. Caulobacter requires micromolar concentrations of calcium for normal growth and development. Without an S-layer, Caulobacter is even more sensitive to changes in environmental calcium concentration. Therefore, this structurally dynamic S-layer responds to environmental conditions as an ion sensor and protects Caulobacter from calcium deficiency stress, a unique mechanism of bacterial adaptation. These findings provide a biochemical and physiological basis for RsaA's calcium-binding behavior, which extends far beyond calcium's commonly accepted role in aiding S-layer biogenesis or oligomerization and demonstrates a connection to cellular fitness.


Figures

Figure 1
Figure 1
Functional components of the RsaA amino acid sequence. The N-terminal 225 residues of RsaA are responsible for anchoring to the cell membrane whereas the C-terminal 82 residues are sufficient for secretion (gray boxes). Six RTX motifs (arrows) are found in between and are predicted to bind calcium, which might trigger 2D crystallization in vitro.
Figure 2
Figure 2
Physiological evidence for multiple RsaA structural states. (A and B) TEMs of naturally lysed Caulobacter cells were incubated for 30 min in minimal medium with 500 μM CaCl2 (A) or minimal medium without calcium (B). Two regions with visible S-layer unit cells are marked by shaded boxes. Autocorrelation of the shaded boxed regions (insets) indicate higher long-range order in the cell incubated with calcium. The easily observable cell edges shown at the right in blue (A) or red (B) boxes indicate that the S-layer was not shed during the 30 min incubation time with or without calcium. Cells were stained with 2% ammonium molybdate. Scale bars represent 0.3 μm. To see this figure in color, go online.
Figure 3
Figure 3
Characterization of RsaA’s two soluble states in vitro. (A) Shown here are size exclusion chromatograms of RsaA purified at 4°C (blue) and room temperature (red). See also Fig. S1. (B) Shown here is an overlay of SAXS data of 5 mg/mL RsaA at 4°C (blue) and 4 mg/mL RsaA at 30°C. Higher scattering at low q indicates a larger particle size in the heated sample. (C) Given here is a Kratky plot of 5 mg/mL RsaA at 4°C. The data exhibit a pronounced peak with a shoulder consistent with a folded multidomain protein. As the data do not fully return to the baseline at high q values, the domains are likely to be connected by somewhat flexible linkers. (D) The pair-distance distribution function P(r) of RsaA at 4°C exhibits a double peak consistent with a multidomain protein. (E) SAXS data of 5 mg/mL RsaA at 4°C with Guinier analysis (inset) indicates a monomeric species (top). TEM of RsaA at 4°C stained with 1% uranyl acetate confirms a monomeric sample (bottom). (F) SAXS data of 4 mg/mL RsaA at 30°C with Guinier analysis (inset) indicates a highly aggregated sample (top). TEM of RsaA at 30°C stained with 1% uranyl acetate confirms a heterogeneous aggregated sample. Scale bars represent 50 nm. To see this figure in color, go online.
Figure 4
Figure 4
Reversibility and crystallizability of monomeric and aggregated RsaA in vitro. (A) Shown here are size exclusion chromatograms of monomeric RsaA kept at 4°C (blue), heated to 32°C for 10 min, then cooled to 4°C (red) and heated to 32°C for 10 min before the addition of 1 mM CaCl2, and then cooled to 4°C (black). (B) Shown here is a precipitation test of monomeric and aggregated RsaA at 7.5 mg/mL. Upon the addition of 10 mM CaCl2, only monomeric RsaA precipitates. (C) TEM of 8 mg/mL monomeric RsaA with 10 mM CaCl2 stained with 2% ammonium molybdate reveals 2D crystallization. P6 symmetry can be seen in the Fourier transform of the image (inset). Scale bars represent 0.2 μm (D) SAXS/D of (from bottom to top) 0.5, 1, 2, 4, and 8 mg/mL RsaA with 10 mM CaCl2 at 30°C. Peaks used for indexing are denoted by red numbers. Vertical dotted lines indicate predicted peaks with corresponding Miller indices shown assuming a hexagonal lattice with unit cell parameters a = b = 22.2 nm. Powder diffraction image of the 8 mg/mL sample is also shown (inset). See also Fig. S2. To see this figure in color, go online.
Figure 5
Figure 5
RsaA preferentially binds calcium to stabilize the monomeric species in vitro. Shown here are ThermoFluor assay melting curves (A) and their second derivatives (B) of 10 μM (solid), 5 μM (dashed), and 2.5 μM (dotted) RsaA. Vertical dotted lines denote 28°C. Given here are melting curves (C) and their second derivatives (D) of 8 μM RsaA with various chloride salts. Vertical dotted lines denote 28°C and 41°C. Shown also are full view (E) and zoom (F) of RsaA aggregation temperature shifts plotted against CaCl2 concentration. The data were fit to a single-site binding model. Maximum stabilization is 13.2 ± 1.1°C, and the calculated Kd = 172 ± 56 μM with an R2 of 0.94 for n = 3. Data are represented as mean ± standard error. To see this figure in color, go online.
Figure 6
Figure 6
Aggregated RsaA is less folded than the monomeric or crystallized forms in vitro. Shown here are far-UV circular dichroism spectra of monomeric (blue), crystallized (magenta), and aggregated (red) RsaA at 1.8 μM and 15°C. Each spectrum is an average of five scans, with standard error measurements shown. The shallower band of the aggregated sample indicates a decrease in folded secondary structure. To see this figure in color, go online.
Figure 7
Figure 7
RsaA is required for normal growth at low calcium concentrations. (A) Shown here is Western blot analysis of monomeric (solid) and aggregated (dotted) RsaA under calcium deprivation conditions. Monomeric RsaA was collected via dilute acid treatment, whereas aggregated RsaA was solubilized in 8M urea before gel electrophoresis. Band intensities were normalized to time point zero. See also Figs. S3 and S4. (B and C) Shown here are growth curves of wild-type (B) and ΔrsaA (C) Caulobacter in M2G growth medium with calcium concentrations ranging from 403 to 103 μM (solid to shaded, respectively). Growth curves were run in triplicate, but representative curves are shown.
Figure 8
Figure 8
Model of the structural states of RsaA. Monomeric RsaA proceeds to the aggregated state at 28°C at low calcium levels. With calcium (Kd = 172 μM), the RsaA protein is stabilized (aggregation occurs at 41°C) and can proceed to the crystallized state if protein concentration is high enough. Once crystallized, RsaA can be returned to the monomeric state by treatment with dilute acid or to the aggregated state by heating. Simple calcium removal does not appear to cause crystalline RsaA to transition to the aggregated state. Aggregated RsaA cannot return to the monomeric state and cannot crystallize. Therefore, aggregated RsaA is a dead-end state for the Caulobacter S-layer. Scale bars represent 50 nm.

Similar articles

Cited by

References

    1. Albers S.-V., Meyer B.H. The archaeal cell envelope. Nat. Rev. Microbiol. 2011;9:414–426. - PubMed
    1. Sleytr U.B., Sára M. Bacterial and archaeal S-layer proteins: structure-function relationships and their biotechnological applications. Trends Biotechnol. 1997;15:20–26. - PubMed
    1. Gerbino E., Carasi P., Gómez-Zavaglia A. Role of S-layer proteins in bacteria. World J. Microbiol. Biotechnol. 2015;31:1877–1887. - PubMed
    1. Sleytr U.B., Messner P., Sára M. Crystalline bacterial cell surface layers. Mol. Microbiol. 1993;10:911–916. - PubMed
    1. Fagan R.P., Fairweather N.F. Biogenesis and functions of bacterial S-layers. Nat. Rev. Microbiol. 2014;12:211–222. - PubMed

LinkOut - more resources