

Integrated Analysis of Intracellular Dynamics of MenaINV Cancer Cells in a 3D Matrix
- PMID: 28494958
- PMCID: PMC5425400
- DOI: 10.1016/j.bpj.2017.03.030
Integrated Analysis of Intracellular Dynamics of MenaINV Cancer Cells in a 3D Matrix
Abstract
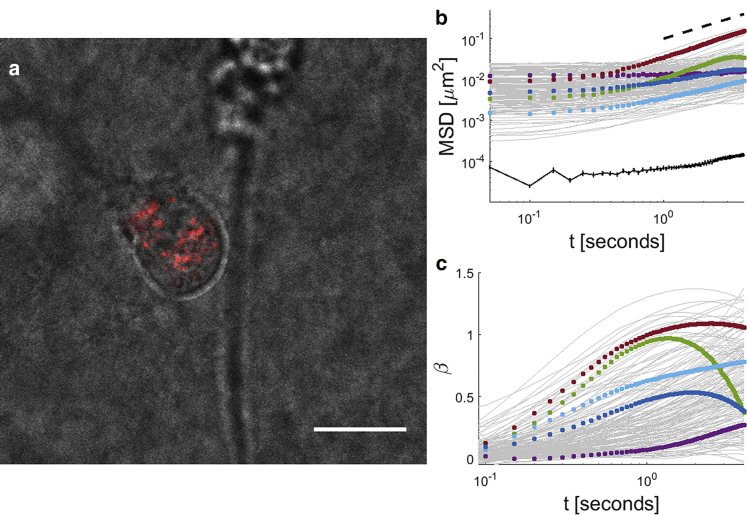
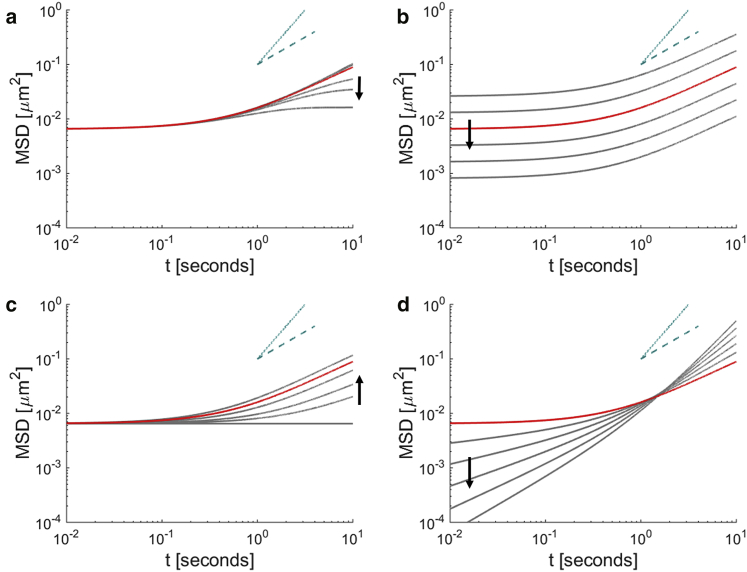
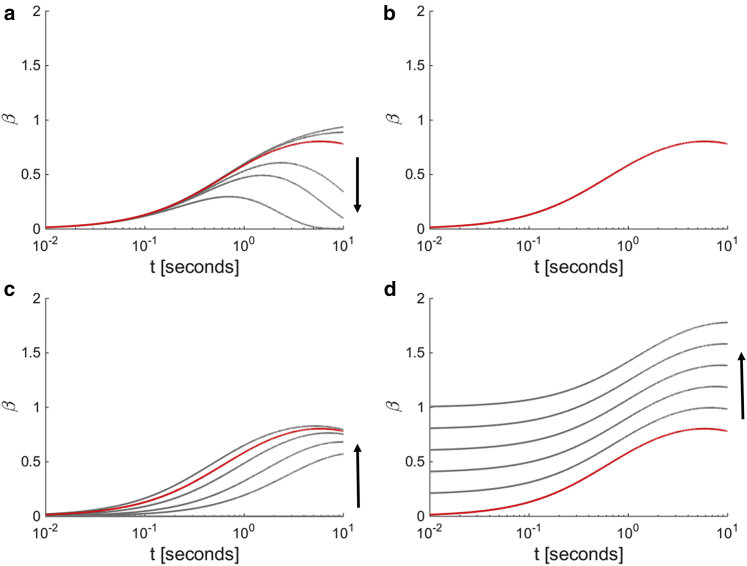
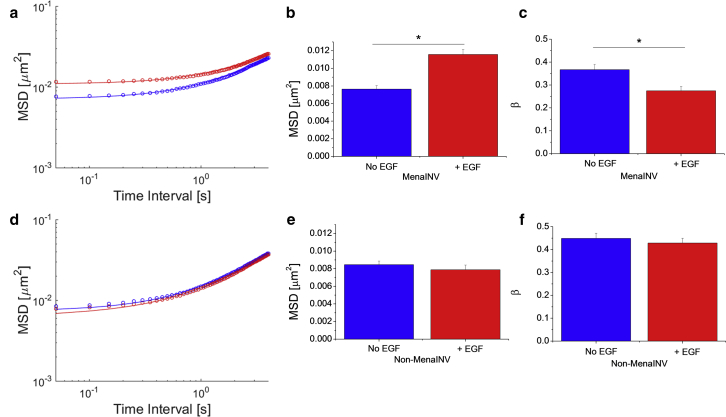
The intracellular environment is composed of a filamentous network that exhibits dynamic turnover of cytoskeletal components and internal force generation from molecular motors. Particle tracking microrheology enables a means to probe the internal mechanics and dynamics. Here, we develop an analytical model to capture the basic features of the active intracellular mechanical environment, including both thermal and motor-driven effects, and show consistency with a diverse range of experimental microrheology data. We further perform microrheology experiments, integrated with Brownian dynamics simulations of the active cytoskeleton, on metastatic breast cancer cells embedded in a three-dimensional collagen matrix with and without the presence of epidermal growth factor to probe the intracellular mechanical response in a physiologically mimicking scenario. Our results demonstrate that EGF stimulation can alter intracellular stiffness and power output from molecular motor-driven fluctuations in cells overexpressing an invasive isoform of the actin-associated protein Mena.
Copyright © 2017 Biophysical Society. Published by Elsevier Inc. All rights reserved.
Figures
Similar articles
-
Characterization of the mechanical properties of cancer cells in 3D matrices in response to collagen concentration and cytoskeletal inhibitors.Integr Biol (Camb). 2018 Apr 23;10(4):232-241. doi: 10.1039/c8ib00044a. Integr Biol (Camb). 2018. PMID: 29620778 Free PMC article.
-
Impact of dimensionality and network disruption on microrheology of cancer cells in 3D environments.PLoS Comput Biol. 2014 Nov 20;10(11):e1003959. doi: 10.1371/journal.pcbi.1003959. eCollection 2014 Nov. PLoS Comput Biol. 2014. PMID: 25412385 Free PMC article.
-
In vivo determination of fluctuating forces during endosome trafficking using a combination of active and passive microrheology.PLoS One. 2010 Apr 6;5(4):e10046. doi: 10.1371/journal.pone.0010046. PLoS One. 2010. PMID: 20386607 Free PMC article.
-
Multiscale modeling and mechanics of filamentous actin cytoskeleton.Biomech Model Mechanobiol. 2012 Mar;11(3-4):291-302. doi: 10.1007/s10237-011-0317-z. Epub 2011 May 26. Biomech Model Mechanobiol. 2012. PMID: 21614531 Review.
-
Mechanics and dynamics of reconstituted cytoskeletal systems.Biochim Biophys Acta. 2015 Nov;1853(11 Pt B):3038-42. doi: 10.1016/j.bbamcr.2015.06.013. Epub 2015 Jun 27. Biochim Biophys Acta. 2015. PMID: 26130089 Free PMC article. Review.
Cited by
-
A mesoscale mechanical model of cellular interactions.Biophys J. 2021 Nov 16;120(22):4905-4917. doi: 10.1016/j.bpj.2021.10.021. Epub 2021 Oct 21. Biophys J. 2021. PMID: 34687718 Free PMC article.
-
Cytoskeletal dynamics regulates stromal invasion behavior of distinct liver cancer subtypes.Commun Biol. 2022 Mar 3;5(1):202. doi: 10.1038/s42003-022-03121-5. Commun Biol. 2022. PMID: 35241781 Free PMC article.
-
Adhesion strength and contractility enable metastatic cells to become adurotactic.Cell Rep. 2021 Mar 9;34(10):108816. doi: 10.1016/j.celrep.2021.108816. Cell Rep. 2021. PMID: 33691109 Free PMC article.
-
Characterization of the mechanical properties of cancer cells in 3D matrices in response to collagen concentration and cytoskeletal inhibitors.Integr Biol (Camb). 2018 Apr 23;10(4):232-241. doi: 10.1039/c8ib00044a. Integr Biol (Camb). 2018. PMID: 29620778 Free PMC article.
-
Mapping Mechanical Properties of the Tumor Microenvironment by Laser Speckle Rheological Microscopy.Cancer Res. 2021 Sep 15;81(18):4874-4885. doi: 10.1158/0008-5472.CAN-20-3898. Cancer Res. 2021. PMID: 34526347 Free PMC article.
References
-
- Paszek M.J., Zahir N., Weaver V.M. Tensional homeostasis and the malignant phenotype. Cancer Cell. 2005;8:241–254. - PubMed
MeSH terms
Substances
Grants and funding
LinkOut - more resources
Full Text Sources
Other Literature Sources
Medical
Research Materials
