. 2017 May 9;112(9):1962-1974.
doi: 10.1016/j.bpj.2017.02.027.

Mechanotransduction Dynamics at the Cell-Matrix Interface

Affiliations

Mechanotransduction Dynamics at the Cell-Matrix Interface

Seth H Weinberg et al. Biophys J. .

Abstract

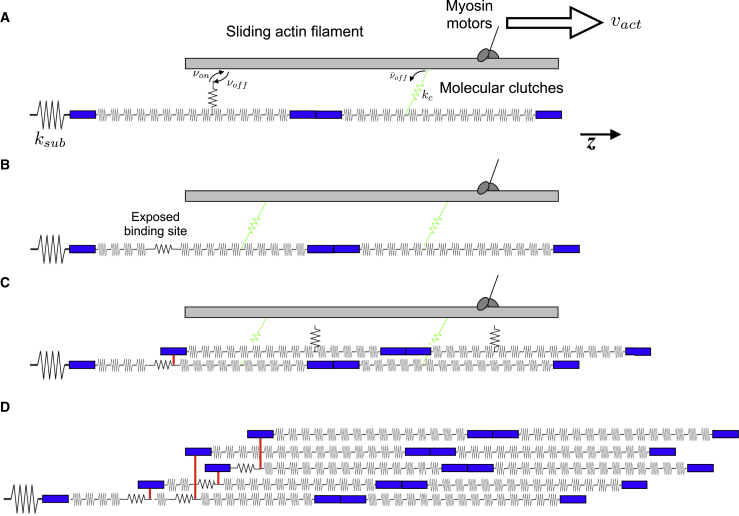
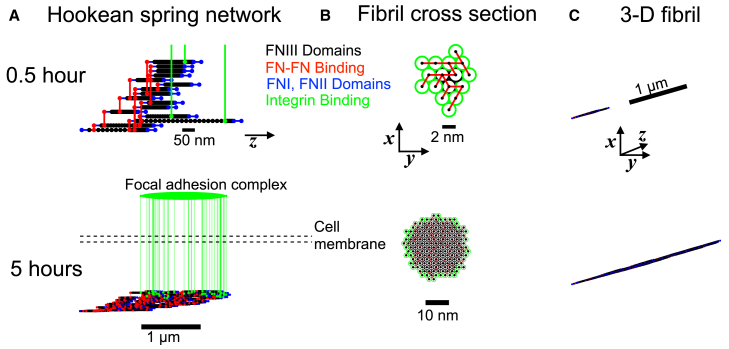
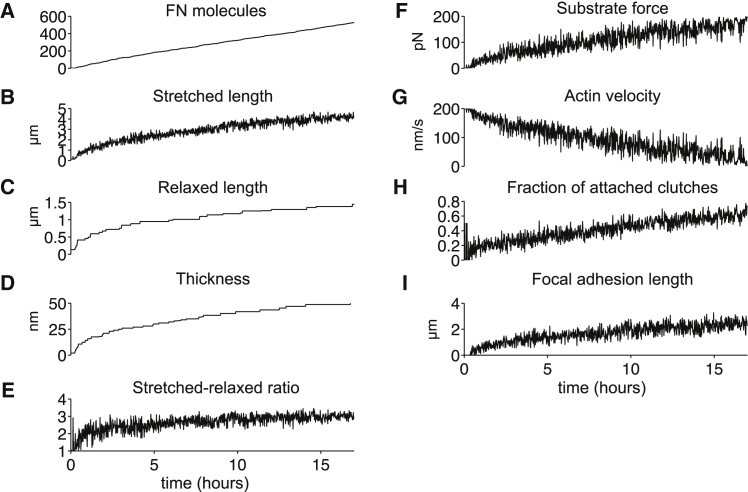
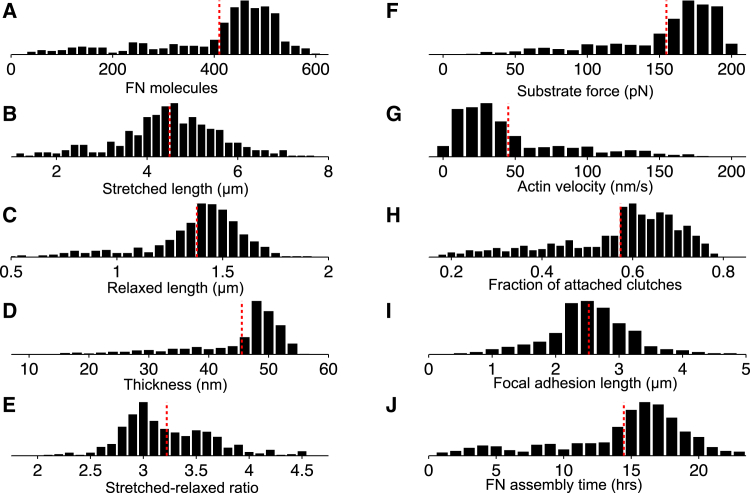
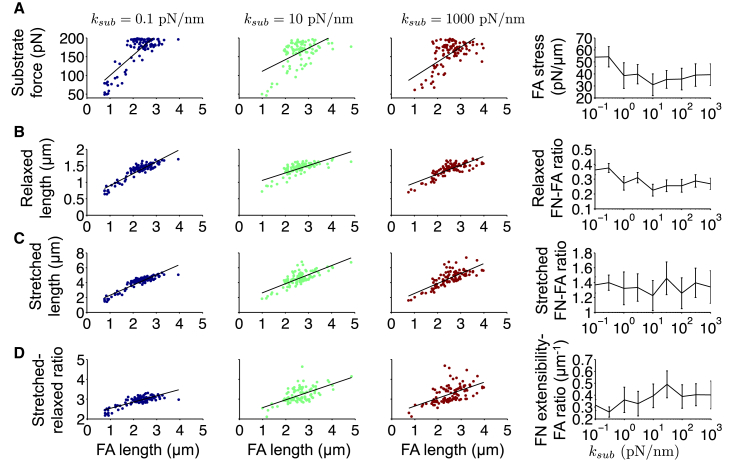
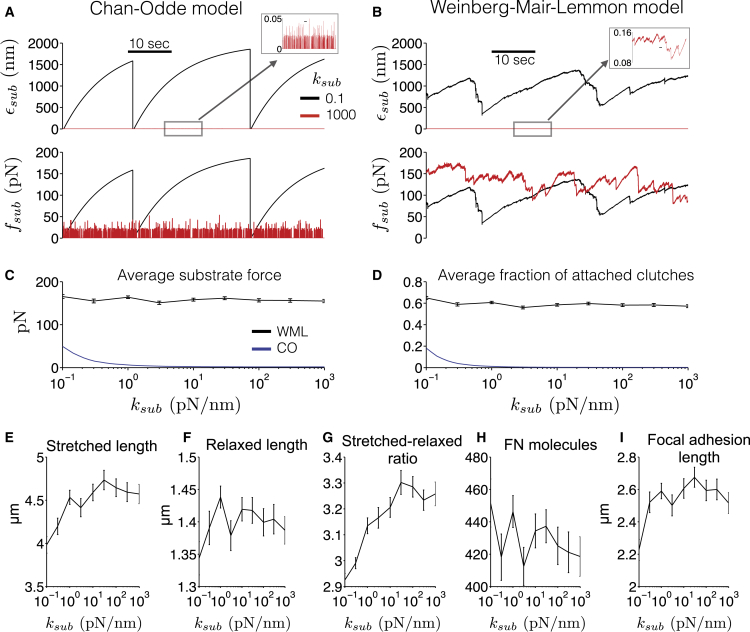
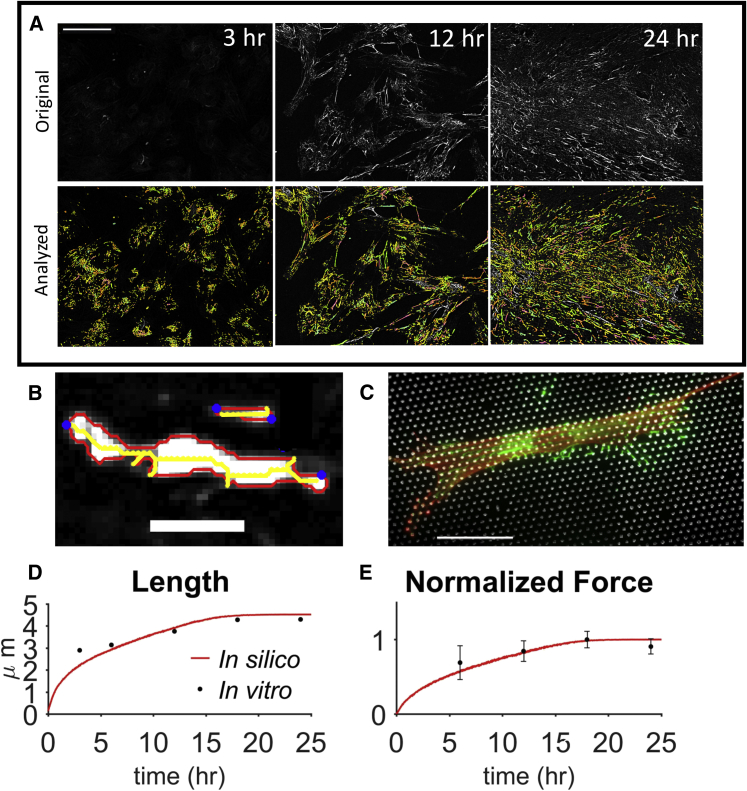
The ability of cells to sense and respond to mechanical cues from the surrounding environment has been implicated as a key regulator of cell differentiation, migration, and proliferation. The extracellular matrix (ECM) is an oft-overlooked component of the interface between cells and their surroundings. Cells assemble soluble ECM proteins into insoluble fibrils with unique mechanical properties that can alter the mechanical cues a cell receives. In this study, we construct a model that predicts the dynamics of cellular traction force generation and subsequent assembly of fibrils of the ECM protein fibronectin (FN). FN fibrils are the primary component in primordial ECM and, as such, FN assembly is a critical component in the cellular mechanical response. The model consists of a network of Hookean springs, each representing an extensible domain within an assembling FN fibril. As actomyosin forces stretch the spring network, simulations predict the resulting traction force and FN fibril formation. The model accurately predicts FN fibril morphometry and demonstrates a mechanism by which FN fibril assembly regulates traction force dynamics in response to mechanical stimuli and varying surrounding substrate stiffness.


Figures

Figure 1
Figure 1
Schematic illustration of the FN model. (A) Assembly begins with a single FN molecule, represented by 30 springs in series, attached to an elastic substrate, with stiffness ksub. Myosin motors pull on the sliding actin filament at velocity vact along the z axis. Molecular clutches reversibly bind the actin filament with rates von and voff. Engaged molecular clutches transmit a force proportional to the clutch stiffness kc, and disengage with a force-dependent off-rate v¯off. Note that engaged clutches are connected in parallel with springs representing FN Type III domains. (B) Actomyosin-driven forces stretch the FN Type III domains, exposing a cryptic FN binding site. (C) A soluble FN molecule in the extracellular space binds to the exposed binding site. (D) Subsequent molecular clutch engagement, FN Type III domain stretching, and FN-FN binding events produce an elastic, insoluble FN fibril. To see this figure in color, go online.
Figure 2
Figure 2
Structure and architecture of the assembling fibronectin fibril. A representative simulation structure and architecture are shown at 0.5 and 5 h. (A) The Hookean spring network connections along the z axis are shown: elastic FN Type III domains (black), FN-FN binding (red), inelastic FN Type I and II domains (blue), and integrin binding (green) are shown. The FA complex is illustrated in the intracellular space as spanning the range of FN-bound integrins. (B) The FN fibril cross section in the x,y plane is shown, with FN-FN connections (red). Interior and exterior FN molecules are shown in black and green, respectively. (C) The 3D FN fibril architecture is shown. Parameters: ksub = 1000 pN/nm. To see this figure in color, go online.
Figure 3
Figure 3
Nonlinear spring stiffness for FN Type III domains. The steady-state spring stiffness values for the FN Type III domains (ki in Eq. 7) are shown as a function of the domain stretch ϵ. (Top) In the absence of actomyosin forces and small domain stretch, each FN Type III domain spring constant k is equal to a unique spring constant ki,0 (Table S2), representing the unique mechanical properties of each FN Type III domain (black lines). (Bottom) In the presence of large actomyosin forces and large domain stretch, domain stiffness values are governed by a WLC model, producing a highly nonlinear increase in domain stiffness. (Red line) Domain binding site exposure threshold ϵt. (Dashed vertical blue line, top panel) To see this figure in color, go online.
Figure 4
Figure 4
Morphometrical, mechanical, and biochemical properties during FN fibril assembly. (A) The number of FN molecules, (B) stretched length, (C) relaxed length, (D) thickness, (E) extensibility, given by the stretched-relaxed length ratio, (F) substrate force, (G) actin filament velocity, (H) the fraction of attached molecular clutches, and (I) the FA length are shown as a function of time for a 16-h simulation of an assembling FN fibril. The fraction of attached molecular clutches is given by total clutches bound to the FN Type III-10 domain, divided by the total number of clutches available for binding (two per exterior FN molecule). Measurements are for the simulation presented in Fig. 2.
Figure 5
Figure 5
Summary of morphometrical, mechanical, and biochemical properties of assembled FN fibrils. Histograms for the following measurements and properties are shown for 500 numerical simulations: (A) number of FN molecules, (B) stretched length, (C) relaxed length, (D) thickness, (E) extensibility, given by the stretched-relaxed length ratio, (F) substrate force, (G) actin filament velocity, (H) the fraction of attached molecular clutches, and (I) FA length. (J) Summary data for total assembly time is shown. In all panels, the dashed red line denotes the mean. Parameters: ksub = 1000 pN/nm. To see this figure in color, go online.
Figure 6
Figure 6
Model predictions for the relationship between FA length and assembled FN fibril morphometrical and mechanical properties. (Left three panels) (A) Substrate force, (B) relaxed FN fibril length, (C) stretched FN fibril length, and (D) fibril extensibility (stretched-relaxed FN length ratio) are plotted as a function of predicted FA length, for different values of substrate stiffness ksub. Each dot represents a single simulation. (Right panels) (A) FA stress (substrate force-FA length ratio), (B) relaxed FN length-FA length ratio, (C) stretched FN length-FA length ratio, and (D) FN extensibility-FA length ratio, as determined by a linear least squares fit, are shown as a function of ksub. To see this figure in color, go online.
Figure 7
Figure 7
Mechanotransduction model predictions of substrate stiffness dependence. (A) Chan-Odde (CO) model is simulated (23), using model parameters given in Tables S1 and S2. Substrate deflection ϵsub (top) and force fsub (bottom) are shown as a function of time on soft (black lines) and rigid (red lines) substrates, illustrating the load-and-fail and frictional-slippage regimes, respectively. (B) Substrate deflection and force, from simulations of our model (Weinberg-Mair-Lemmon, WML), illustrate an intermediate mechanotransduction regime. WML model mean ± SE, for (C) substrate force and (D) fraction of attached molecular clutches are shown as a function of substrate stiffness ksub in the CO (blue lines) and WML (black lines) models. Mean ± SE, for (E) stretched length, (F) relaxed length, (G) stretched-relaxed length ratio, (H) number of FN molecules, and (I) FA length are shown as a function of ksub. Pearson correlation coefficient between the logarithm of ksub and WML model means (95% confidence interval): (E) 0.779 (0.237,0.951), p = 0.013, (F) 0.290 (−0.463,0.800), p = 0.445, (G) 0.871 (0.490, 0.973), p = 0.0022, (H) −0.467 (−0.863, 0.286), p = 0.205, (I) 0.557 (−0.169, 0.8915), p = 0.119. In (C) and (D), CO model means are computed by time-averaging over a 1-min simulation. In (C)–(I), WML model averages are computed by time-averaging over the minute preceding FN assembly termination, and then averaged over 100 simulations. To see this figure in color, go online.
Figure 8
Figure 8
FN fibril in vitro morphometrical and force measurements. (A) Raw (top) and analyzed (bottom) FN fibril images at different time points. Scale bars, 100 μm. (B) Two analyzed FN fibrils, in which custom image processing measures fibril image outline (red), skeleton (yellow), and end points (blue). Fibril length is quantified as the maximum end-to-end distance of the image skeleton. Scale bars, 5 μm. (C) Composite image of a cell on mPADs, used to quantify cell-generated traction forces. (Red) Actin; (white) mPAD posts; (green) FN. Scale bars, 50 μm. (D) Comparison of in silico (red) and in vitro (black) FN fibril length. Standard error bars too small to be visible. (E) Comparison of in silico and in vitro normalized force data. In silico and in vitro measurements normalized to a maximum of 155.7 and 6.2 pN, respectively. In (D) and (E), error bars denote the standard error. To see this figure in color, go online.

Comment in

  • Tug of War at the Cell-Matrix Interface.
    Provenzano PP. Provenzano PP. Biophys J. 2017 May 9;112(9):1739-1741. doi: 10.1016/j.bpj.2017.03.032. Biophys J. 2017. PMID: 28494945 Free PMC article. No abstract available.

Similar articles

Cited by

References

    1. Jaalouk D.E., Lammerding J. Mechanotransduction gone awry. Nat. Rev. Mol. Cell Biol. 2009;10:63–73. - PMC - PubMed
    1. Chen C.S. Mechanotransduction—a field pulling together? J. Cell Sci. 2008;121:3285–3292. - PubMed
    1. DuFort C.C., Paszek M.J., Weaver V.M. Balancing forces: architectural control of mechanotransduction. Nat. Rev. Mol. Cell Bio. 2011;12:308–319. - PMC - PubMed
    1. Eyckmans J., Boudou T., Chen C.S. A hitchhiker’s guide to mechanobiology. Dev. Cell. 2011;21:35–47. - PMC - PubMed
    1. van Oers R.F.F., Rens E.G., Merks R.M. Mechanical cell-matrix feedback explains pairwise and collective endothelial cell behavior in vitro. PLOS Comput. Biol. 2014;10:e1003774. - PMC - PubMed