. 2017 May 9;112(9):1975-1983.
doi: 10.1016/j.bpj.2017.02.035.

Visualizing Calcium Flux in Freely Moving Nematode Embryos

Affiliations

Visualizing Calcium Flux in Freely Moving Nematode Embryos

Evan L Ardiel et al. Biophys J. .

Abstract

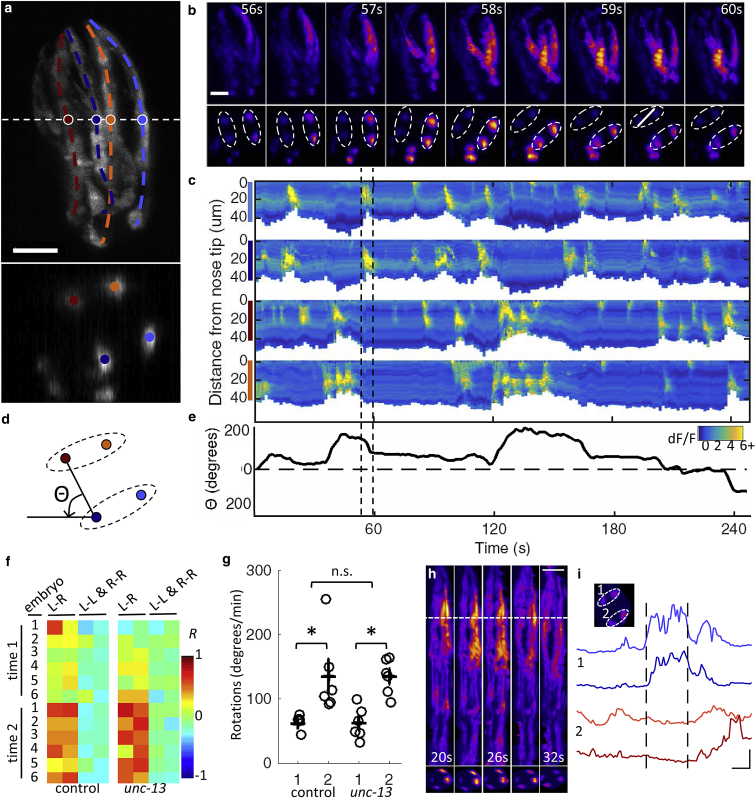
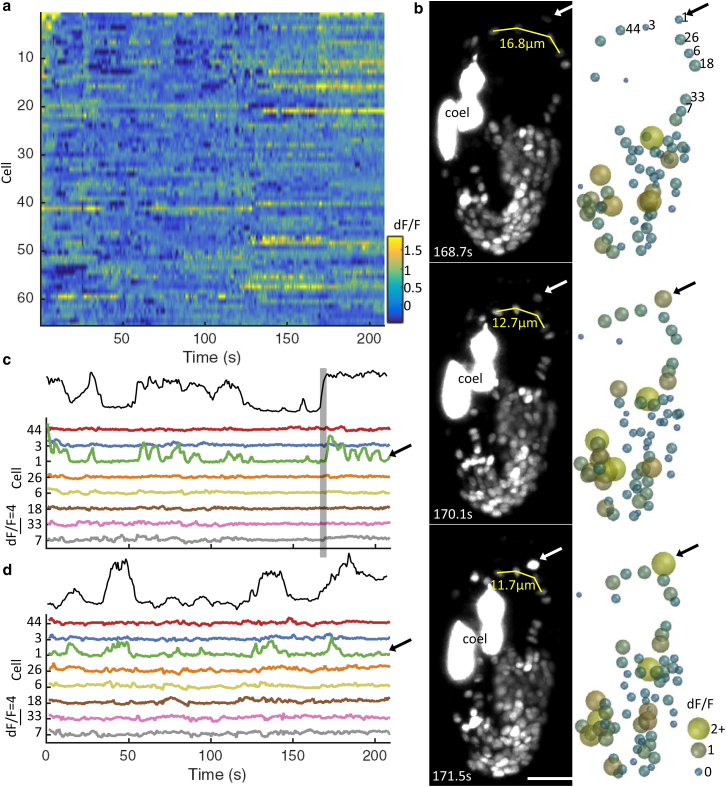
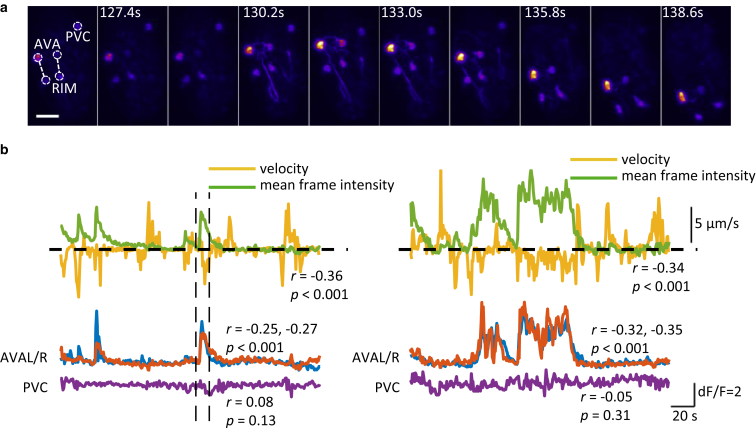
The lack of physiological recordings from Caenorhabditis elegans embryos stands in stark contrast to the comprehensive anatomical and gene expression datasets already available. Using light-sheet fluorescence microscopy to address the challenges associated with functional imaging at this developmental stage, we recorded calcium dynamics in muscles and neurons and developed analysis strategies to relate activity and movement. In muscles, we found that the initiation of twitching was associated with a spreading calcium wave in a dorsal muscle bundle. Correlated activity in muscle bundles was linked with early twitching and eventual coordinated movement. To identify neuronal correlates of behavior, we monitored brainwide activity with subcellular resolution and identified a particularly active cell associated with muscle contractions. Finally, imaging neurons of a well-defined adult motor circuit, we found that reversals in the eggshell correlated with calcium transients in AVA interneurons.


Figures

Figure 1
Figure 1
High speed interrogation of muscular calcium dynamics in the posttwitching embryo. (a) Two-fold embryo expressing GCaMP3 from a myo-3 promoter, as seen in lateral maximum intensity projection (top) and cross section through the volume at dotted white line (bottom). Quadrants are colored identically in (a), (c), and (d). See also Movie S2. (b) Representative projections (top) and cross sections (bottom) at indicated time points, emphasizing spreading calcium waves (top, magenta) and rotation of animal (bottom). Dotted ellipses in bottom row encircle left and right muscle bundles. (c) Fluorescence intensity along each bundle over time. Dashed lines in (c) and (e) denote time window highlighted in (b). (d) Angular coordinate system from which rotation behavior is quantified in (e). (f) Correlation coefficients for fluorescence intensity in left-right and ipsilateral muscle bundle pairs. Each row corresponds to an embryo in one of two imaging sessions (time 1 or time 2). Imaging sessions were 3 min 20 s in duration and separated by 20 min during the 1.75- to two-fold transition. (g) Minimum to maximum angular change/min during time windows 1 and 2. (Open circles) Measurements derived from individual embryos; (black crosses) mean ± SE. (Asterisks and n.s.) Statistically distinguishable (paired t-test, p < 0.05) and indistinguishable (unpaired t-test, p > 0.05) groups, respectively. (h) Representative maximum intensity projections (left) and cross sections (right) at select time points in the untwisted reference frame. See also Movie S4. (i) Fluorescence traces for each bundle at location indicated by dotted white line in (h) (scale bars, 5 s (horizontal) and dF/F = 2 (vertical)). All other scale bars, 10 μm (horizontal). (Inset) Dotted ellipses encircle left and right muscle bundles in the cross section. Volumetric imaging was performed at 2 Hz for (b)–(e) and (h) and (i) and 1 Hz for (f) and (g). The ImageJ Fire Lookup Table was used in (b) and (h). To see this figure in color, go online.
Figure 2
Figure 2
Brainwide neuronal imaging in the three-fold embryo. (a) dF/F traces for neuronal nuclei tracked from an early three-fold embryo expressing nuclear-localized GCaMP5K from a unc-31 promoter. Cells are sorted by degree of correlation with the most active cell (i.e., neuron 1 in ad). (b) Representative maximum intensity projections (left; coel, GFP-expressing coelomocytes) and corresponding schematic representations (right; color and size of nuclei correspond to dF/F). Scale bars, 10 μm (horizontal). See also Movie S5. (c) 1/length indicated in (b) and dF/F traces for specified neuronal nuclei. Note the correlation between length metric (solid) and activity of neuron 1. (Shaded band) denotes time window highlighted in (b). (d) Time point 2, 2 h after (c). Imaging was performed at 1.4 Hz (volumetric). To see this figure in color, go online.
Figure 3
Figure 3
Linking behavior to calcium activity in command interneurons. (a) (Left) Maximum intensity projections of a late three-fold embryo expressing GCaMP3 from an nmr-1 promoter. Velocity was calculated along the vector linking AVA and RIM. Scale bars, 10 μm (horizontal). The ImageJ Fire Lookup Table was used for display. See also Movie S7. (b) Velocity and mean fluorescence intensity of entire frame (above). Fluorescence intensity traces of tracked AVAL, AVAR, and PVC cell bodies from two embryos (left and right). (Vertical dashed lines) Period depicted in (a). Imaging was performed at 1.4 Hz (volumetric). Correlation coefficients for velocity and intensity are indicated in figure. To see this figure in color, go online.

Comment in

  • How to Make a Worm Twitch.
    Keller PJ. Keller PJ. Biophys J. 2017 May 9;112(9):1737-1738. doi: 10.1016/j.bpj.2017.03.035. Biophys J. 2017. PMID: 28494944 Free PMC article. No abstract available.

References

    1. Blankenship A.G., Feller M.B. Mechanisms underlying spontaneous patterned activity in developing neural circuits. Nat. Rev. Neurosci. 2010;11:18–29. - PMC - PubMed
    1. Jin X., Pokala N., Bargmann C.I. Distinct circuits for the formation and retrieval of an imprinted olfactory memory. Cell. 2016;164:632–643. - PMC - PubMed
    1. Sulston J.E., Schierenberg E., Thomson J.N. The embryonic cell lineage of the nematode Caenorhabditis elegans. Dev. Biol. 1983;100:64–119. - PubMed
    1. Heiman M.G., Shaham S. DEX-1 and DYF-7 establish sensory dendrite length by anchoring dendritic tips during cell migration. Cell. 2009;137:344–355. - PMC - PubMed
    1. Wu Y., Ghitani A., Shroff H. Inverted selective plane illumination microscopy (iSPIM) enables coupled cell identity lineaging and neurodevelopmental imaging in Caenorhabditis elegans. Proc. Natl. Acad. Sci. USA. 2011;108:17708–17713. - PMC - PubMed

LinkOut - more resources