. 2017 Jul:289:116-129.
doi: 10.1016/j.mbs.2017.04.008. Epub 2017 May 8.

Modeling glucose metabolism and lactate production in the kidney

Affiliations

Modeling glucose metabolism and lactate production in the kidney

Ying Chen et al. Math Biosci. 2017 Jul.

Abstract

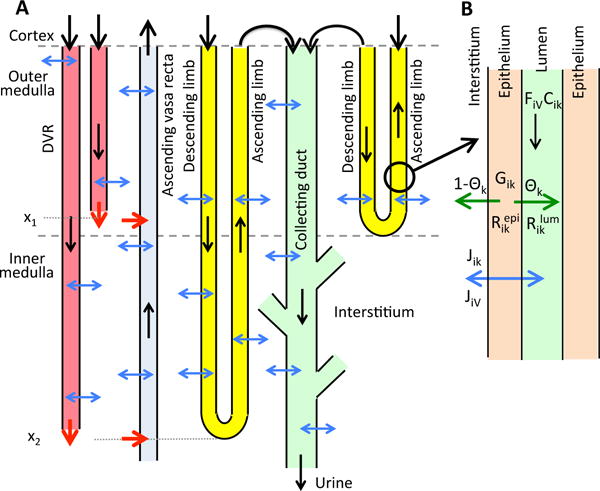
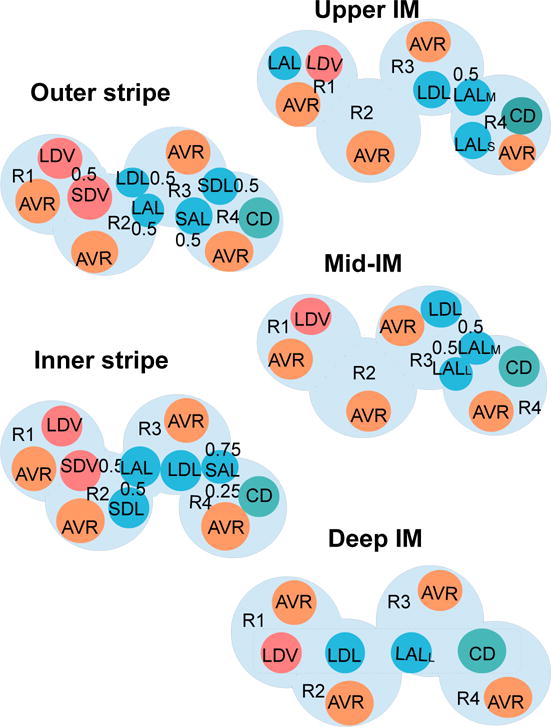
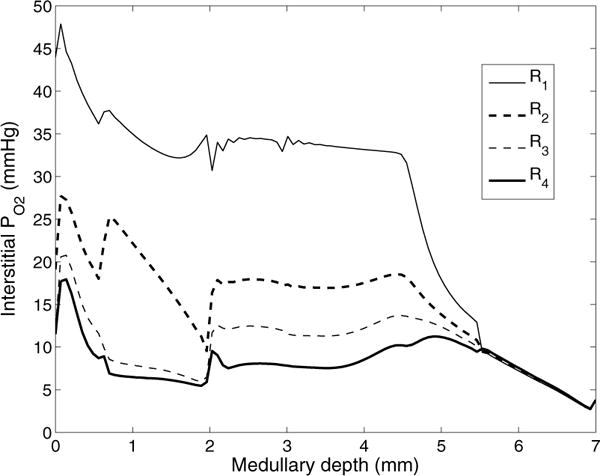
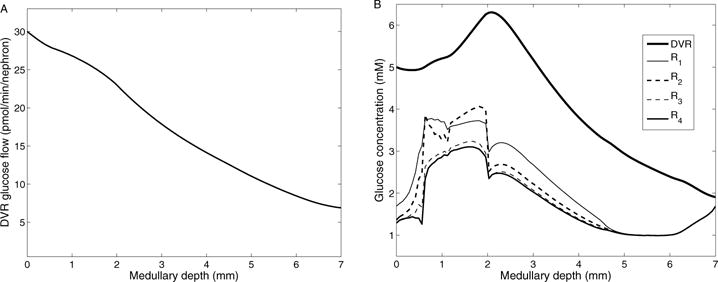
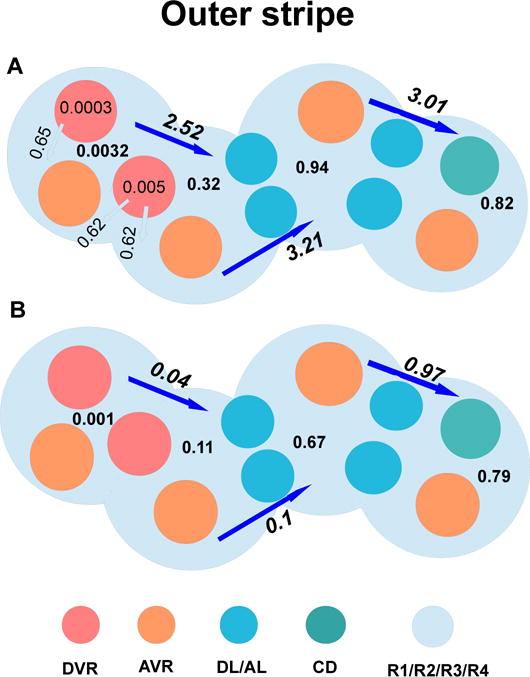
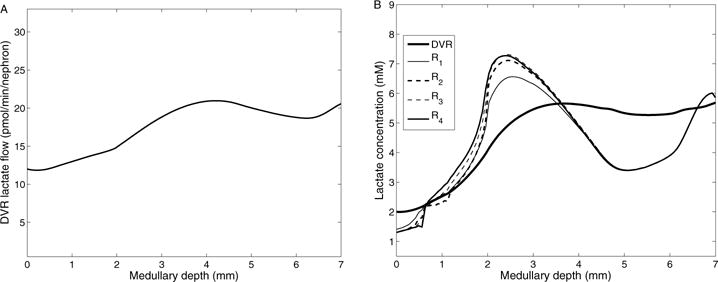
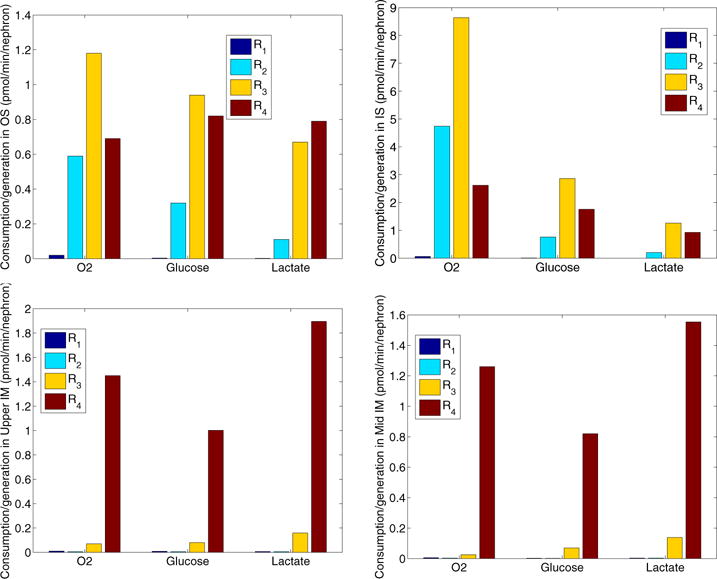
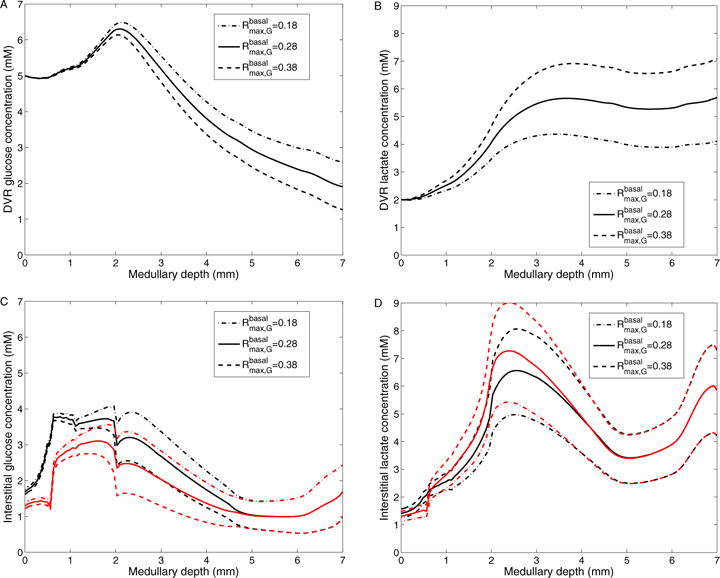
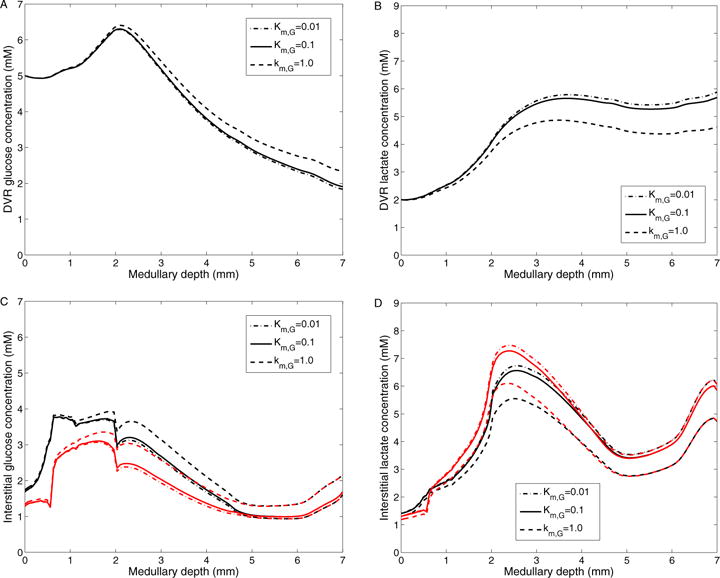
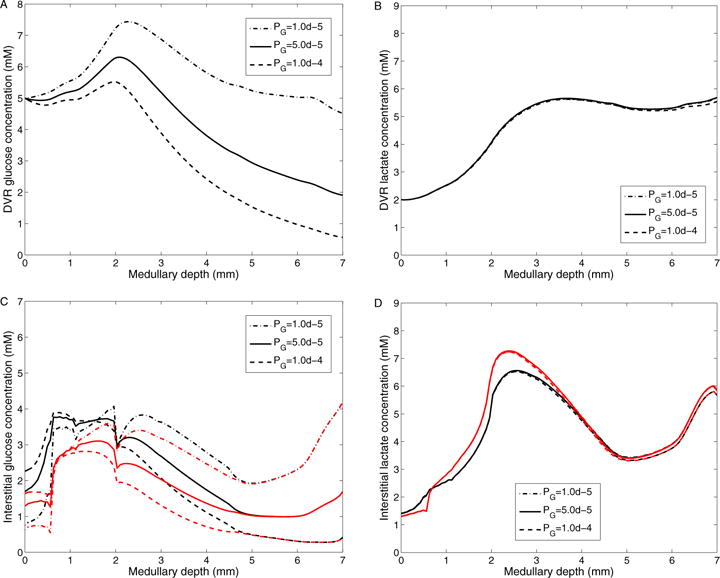
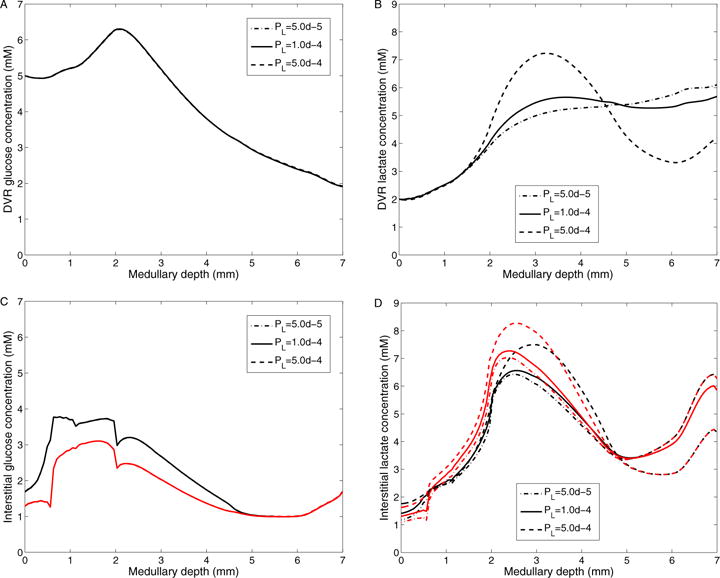
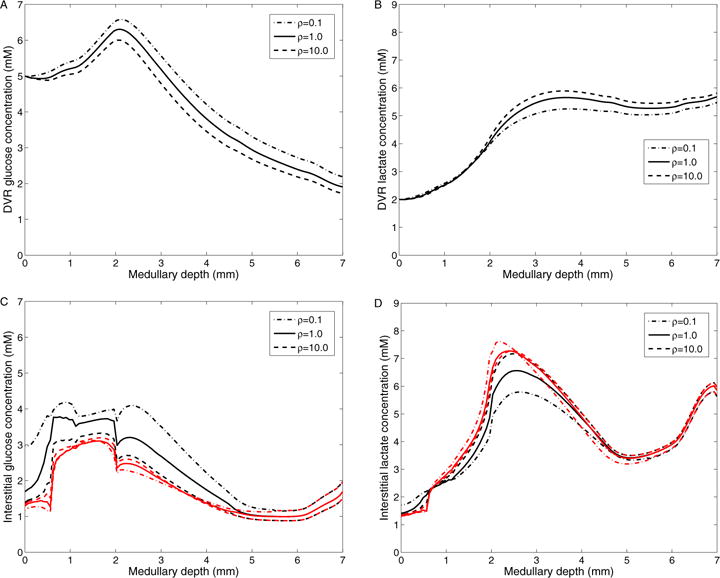
The metabolism of glucose provides most of the ATP required for energy-dependent transport processes. In the inner medulla of the mammalian kidney, limited blood flow and O2 supply yield low oxygen tension; therefore, a substantial fraction of the glucose metabolism in that region is anaerobic. Lactate is considered to be a waste product of anaerobic glycolysis, which yields two lactate molecules for each glucose molecule consumed, thereby likely leading to the production and accumulation of a significant amount of lactate in the inner medulla. To gain insights into the transport and metabolic processes in the kidney, we have developed a detailed mathematical model of the renal medulla of the rat kidney. The model represents the radial organization of the renal tubules and vessels, which centers around the vascular bundles in the outer medulla and around clusters of collecting ducts in the inner medulla. Model simulations yield significant radial gradients in interstitial fluid oxygen tension and glucose and lactate concentrations in the outer medulla and upper inner medulla. In the deep inner medulla, interstitial fluid concentrations become much more homogeneous, as the radial organization of tubules and vessels is not distinguishable. Using this model, we have identified parameters concerning glucose transport and basal metabolism, as well as lactate production via anaerobic glycolysis, that yield predicted blood glucose and lactate concentrations consistent with experimental measurements in the papillary tip. In addition, simulations indicate that the radial organization of the rat kidney may affect lactate buildup in the inner medulla.

Keywords: Anaerobic respiration; Glycolysis; Renal physiology.


Figures

Figure 1
Figure 1
A, schematic diagram of overall structure of model medulla. B, schematic diagram showing key processes involved in the conservation of fluid and solutes in the luminal flow of a tubule i (Eqs. 2 and 3). Panel A depicts a short loop, which consists of a descending limb and a contiguous ascending limb and which turns at the OM-IM boundary, and a long loop that turns within the IM (at x2). Although only one long loop is shown, the model represents one long loop that turns at every spatial point in the IM. Similarly, only two representative DVR are shown (with one terminating at x1 and one at x2), whereas the model represents one DVR that terminates at every spatial point. A representative CD is shown. The black arrows at the cortico-medullary boundary represent boundary flows. The outflow of the ascending limbs determines the inflow of the CD. The red arrows at the DVR outlets denote capillary sources at x1 and x2. The net fluid and solute accumulations at those medullary levels are taken up by the ascending vasa recta, as indicated by the red arrows pointing into the ascending vasa recta. The blue arrows represent transmural water and solute fluxes. CD outflow becomes urine. In panel B, lumen is surrounded by a layer of epithelial cells. Within the lumen, FiV denotes water flow and Cik denotes the concentration of solute k. Flow direction is indicated by the black arrow. The product FiVCik gives solute flow rate. The net volumetric consumption rate of a reactive solute is denoted by Riklum within the lumen and by Rikepi in the epithelia. The epithelial volumetric generation rate of the solute is denoted by Gik. A fraction θk of the net generation (or consumption) of the solute by the cells is directed into (or taken out of) the lumen, and indicated by the green arrow; the remainder (1 − θk) is directed into (or taken out of) the interstitium. Transmural water and solute fluxes are denoted by JiV and Jik, respectively, and by the blue arrow.
Figure 2
Figure 2
The fraction of DVR that extend beyond medullary depth.
Figure 3
Figure 3
Schematic diagram of a cross section through the outer stripe, inner stripe, upper IM, mid-IM, and deep IM, showing interstitial regions (R1, R2, R3, R4) and relative positions of tubules and vessels. Decimal numbers indicate relative interaction weightings with regions (e.g., in the outer stripe, half of the short descending vasa recta (SDV) lie in R1, and half lie in R2). SDL/SAL, descending/ascending limbs of short loops of Henle. LDL/LAL, descending/ascending limbs of long loops of Henle. Subscript ‘S,’ ‘M,’ and ‘L’ associated with a LAL denotes limbs that turn with the first mm of the IM (S), within the mid-IM (M), or reach into the deep IM (L). CD, collecting duct. SDV, short descending vasa recta. LDV, long descending vas rectum. AVR, ascending vasa recta. Dotted-line box in deep IM indicates that LDV, LDL, LALL, and CD are weighted evenly between the four regions. Tubules, vessels, and interstitium are denoted in blue (LDL, SDL, LAL, SAL), teal (CD), orange (AVR), pink (DVR), and light blue (interstitium), respectively.
Figure 4
Figure 4
Interstitial fluid PO2 as a function of medullary depth, generated using baseline model parameters. Medullary depth x = 0 mm corresponds to the cortico-medullary boundary; x = 0.6 mm, inner-outer stripe boundary; x = 2 mm, OM-IM boundary; x = 7 mm, papillary tip.
Figure 5
Figure 5
A, DVR glucose flow as a function of medullary depth. B, interstitial and DVR fluid glucose concentration profiles.
Figure 6
Figure 6
Local fluxes and consumption rate of glucose (panel A), as well as local fluxes and production rate of lactate (panel B) within the outer stripe. The long arrows and corresponding values represent glucose/lactate flux between regions, in units of pmol/min/nephron. The short arrows and corresponding values represent fluxes between vessels and regions, in units of pmol/min/nephron. The numbers in the regions and vessels not attached to arrows represent net glucose consumption/lactate production, in units of pmol/min/nephron. In the outer stripe, TALs are located at R3 and R4, which are far away from O2-supplying DVR, and where active Na+ transport is taken place, resutling in higher glucose consumption and lactate productoin.
Figure 7
Figure 7
A, DVR lactate flow as a function of medullary depth. B, interstitial and DVR fluid lactate concentration profiles.
Figure 8
Figure 8
Consumptions of O2 and glucose, as well as productions of lactate of four regions within the outer stripe, inner stripe, upper inner medulla, and mid inner medulla. In the OM, the TALs, with active NaCl transport, have the highest metabolic demand of O2 among all tubules and vessels. The TALs are located in the interbundle regions (R3 and R4). In the IM, CD cells account for the majority of the IM O2 consumption owing to the active NaCl transport, where the CDs occupy region R4. Due to the low level of PO2 in the IM, a substantial fraction of the CD transport is attributable to anaerobic respiration, and anaerobic glycolysis of glucose dominates in R4, resulting in high glucose-to-lactate conversion rate in R4 in the inner medulla.
Figure 9
Figure 9
Results for varying maximum rate of basal glucose metabolism. A: DVR glucose concentrations; B: DVR lactate concentrations; C: Interstitial R1 (black) and R4 (red) glucose concentrations; D: Interstitial R1 (black) and R4 (red) lactate concentrations; Obtained for Rmax,Gbasal of 0.18, 0.28 (baseline), and 0.38 mM/s.
Figure 10
Figure 10
Results for varying Michaelis-Menten constant in basal glucose metabolism. A: DVR glucose concentrations; B: DVR lactate concentrations; C: Interstitial R1 (black) and R4 (red) glucose concentrations; D: Interstitial R1 (black) and R4 (red) lactate concentrations; Obtained for KM,G of 0.01, 0.1 (baseline), and 1.0 mM.
Figure 11
Figure 11
Results for varying DVR glucose permeability. A: DVR glucose concentrations; B: DVR lactate concentrations; C: Interstitial R1 (black) and R4 (red) glucose concentrations; D: Interstitial R1 (black) and R4 (red) lactate concentrations; Obtained for DVR glucose permeabilities of 10−5, 5 × 10⁻⁵ (baseline), and 10−4 cm/s.
Figure 12
Figure 12
Results for varying DVR lactate permeability. A: DVR glucose concentrations; B: DVR lactate concentrations; C: Interstitial R1 (black) and R4 (red) glucose concentrations; D: Interstitial R1 (black) and R4 (red) lactate concentrations; Obtained for DVR lactate permeabilities of 5 × 10⁻⁵, 10−4 (baseline), and 5 × 10⁻⁴ cm/s.
Figure 13
Figure 13
Results for varying inter-region permeabilities. A: DVR glucose concentrations; B: DVR lactate concentrations; C: Interstitial R1 (black) and R4 (red) glucose concentrations; D: Interstitial R1 (black) and R4 (red) lactate concentrations; Obtained by varying interregion glucose and lactate permeabilities by a factor of ρ: 0.1, 1.0 (baseline), and 10.0.

Similar articles

Cited by

References

    1. Bagnasco S, Good D, Balaban R, Burg M. Lactate production in isolated segments of the rat nephron. Am J Physiol Renal Physiol. 1985;248:F522–F526. - PubMed
    1. Chen J, Edwards A, Layton AT. Effects of pH and medullary blood flow on oxygen transport and sodium reabsorption in the rat outer medulla. Am J Physiol Renal Physiol. 2009;298:F1369–F1383. - PMC - PubMed
    1. Chen J, Edwards A, Layton AT. A mathematical model of oxygen transport in the rat outer medulla: II. Impacts of outer medullary architecture. Am J Physiol Renal Physiol. 2009;297:F537–F548. - PMC - PubMed
    1. Chen J, Layton AT, Edwards A. A mathematical model of oxygen transport in the rat outer medulla: I. Model formulation and baseline results. Am J Physiol Renal Physiol. 2009;297:F517–F536. - PMC - PubMed
    1. Chen Y, Fry BC, Layton AT. Modeling glucose metabolism in the kidney. Bull Math Biol. 2016;78:1318–1336. - PMC - PubMed