. 2017 Aug:36:176-188.
doi: 10.1016/j.cellsig.2017.05.006. Epub 2017 May 8.

Concurrent activation of β2-adrenergic receptor and blockage of GPR55 disrupts pro-oncogenic signaling in glioma cells

Affiliations

Concurrent activation of β2-adrenergic receptor and blockage of GPR55 disrupts pro-oncogenic signaling in glioma cells

Artur Wnorowski et al. Cell Signal. 2017 Aug.

Abstract

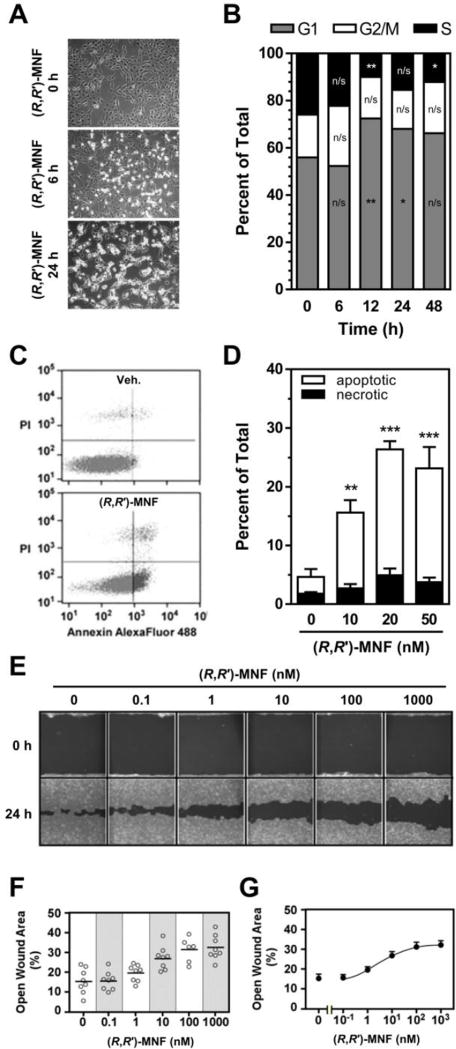
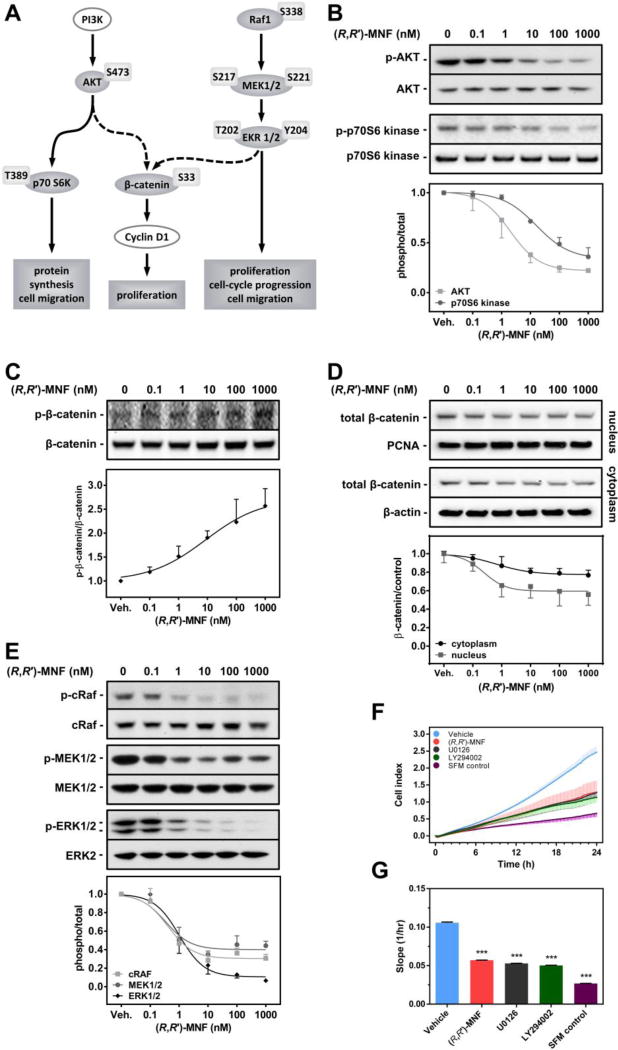
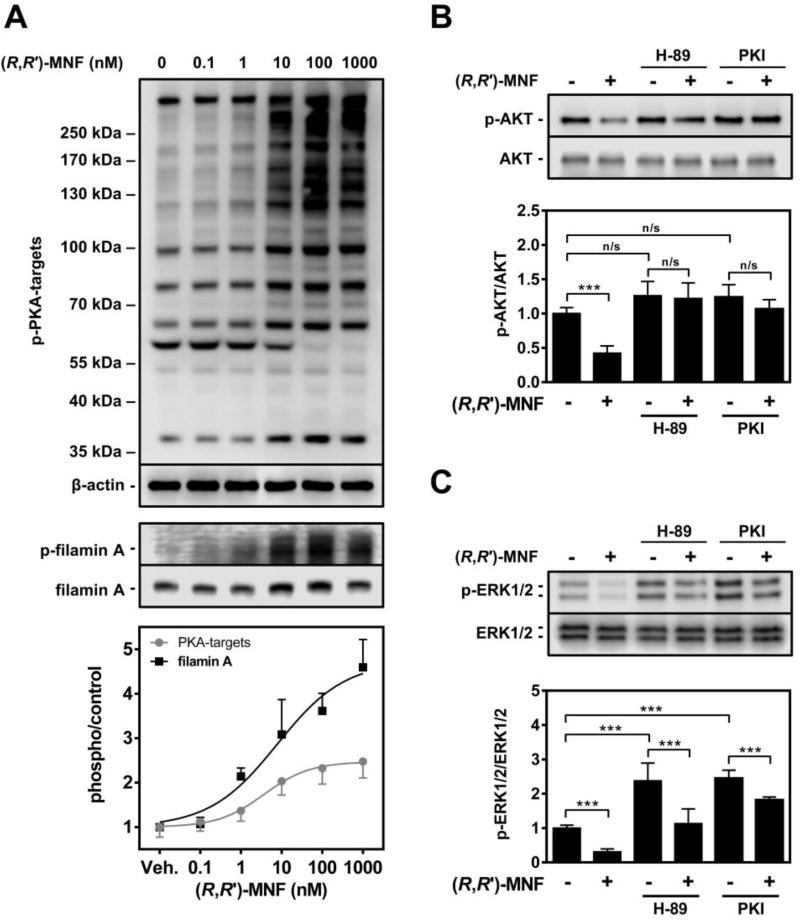
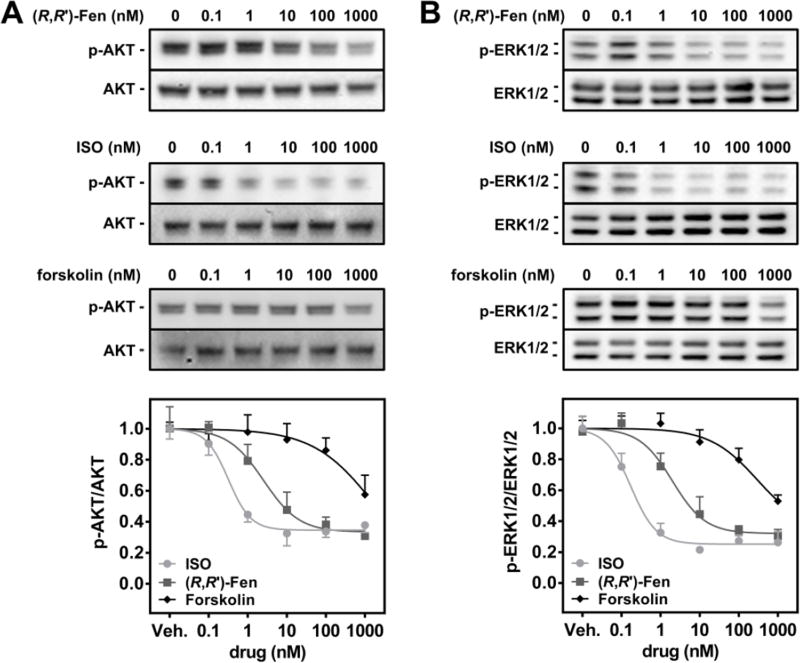
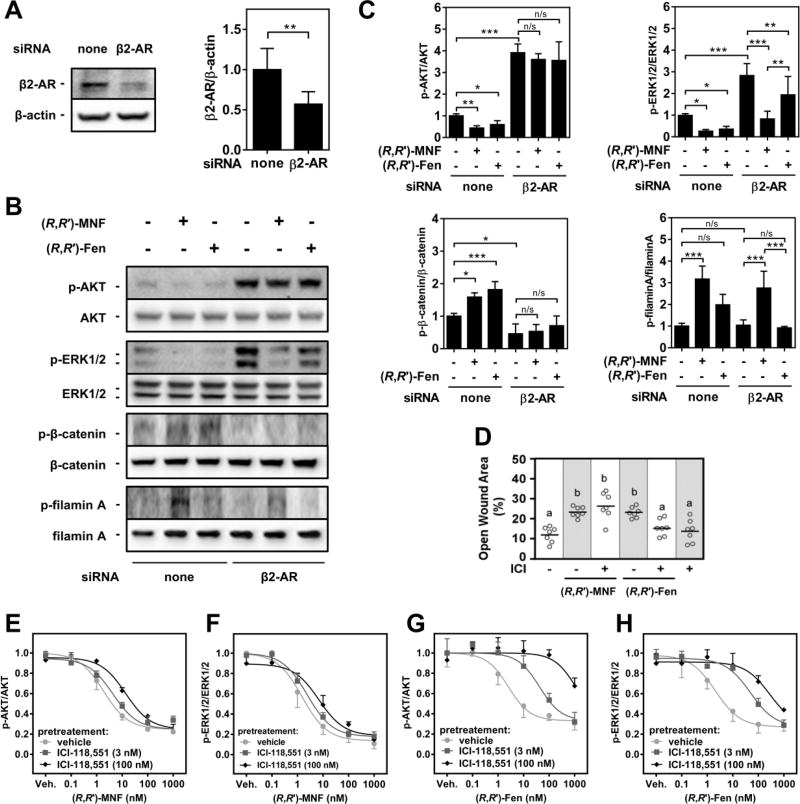
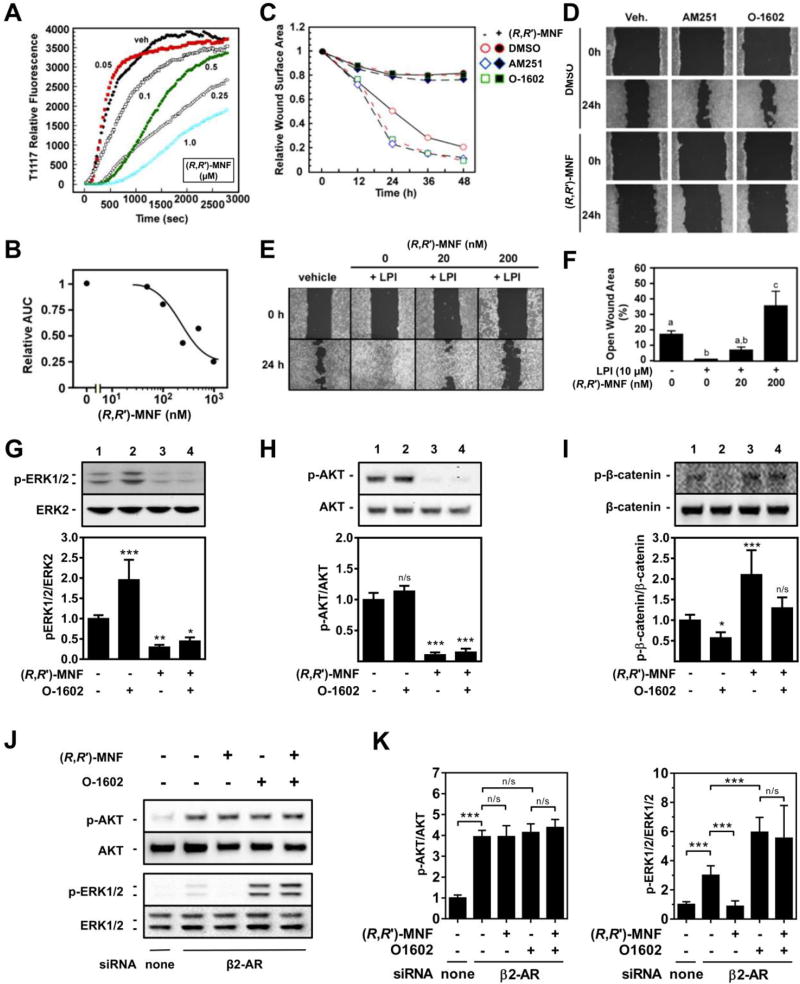
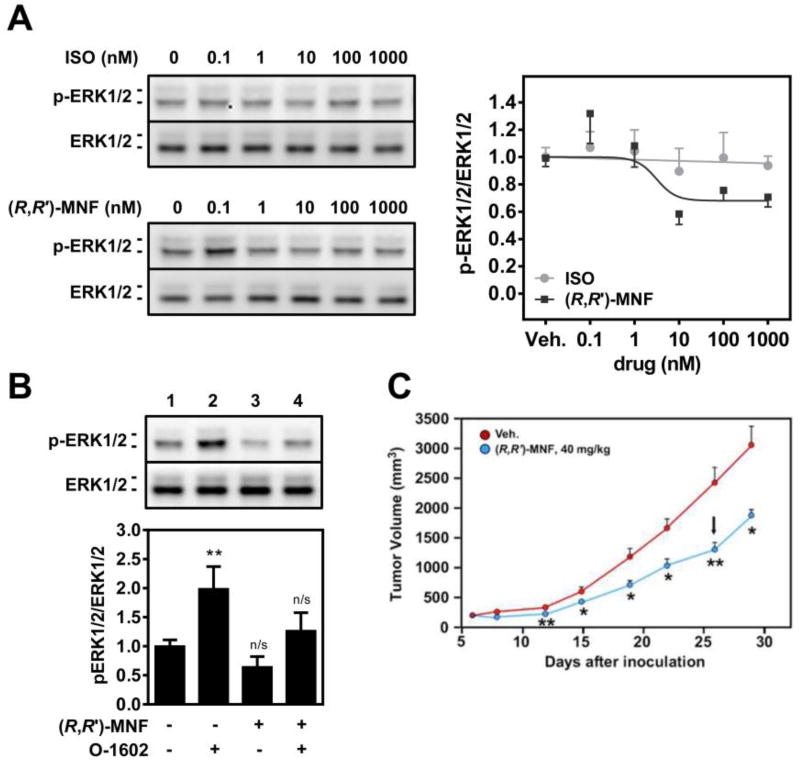
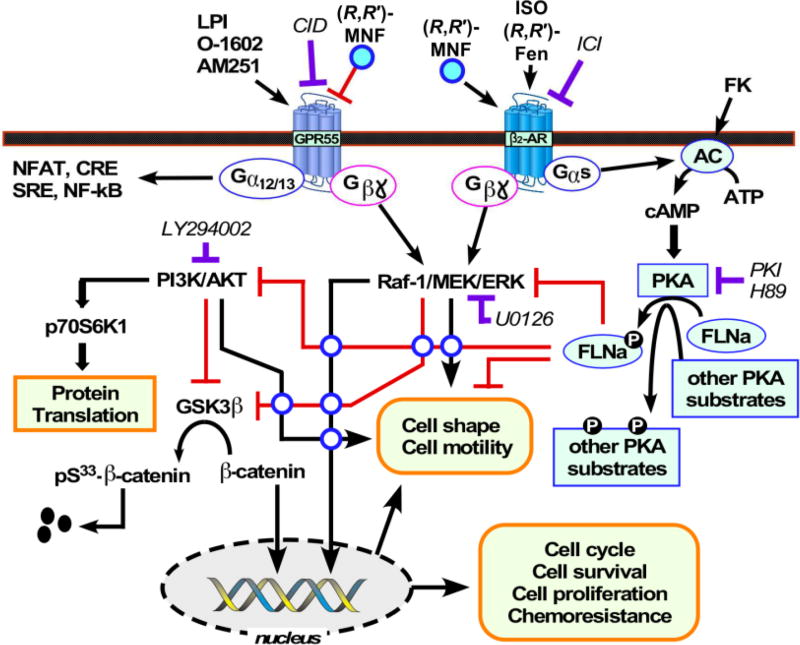
Activation of β2-adrenergic receptor (β2AR) and deorphanized GPR55 has been shown to modulate cancer growth in diverse tumor types in vitro and in xenograft models in vivo. (R,R')-4'-methoxy-1-naphthylfenoterol [(R,R')-MNF] is a bivalent compound that agonizes β2AR but inhibits GPR55-mediated pro-oncogenic responses. Here, we investigated the molecular mechanisms underlying the anti-tumorigenic effects of concurrent β2AR activation and GPR55 blockade in C6 glioma cells using (R,R')-MNF as a marker ligand. Our data show that (R,R')-MNF elicited G1-phase cell cycle arrest and apoptosis, reduced serum-inducible cell motility, promoted the phosphorylation of PKA target proteins, and inhibited constitutive activation of ERK and AKT in the low nanomolar range, whereas high nanomolar levels of (R,R')-MNF were required to block GPR55-mediated cell motility. siRNA knockdown and pharmacological inhibition of β2AR activity were accompanied by significant upregulation of AKT and ERK phosphorylation, and selective alteration in (R,R')-MNF responsiveness. The effects of agonist stimulation of GPR55 on various readouts, including cell motility assays, were suppressed by (R,R')-MNF. Lastly, a significant increase in phosphorylation-mediated inactivation of β-catenin occurred with (R,R')-MNF, and we provided new evidence of (R,R')-MNF-mediated inhibition of oncogenic β-catenin signaling in a C6 xenograft tumor model. Thus, simultaneous activation of β2AR and blockade of GPR55 may represent a novel therapeutic approach to combat the progression of glioblastoma cancer.

Keywords: Bivalent ligand; Brain cancer; Cannabinoid receptor; Fenoterol derivative; Invasiveness.


Conflict of interest statement

Disclosure of Potential Conflicts of Interest

Drs. Bernier and Wainer are listed as co-inventors on a patent for the use of fenoterol and fenoterol analogues, including (R,R′)-MNF, in the treatment of glioblastomas and astrocytomas (US20130005799 A1). Drs. Paul, Bernier and Wainer are listed as co-inventors on a patent for the use of fenoterol analogues for regulating cannabinoid receptor activity-related disorders and diseases (WO2013177418 A1). Drs. Paul, Bernier and Wainer have assigned theirs rights in the patents to the U.S. government but will receive a percentage of any royalties that may be received by the government. Dr. Wainer is currently Chief Scientific Officer at Mitchell Woods Pharmaceuticals, which has licensed the use of (R,R′)-MNF from the U.S. government for use in the treatment of pancreatic, brain and liver cancers.

Figures

Figure 1
Figure 1
(R,R′)-MNF alters cell cycle, promotes apoptosis, and inhibits motility in C6 cells. A, Distinct changes in cell morphology after treatment with 20 nM (R,R′)-MNF for 6 and 24 h. B, C6 cells were harvested after 6, 12, 24, and 48 h treatment with 20 nM (R,R′)-MNF in serum-free medium. Cells were fixed, stained, and then analyzed for DNA content using flow cytometry. DNA content analysis in various phases of the cell cycle in function of (R,R′)-MNF treatment time is shown (n = 3). The two-way ANOVA and Dunnett’s test were used to detect significant time-dependent changes in cell cycle of (R,R′)-MNF-treated cells. *, P < 0.05; **, P < 0.01; n/s, not significant; all vs. 0 h time-point. C, C6 cells were treated with vehicle (0.1% DMSO) or (R,R′)-MNF (10, 20 and 50 nM) in serum-free medium for 24 h, stained with Annexin V and propidium iodide (PI), and then analyzed by flow cytometry. Representative profiles are shown for vehicle and 20 nM (R,R′)-MNF. D, The fractions of apoptotic and necrotic were quantitated. Values from three independent experiments performed in duplicate dishes were plotted. Two-way ANOVA followed by Dunnett’s post-hoc test was used to statistically evaluate the extent of apoptosis and necrosis in controls vs (R,R′)-MNF-treated cells. There were no statistically significant differences in necrosis level. Asterisk symbols mark the differences in the extent of apoptosis: **, P < 0.01; ***, P < 0.001. E, Confluent C6 cells were subjected to scratch wound and incubated in the presence of vehicle (0.1% DMSO) or various concentrations of (R,R′)-MNF (0.1 – 1000 nM) in medium supplemented with 2% FBS for 12 h The same treatment was repeated for an additional 12 h, after which images were captured. F, The relative wound surface area of six to eight independent observations was measured and illustrated as scatter plot. G, Data represent the means ± SEM (n = 6 – 8) and expressed as percent of open wound area. Dose-response curve was generated by fitting the experimental data to four-parameter sigmoidal equation.
Figure 2
Figure 2
(R,R′)-MNF inhibits the PI3K/AKT and cRaf/MEK/ERK signaling pathways in C6 cells. A, Schematic representation of AKT and ERK signal transduction pathways. Pointed arrows indicate positive regulation. Solid lines indicate direct regulation whereas dotted lines mark multistep regulation. Proteins, together with their respective phospho-residues, investigated in this study are depicted as filled ovals. B, Serum-starved C6 cells were incubated with vehicle (0.1% DMSO) or the indicated concentrations of (R,R′)-MNF (0.1 – 1000 nM) for 15 min, and cell lysates were prepared and separated by SDS-PAGE under reducing conditions. Western blotting was carried out with antibodies against phospho- and total-AKT (top blots), and phospho- and total-p70S6 kinase (bottom blots). Densitometric quantitation of the blots was performed and values were plotted (bottom panel). C, The same lysates were probed for phospho- and total β-catenin expression. D, Serum-depleted C6 cells were treated with (R,R′)-MNF (0.1 – 1000 nM) or vehicle (DMSO, 0.1%) for 6 h. Nuclear and cytoplasmic compartments were assessed for β-catenin expression upon cell fractionation by immunoblotting (top panel). Values from four independent experiments were normalized to PCNA or β-actin expression and plotted (bottom panel). E, Serum-starved C6 cells were incubated with vehicle (0.1% DMSO) or the indicated concentrations of (R,R′)-MNF (0.1 – 1000 nM) for 15 min, and then lysed. Clarified lysates were tested for phospho-cRaf and total-cRaf (top blots), phosphorylated and total forms of MEK1/2 (middle blots), and phospho-ERK1/2 and total-ERK2 (bottom blots). Densitometric quantitation of the blots was performed and plotted (bottom panel). Bars represent means ± SD from 3 independent experiments. F, C6 cells were serum-starved for 20 h, treated with (R,R′)-MNF (20 nM), LY294002 (10 µM), U0126 (10 µM) or vehicle (DMSO, 0.1%), and allowed to migrate for 24 h via microporous PET membrane towards 5% serum. Serum-free media (SFM) was used as a negative control for the migration. Cell index, value describing the rate of migration, was plotted over time. G, Slope of the migration curves was calculated, providing the information on migration rate of the cells treated with the compounds of interest. One-way ANOVA followed by the Dunnett’s post-hoc test was used to statistically evaluate the results. ***, P < 0.001. The color version of the figure is available in the online version of the manuscript.
Figure 3
Figure 3
(R,R′)-MNF acts through PKA activation in C6 cells. A, C6 cells were serum-starved for 3 h and then treated with vehicle (DMSO, 0.1%) or increasing concentrations of (R,R′)-MNF (0.1 – 1000 nM) for 15 min. Clarified cell lysates were resolved by SDS-PAGE followed by immunoblotting using a polyclonal antibody detecting phosphorylated substrates of PKA as a surrogate marker of PKA activity; β-actin was used as loading control (top blots). Using the same lysates, phosphorylation of filamin A on Ser2152 residue, a well-established PKA-dependent phosphorylation site, was assessed along with total filamin A (bottom blots). Intensities of all phospho-PKA-target bands and of phospho-filamin A bands were measured, normalized to respective controls and plotted (bottom panel). B and C, Serum-depleted C6 cells were pre-treated with either vehicle (DMSO, 0.1%) or the PKA inhibitors, H-89 (10 µM) and PKI (10 µM), for 20 min followed by the addition of (R,R′)-MNF (20 nM) or vehicle (DMSO, 0.1%) for an additional 15 min. Cell lysates were prepared and analyzed for phospho- and total-AKT (B, top panel) or phospho- and total-ERK1/2 (C, top panel) levels by western blot analysis. Densitometric quantitation of the blots was performed and plotted (B and C, bottom panels). One-way ANOVA followed by Tukey's post-hoc test was used to statistically evaluate the differences between the various treatments. ***, P < 0.001; n/s, not significant.
Figure 4
Figure 4
(R,R′)-Fen, ISO, and forskolin inhibit AKT and ERK activation in C6 cells. A and B, Serum-depleted C6 cells were treated with increasing concentrations (0.1 – 1000 nM) of (R,R′)-Fen, ISO, or forskolin for 15 min. Vehicle (DMSO, 0.1%) was used as control. Cells were lysed and tested for the expression of phospho-AKT and total AKT (A) or phospho- and total-ERK1/2 (B). Representative immunoblots depicting phosphoactive and total forms of AKT and ERK1/2 are depicted (top panels). Dose-response curves were fitted to the data obtained from densitometric quantification of band intensities and subsequently normalized to DMSO-treated controls (bottom panels). Dose-response curves were generated based on 3 independent experiments.
Figure 5
Figure 5
β2AR depletion affects the activity of (R,R′)-MNF in C6 cells. A, C6 cells were transfected with anti-β2AR siRNA for 48 h. Cell lysates were immunoblotted with a specific anti-β2AR antibody using β-actin as a loading control (left panel). Band intensities originating from immunoreactive β2AR were measured, normalized to β-actin and plotted (right panel). **, P < 0.01 using Student’s t-test B, Phosphorylation status of AKT, ERK1/2, β-catenin, and filamin A was assessed in transfected control and β2AR-depleted cells subjected to a 3-h serum starvation period and subsequent treatment with either (R,R′)-MNF (10 nM), (R,R′)-Fen (10 nM) or vehicle (0.1% DMSO) for 15 min. C, Bands intensities from B were measured and plotted as means ± SD from 3 independent experiments. One-way ANOVA followed by Tukey's post-hoc test was used to statistically evaluate the effect of the treatments. ***, P < 0.001; **, P < 0.01; *, P < 0.05. n/s, not significant. D, Confluent C6 cells were subjected to scratch wound and then incubated in medium with 2% FBS in the absence (−) or presence (+) of 100 nM ICI-118,551 alone or in combination with (R,R′)-MNF (20 nM) or (R,R′)-Fen (20 nM) for 12 h. The same treatment was repeated for an additional 12 h. Representative images captured 24 h after the initial treatment are presented in Fig. S4A. The relative wound surface area of seven independent observations was measured and illustrated as scatter plot. Different letters indicate significant differences at P < 0.05. E – H, Serum-starved C6 cells were pretreated with ICI-118,551 (3 or 100 nM) or vehicle (H2O, 0.1%) for 15 min followed by the addition of vehicle (DMSO, 0.1%) or increasing concentrations of (R,R′)-MNF (E and F) or (R,R′)-Fen (G and H) for another 15 min. Cell lysates were immunoblotted for phosphorylated and total forms of AKT (E and G) or phospho- and total-ERK1/2 levels (F and H). Dose-response curves of the phosphorylated/total ratios are depicted. Representative blots are presented in Fig. S4B – S4E.
Figure 6
Figure 6
Functional inhibition of GPR55 in (R,R′)-MNF-treated glioma C6 cells. A, Cellular entry of T1117 was measured on a Zeiss 710 confocal microscope with thermoregulated chamber system for live cell imaging. Serum-depleted C6 cells were pretreated with increasing concentrations of (R,R′)-MNF (50 – 1000 nM) for 30 min followed by the addition of 10 nM T1117. Plots of signal intensity vs. time were generated from defined regions of interest (ROIs). Results are from 2 – 3 independent experiments. The color version of the panel is available in the online version of the manuscript. B, The Areas Under the Curve for T1117 internalization were calculated and plotted in function of (R,R′)-MNF concentrations, with the T1117-AUC value for vehicle-treated cells set at 1.0. C, After the scratch wound, cells in medium supplemented with 2% FBS were treated with either vehicle (0.1% DMSO) or the GPR55 agonists AM251 (1 µM) and O-1602 (1 µM) for 30 min, followed by the addition of equimolar amount of (R,R′)-MNF where indicated. The treatment was repeated 6 h, 12 h and 18 h after the initial stimulation. Images were captured at various time-points (12, 24, 36, and 48 h) and the relative wound surface areas calculated, with the values at ‘time 0’ set at 1.0. The color version of the panel is available in the online version of the manuscript. D, Representative images for times 0 and 24 h are depicted. E, After the scratch wound, cells in medium supplemented with 2% FBS were treated with either vehicle (0.1% DMSO), L-α-lysophosphatidylinositol alone (LPI, 10 µM), or the combination LPI + (R,R′)-MNF (20 and 200 nM) as indicated. (R,R′)-MNF treatment was repeated 12 h after initial treatment. Images were captured 24 h after wound generation. F, Bars represent the means ± SEM of five independent experiments. Different letters indicate significant differences at P < 0.05. G – I, C6 cells were pretreated or not with 20 nM (R,R′)-MNF in serum-free medium for 15 min, followed by the addition of vehicle (DMSO, 0.1%) or the atypical cannabinoid O-1602 (30 µM) for another 15 min. Cells were lysed and immunoblotted for phosphorylated and total forms of ERK (G, upper panels), AKT (H, upper panels), and β-catenin (I, upper panels). Bars represent the means ± SD from two independent experiments, each performed in duplicate dishes. One-way ANOVA followed by Tukey's post-hoc test was used to statistically evaluate the effect of the treatments versus control cells (bottom panels). ***, P < 0.001; **, P < 0.01; *, P < 0.05; n/s, not significant. J, C6 cells were transfected with anti-β2AR siRNA for 48 h. Then, the transfected cells were pretreated or not with (R,R′)-MNF (10 nM, 15 min) followed by the addition of GPR55 agonist O-1602 (30 µM) for 15 min. Cells were lysed and blotted for phosphorylated and total forms of AKT (upper blots) and ERK (bottom blots). K, The bands intensities were measured by volume densitometry. Data from four independent experiments were plotted as mean ± SD and analyzed by one-way ANOVA and Tukey's post-hoc test. ***, P < 0.001; n/s, not significant.
Figure 7
Figure 7
Functional inhibition of GPR55 in (R,R′)-MNF-treated U87MG glioma cells. A, Serum-starved U87MG cells were treated with increasing concentrations of ISO (0.1 – 1000 nM), (R,R′)-MNF (0.1 – 1000 nM) or vehicle (DMSO, 0.1%) for 15 min. Cells were lysed and tested for the expression of phospho-ERK1/2 and total ERK1/2 (top panel). Densitometric quantification is depicted (bottom panel). B, U87MG cells were pretreated or not with 20 nM (R,R′)-MNF in serum-free medium for 15 min, followed by the addition of vehicle (DMSO, 0.1%) or the GPR55 agonist O-1602 (30 µM) for another 15 min. Cells were lysed and immunoblotted for phosphorylated and total forms of ERK1/2 (upper panel). Bars represent the means ± SD from three independent experiments, each performed in duplicate dishes. One-way ANOVA followed by Tukey's post-hoc test was used to statistically evaluate the effect of the treatments versus control cells (bottom panel). **, P < 0.01; n/s, not significant. C, Volume of U87MG xenograft tumors was determined in female Balb/c nude mice after i.p. administration of vehicle (1% hydroxypropyl-β-cyclodextrin) or 40 mg·kg−1 (R,R′)-MNF once daily for 5 days for 3 treatment cycles (n = 10/group). Data represent mean ± SD. The black arrow depicts the last day of (R,R′)-MNF administration. * and **, P < 0.05 and 0.01 vs. vehicle-treated control mice. The color version of the figure is available in the online version of the manuscript.
Figure 8
Figure 8
The bitopic function of (R,R′)-MNF provides a mechanistic link between β2AR and GPR55 signaling in C6 glioma cells. The color version of the figure is available in the online version of the manuscript.

Similar articles

Cited by

References

    1. Korolev KS, Xavier JB, Gore J. Nat Rev Cancer. 2014;14:371–380. - PubMed
    1. Campbell PJ, Pleasance ED, Stephens PJ, Dicks E, Rance R, Goodhead I, Follows GA, Green AR, Futreal PA, Stratton MR. Proc Natl Acad Sci U S A. 2008;105:13081–13086. - PMC - PubMed
    1. Shipitsin M, Campbell LL, Argani P, Weremowicz S, Bloushtain-Qimron N, Yao J, Nikolskaya T, Serebryiskaya T, Beroukhim R, Hu M, Halushka MK, Sukumar S, Parker LM, Anderson KS, Harris LN, Garber JE, Richardson AL, Schnitt SJ, Nikolsky Y, Gelman RS, Polyak K. Cancer Cell. 2007;11:259–273. - PubMed
    1. Vogel CL, Cobleigh MA, Tripathy D, Gutheil JC, Harris LN, Fehrenbacher L, Slamon DJ, Murphy M, Novotny WF, Burchmore M, Shak S, Stewart SJ, Press M. J Clin Oncol. 2002;20:719–726. - PubMed
    1. Druker BJ. Nat Med. 2009;15:1149–1152. - PubMed

Publication types

MeSH terms