. 2017 May 12;356(6338):617-624.
doi: 10.1126/science.aah6152.

Reticulon 3-dependent ER-PM contact sites control EGFR nonclathrin endocytosis

Affiliations

Reticulon 3-dependent ER-PM contact sites control EGFR nonclathrin endocytosis

Giusi Caldieri et al. Science. .

Abstract

The integration of endocytic routes is critical to regulate receptor signaling. A nonclathrin endocytic (NCE) pathway of the epidermal growth factor receptor (EGFR) is activated at high ligand concentrations and targets receptors to degradation, attenuating signaling. Here we performed an unbiased molecular characterization of EGFR-NCE. We identified NCE-specific regulators, including the endoplasmic reticulum (ER)-resident protein reticulon 3 (RTN3) and a specific cargo, CD147. RTN3 was critical for EGFR/CD147-NCE, promoting the creation of plasma membrane (PM)-ER contact sites that were required for the formation and/or maturation of NCE invaginations. Ca2+ release at these sites, triggered by inositol 1,4,5-trisphosphate (IP3)-dependent activation of ER Ca2+ channels, was needed for the completion of EGFR internalization. Thus, we identified a mechanism of EGFR endocytosis that relies on ER-PM contact sites and local Ca2+ signaling.


Figures

Figure 1
Figure 1. Molecular components of EGFR-NCE.
(A) Purification of NCE vesicles. HeLa clathrin KD cells (1) were subjected to a synchronous wave of EGFR internalization (2), and then to subcellular fractionation (3), to obtain the S2 fraction. The S2 fraction was subjected to a PM depletion step with anti-EGFR (against the extracellular domain) (4), and to immunopurification with anti-phosphoEGFR (5). (B) SILAC-MS analysis; EGF stimulation and vesicle purification were as in (A). (C) Numbers of quantified proteins in three SILAC experiments (2 forward, Fwd; 1 reverse, Rev). Venn diagram: overlap among the identified proteins. (D) SILAC H/L ratios distribution of all proteins confidently quantified (RC>2) in Exp. 2 (other experiments are in File S1, spread-sheet 2). The enriched proteins (top 20%) are in red.
Figure 2
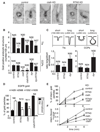
Figure 2. RTN3 and EGFR-NCE.
(A) EGFR-NCE regulators are shown. EGFR internalization is expressed as the reduction in the Ke vs. control (measured at high EGF, by 125I-EGF internalization assays). Clathrin and dynamin, controls. (B) Internalization constants at low and high EGF doses upon the indicated KDs. Here and in the other panels, data are the mean ± SD and P-values were calculated using Each Pair Student’s t test. P-values are for RTN3 or RTN4 vs. control; RTN3/clath or RTN4/clath vs. clath; ***, P <0.001; *, <0.05; ns, non-significant. (C) Internalization of Alexa555-EGF (red) 8 min after stimulation, in the indicated conditions. Bar, 10 µm. Blue, DAPI. (D) Ke of 125I-Tf internalization in the indicated conditions. Data are the mean ± SD. (E) Top, EGFR degradation (EGF, 100 ng/ml). Bottom, densitometric quantification, expressed as the percentage of EGFR levels relative to the initial amount. (F) Quantitative 125I-EGF degradation assay. Data are expressed as percentage of degraded EGF. *, P <0.05, **, <0.01, ***, <0.001 (vs. control). (G) Analysis of EGF-dependent signaling in the indicated conditions (EGF, 100 ng/ml).
Figure 3
Figure 3. Characterization of EGFR-NCE by EM.
(A) Representative EGFR endocytic structures, upon high EGF. Bar 100 nm. (B) Quantitation of gold-EGFR positive TIs and CCPs (5 minutes of high EGF). Only RuR-stained structures were counted. N, cell profiles analyzed. Data are expressed as the number of gold-positive structures, normalized to PM profiles of 100 µm length, ± SEM. Here and in the other panels, P-values were calculated using One-way ANOVA. *, P <.05, **, <0.01, ***, <0.001 (vs. control). (C) Morphometric analysis of the length of EGFR gold-positive TIs and CCPs (top). Data (bottom) are expressed as the ratio between the number of long/short structures normalized to PM profiles of 100 µm length ± SEM. N, cell profiles analyzed. *, P <.05, **, <0.01 (vs. control). (D) Quantitation of PM vs. internalized EGFR (gold-labeled) upon high dose EGF (5 min). Data are the mean ± SEM. N and n, cell profiles and gold particles, respectively. ***, P <.001, RTN3 KD or clath KD vs. control, RTN3+clath KD vs. clath KD (or RTN3 KD). (E) Percentage of internalized gold particles as a function of time of EGF stimulation. (F) 125I-EGF internalization kinetics at high dose EGF.
Figure 4
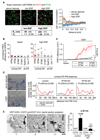
Figure 4. RTN3-mediated contacts at site of EGFR-NCE.
(A) dSTORM of RTN3 (green) and EGFR (red). Left, images of cells in the indicated conditions. Bar, 0.7 µm. Right, cross-correlation between the two channels as a function of distance (29). Bottom left, C0, amplitude of the correlation, proportional to the fraction of co-clustered RTN3/EGFR signals, and RC, spatial extent of the cross-correlation curve, which is an estimate of co-cluster size. 95% confidence intervals (CI) are in parenthesis. (B) Sensitized Emission FRET analysis (SE-FRET). Shown are the normalized SE-FRET efficiencies of EGFR-EYFP with the indicated ECFP-tagged constructs or cerulean-17 (Cer-17), before (basal, left) and after 5 min stimulation with high dose of Alexa555-EGF (high EGF, right). RTN3 (red), cortical ER-enriched proteins (“cortical ER”, black), non-cortical-enriched ER proteins (“all ER”, grey). P-values were calculated by Two Tailed Student’s t test. **, P <0.01 (EGF-stimulated vs. basal condition). (C) Proximity measurement at the PM. SE-FRET as in (B) was restricted to PM regions where EGFR is activated, and to 3 min of EGF stimulation. P-values were calculated by One-way ANOVA. (D) Left, representative EM images showing distribution of juxta-PM ER profiles. Blue, general ER profiles; arrows indicate ER profiles <20 nm from the PM. Bar, 1 µm. Right, number of ER profiles at various distances from the PM in 20 random images/condition ± EGF stimulation. P-value for EGF-stimulated vs. unstimulated cells (Mann-Whitney Test). (E) Left, representative serial sections showing contacts (≤20 nm) between ER and gold-EGFR-positive structures. Arrows indicate the same structure across sections. Bar, 100 nm. Right, mean frequency of ER proximity with gold EGFR-labeled CCPs or TIs at 5 min of EGF stimulation, expressed as percentage ± SEM. The number of counted structures in contact with the ER is indicated (distance ≤ 20 nm). P-values were calculated by Two Tailed Student’s t test. ***, P <0.001 (vs. control TIs).
Figure 5
Figure 5. RTN3-dependent CD147 internalization.
(A) CD147 (green) internalization at 8 min of Alexa555-EGF. Prior fixation, cells were acid-wash treated (to eliminate PM-EGF/CD147) or untreated. Bars, 10 µm. Blue, DAPI. (B) Time course of CD147 internalization after EGF addition. Mean integrated fluorescence intensity ±SD is reported (a.u., arbitrary units). P-values were calculated by Each Pair Student’s t test. *, P<0.05 (RTN3 vs. control). (C) Rescue of CD147 internalization in RTN3 KD cells upon expression of RNAi-resistant RTN3-Isoform A (Fig. S8A,B). Top, quantitation as in panel (B). Integrated fluorescence intensity was reported as % of each control line ± SD. P-values were calculated by Two Tailed Student’s t test. ***, P <0.001. Bottom, RTN3 endogenous and exogenous levels (arrows) were analyzed by IB. This panel was assembled from samples run on the same gel by splicing out the irrelevant lanes. (D) Top, EM representative images of CD147-positive structures in high EGF-stimulated cells (5 min). Bar, 100 nm. Bottom, quantitation of RuR-stained gold-CD147-positive TIs. N, cell profiles analyzed. Data are expressed as the number of gold-positive structures/PM profiles of 100 µm length ± SEM. P-values were calculated by Two-tailed Student’s t test. *, P <0.05; ***, <0.001 (vs. control). (E) Quantitation of gold-CD147 ± SEM in control and RTN3 KD cells. P-values were calculated by One-way ANOVA. *, P <0.05; **, <0.01; ***, <0.001 (RTN3 KD vs. control). (F) Left, representative contact sites between ER and gold-CD147-labeled structures. Bar, 100 nm. Right, mean frequency of the proximity between ER and CD147-positive structures upon high EGF dose. Data are expressed as percentage ± SEM. **, P <0.01 (One-way ANOVA, control 2 min or 5 min vs. control 0 min; Two-tailed Student’s t test, RTN3 5 min vs. control 5 min). (G) 3D reconstruction of a CD147-positive (white dots) TI at the PM (green) in contact with the ER (light blue). Bar, 200 nm. Slices of the tomogram are provided on the right (ER pseudocolored in blue). Bar, 100 nm.
Figure 6
Figure 6. RTN3 is required for EGF-induced Ca2+ release at ER-PM contact sites.
(A) Left, measurements of [Ca2+] upon high dose EGF (100 ng/ml), with cytosolic aequorin (cyto-Aeq, grey) or PM-targeted aequorin (PM-Aeq, black). Right, area under the curve (AUC). Here and in panel B, P-values were calculated by Two Tailed Student’s t test. *, P<0.05. (B) Left, measurements of [Ca2+]PM with PM-aeq upon high dose EGF (100 ng/ml). Right, AUC. ***, P<0.001. (C) Left, representative cytosolic Ca2+ response upon high dose EGF in control and RTN3 KD cells, treated or not with xestospongin C (Xesto) and loaded with Fura-2, AM. Ratio of fluorescence at 340/380 nm is reported. Right, AUC. P-values were calculated by One-way ANOVA. ***, P<0.001. (D) Mean frequency of proximity between ER and CD147-positive structures upon high dose EGF for 5 min. n, number of CD147-positive structures analyzed. Percentage ± SEM is reported. Here and in panels E, G and H, P-values were calculated by Two Tailed Student’s t test. (E) Quantitation of gold-CD147-positive TIs at 5 min high dose EGF. Only RuR-stained structures were counted. N, number of cell profiles analyzed. Data are expressed as the number of gold-positive structures/PM profiles of 100 µm length ± SEM. (F) CD147 (green) internalization after 8 min of Alexa555-EGF (red). Bars, 10 µm. Blue, DAPI. (G) Quantitation of CD147 internalization as in Fig. 5B. Integrated fluorescence intensity ± SD. ***, P<0.001. (H) Morphometric analysis of EGFR gold-positive TIs (left) and CCPs (right). Data are expressed as the ratio between the number of long/short structures (defined as in Fig. 3C top) normalized to PM profiles of 100 µm length. N, number of cell profiles analyzed. *, P<0.05. (I) Model for EGFR endocytosis. At high EGF, EGFR is internalized through CME and NCE. NCE is mediated by PM invaginations that require the formation of RTN3-dependent ER contact sites to progress. Once TIs are formed, contacts sites are needed for local Ca2+ release, in turn required for the fission of NCE-TI.

Comment in

References

    1. Kirchhausen T, Owen D, Harrison SC. Molecular structure, function, and dynamics of clathrin-mediated membrane traffic. Cold Spring Harbor perspectives in biology. 2014 May;6:a016725. - PMC - PubMed
    1. Johannes L, Parton RG, Bassereau P, Mayor S. Building endocytic pits without clathrin. Nat Rev Mol Cell Biol. 2015 May;16:311. - PubMed
    1. Boucrot E, et al. Endophilin marks and controls a clathrin-independent endocytic pathway. Nature. 2015 Jan 22;517:460. - PubMed
    1. Sigismund S, et al. Clathrin-independent endocytosis of ubiquitinated cargos. Proceedings of the National Academy of Sciences of the United States of America. 2005 Feb 22;102:2760. - PMC - PubMed
    1. Lund KA, Opresko LK, Starbuck C, Walsh BJ, Wiley HS. Quantitative analysis of the endocytic system involved in hormone-induced receptor internalization. J Biol Chem. 1990 Sep 15;265:15713. - PubMed

Publication types