. 2017 Jun 5;216(6):1623-1639.
doi: 10.1083/jcb.201607096. Epub 2017 May 11.

Congressing kinetochores progressively load Ska complexes to prevent force-dependent detachment

Affiliations

Congressing kinetochores progressively load Ska complexes to prevent force-dependent detachment

Philip Auckland et al. J Cell Biol. .

Abstract

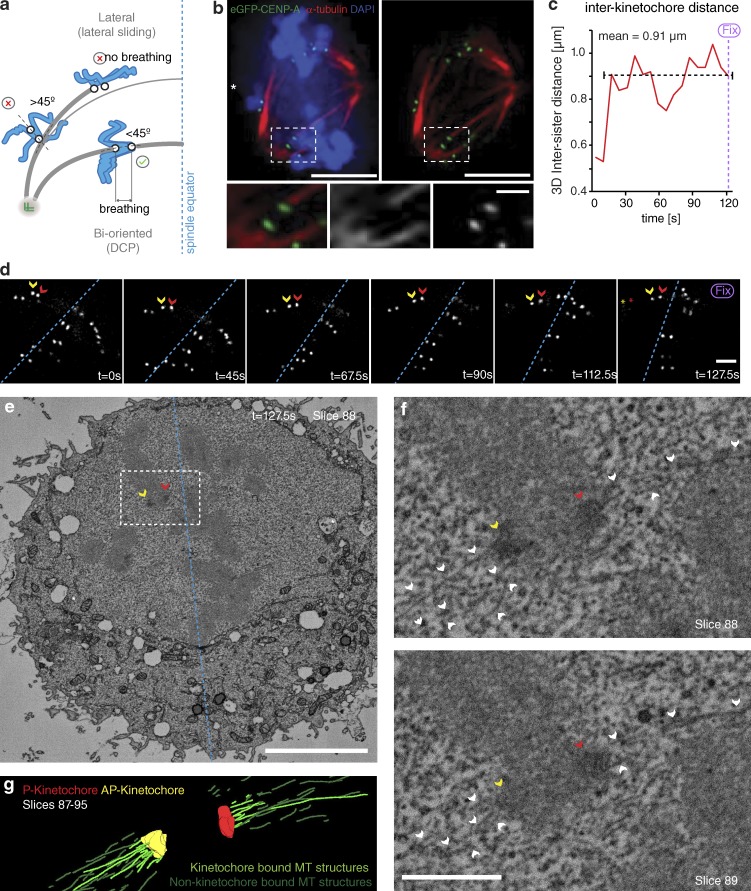
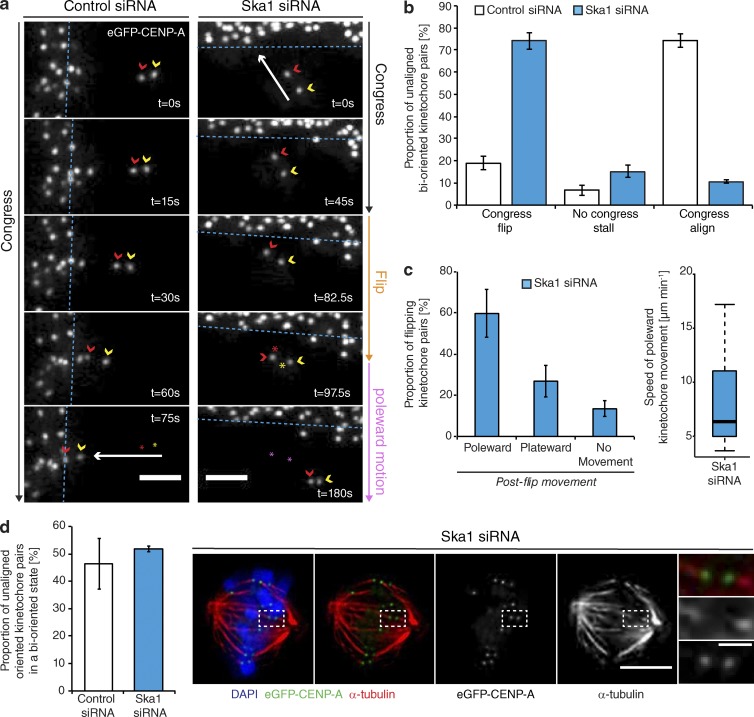
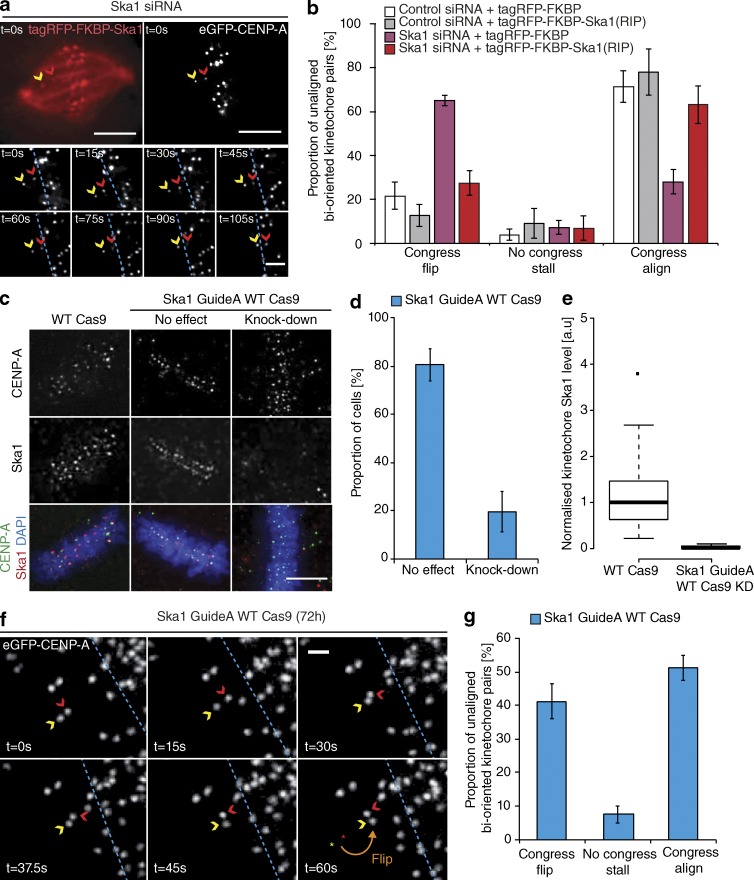
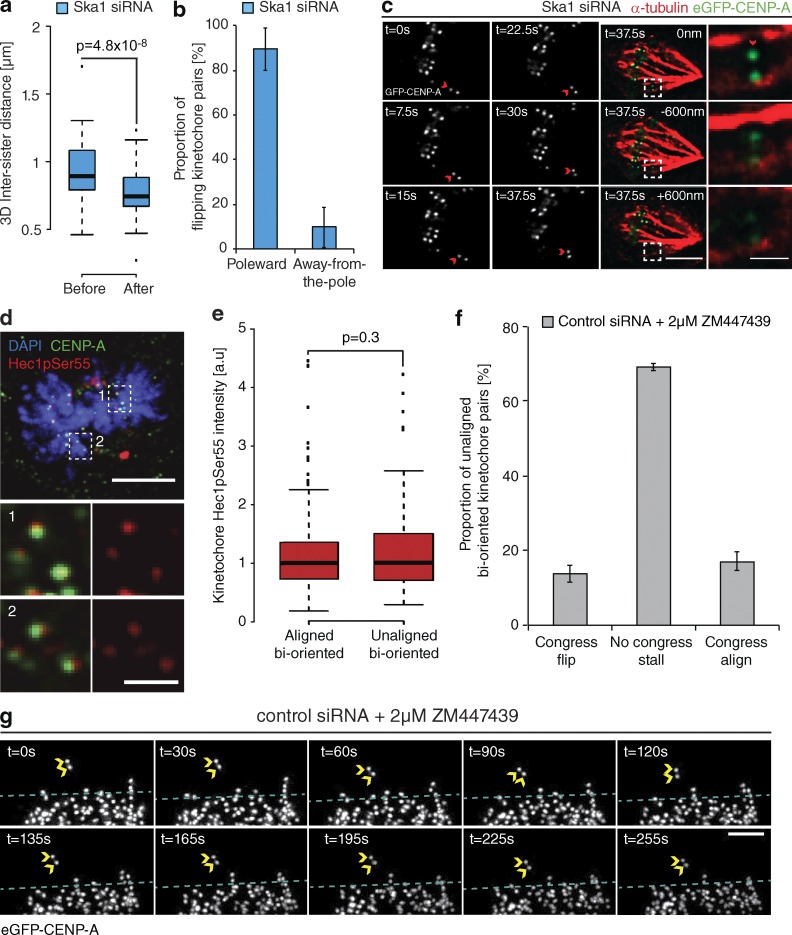
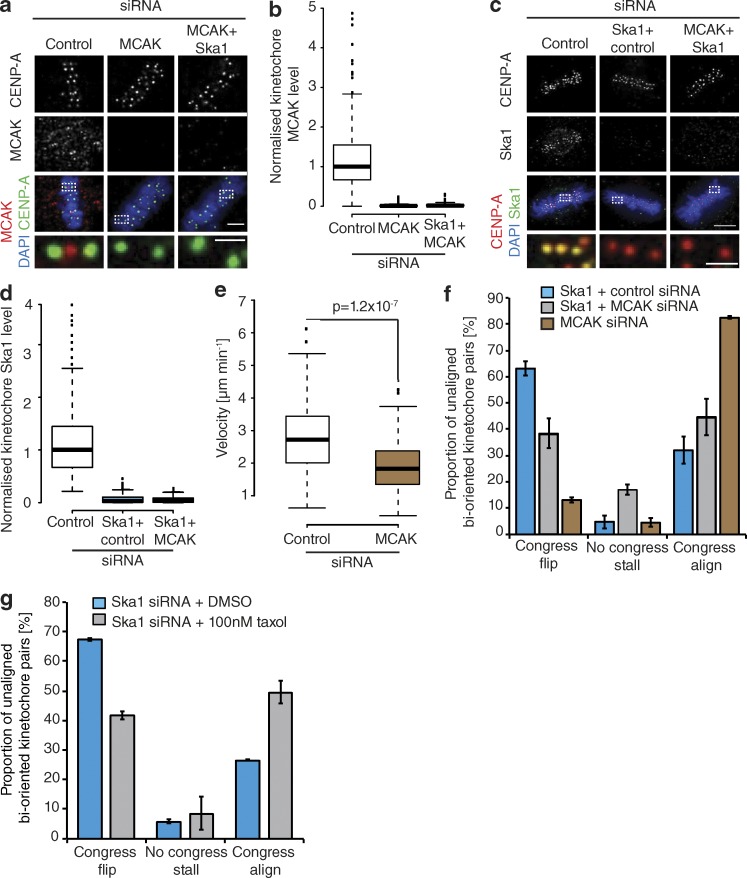
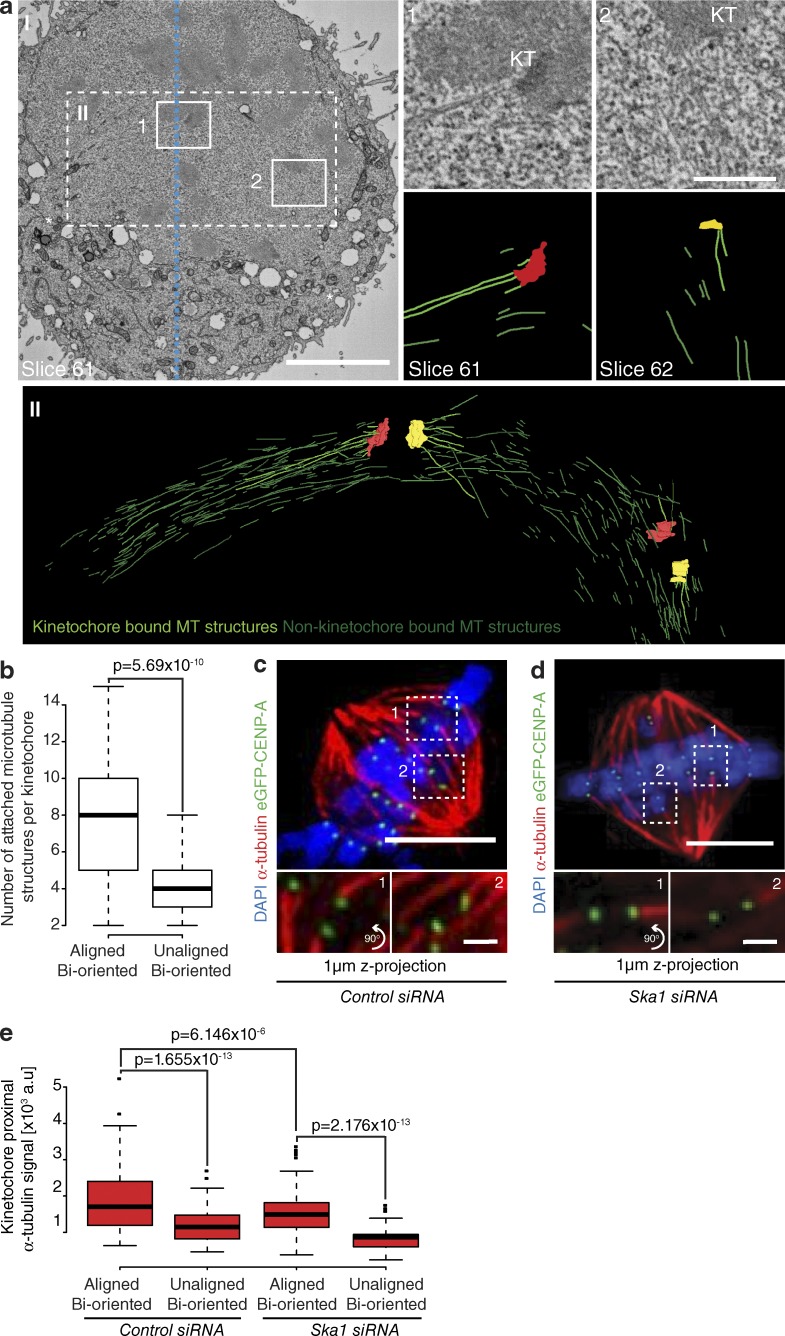
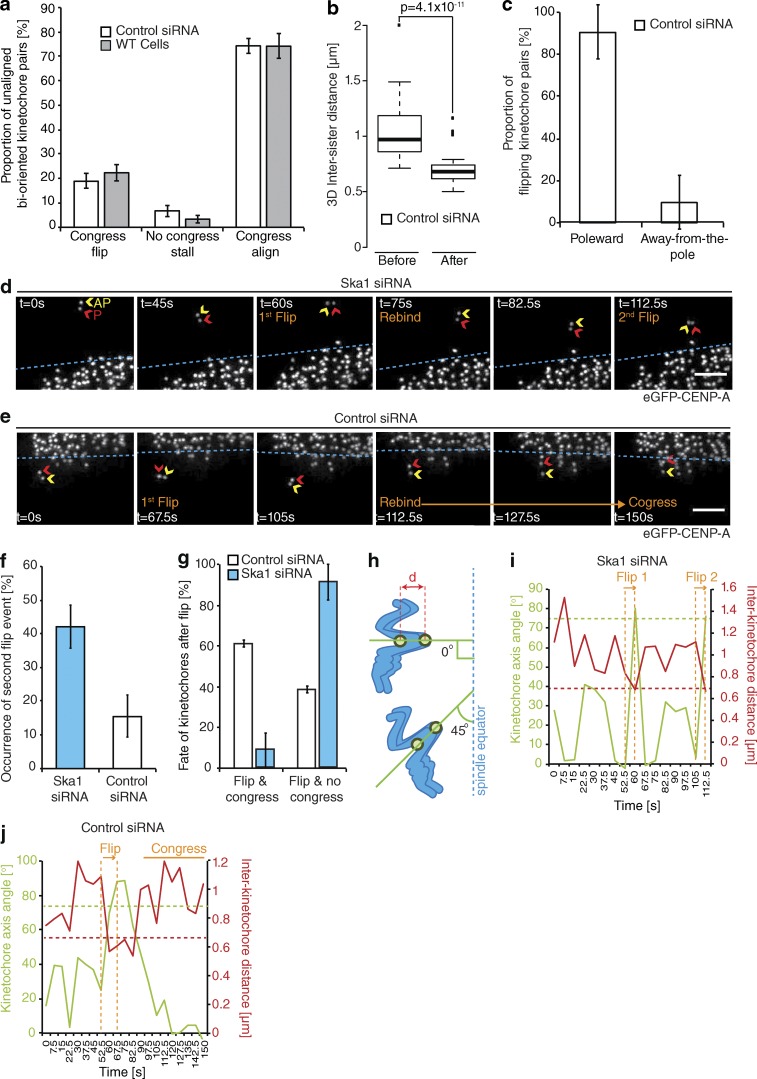
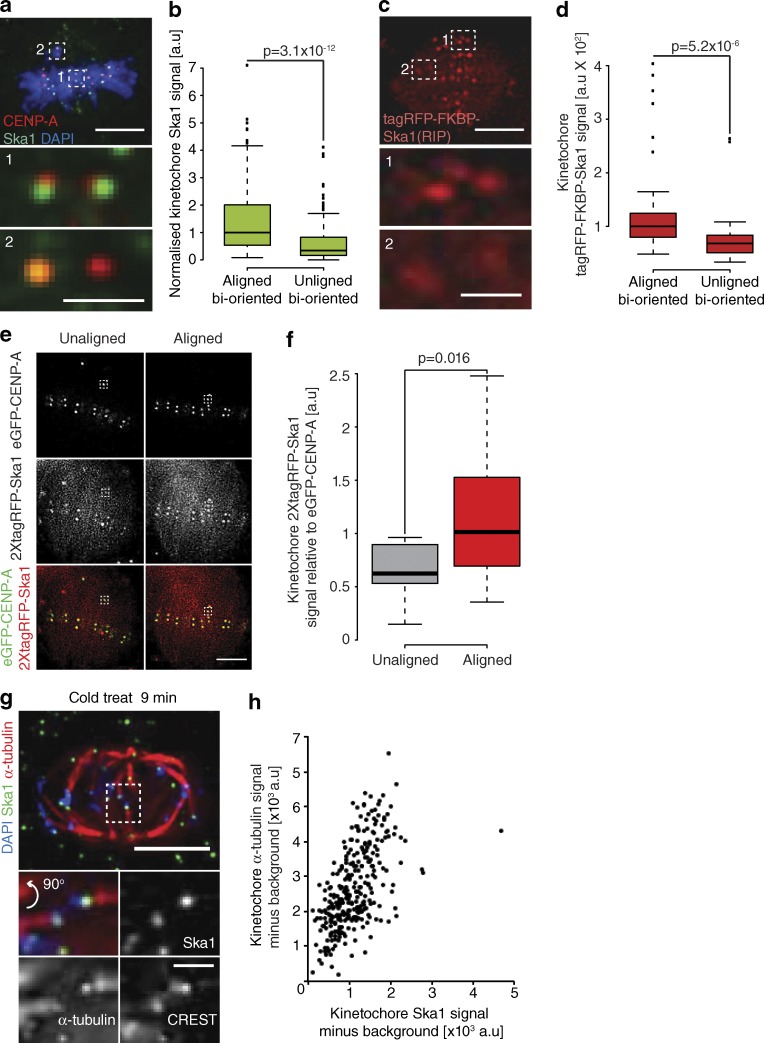
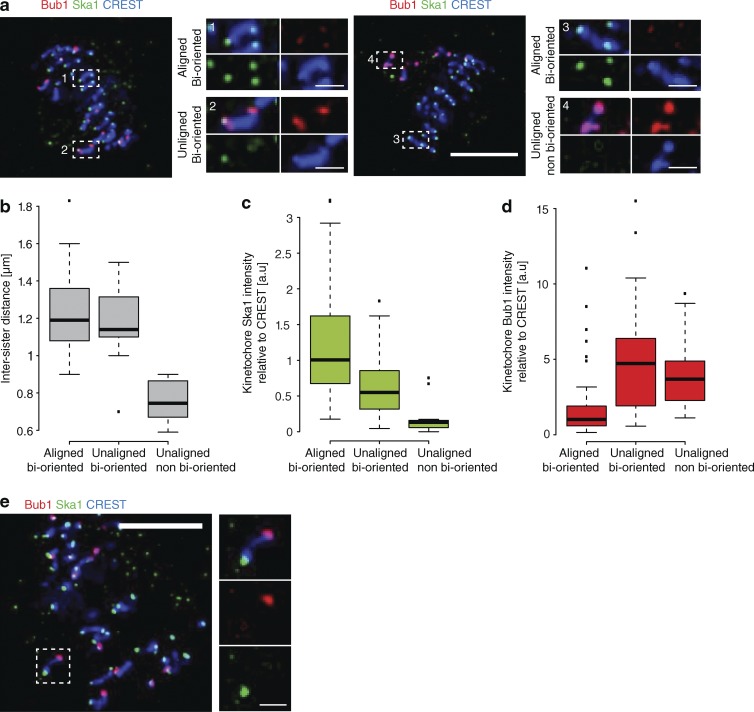
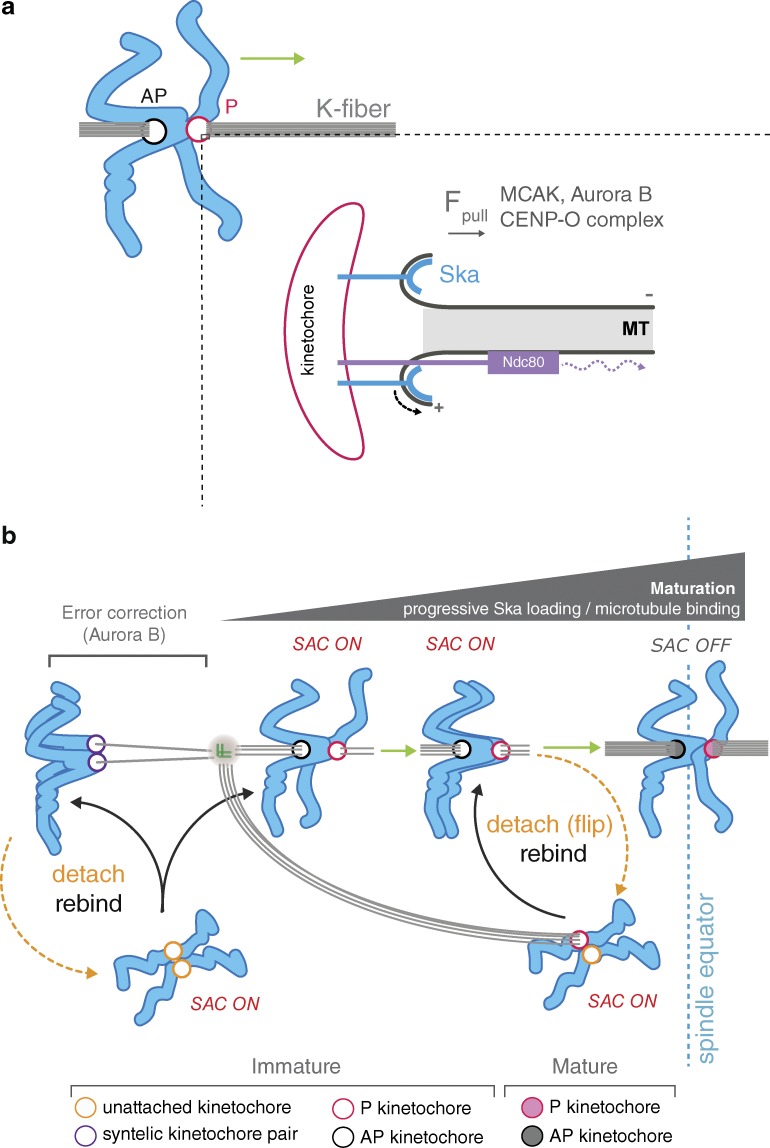
Kinetochores mediate chromosome congression by either sliding along the lattice of spindle microtubules or forming end-on attachments to their depolymerizing plus-ends. By following the fates of individual kinetochores as they congress in live cells, we reveal that the Ska complex is required for a distinct substep of the depolymerization-coupled pulling mechanism. Ska depletion increases the frequency of naturally occurring, force-dependent P kinetochore detachment events, while being dispensable for the initial biorientation and movement of chromosomes. In unperturbed cells, these release events are followed by reattachment and successful congression, whereas in Ska-depleted cells, detached kinetochores remain in a futile reattachment/detachment cycle that prevents congression. We further find that Ska is progressively loaded onto bioriented kinetochore pairs as they congress. We thus propose a model in which kinetochores mature through Ska complex recruitment and that this is required for improved load-bearing capacity and silencing of the spindle assembly checkpoint.


Figures

Figure 1.
Figure 1.
Congressing chromosomes that are oriented and breathing are bioriented. (a) Schematic showing the selection criteria used to sample for kinetochore pairs that are congressing via DCP. (b) Image of a prometaphase HeLa cell expressing eGFP-CENP-A stained with DAPI and an antibody against α-tubulin. Zoom boxes depict an unaligned kinetochore pair that has formed a bioriented attachment. Bars: (top) 5 µm; (bottom) 1 µm. (c) Measurement of 3D intersister distance over time for the congressing kinetochore pair depicted in d, showing that it is undergoing interkinetochore breathing (mean 0.91 µm) after attachment (seen as rise in interkinetochore distance at t = 15 s). (d) Video stills of an eGFP-CENP-A–marked kinetochore-pair congressing to the metaphase plate. The cell was fixed at t = 127.5 s and processed for SBF-SEM. Red and yellow arrows, P and AP kinetochores; red and yellow stars, position of the kinetochore pair at t = 0 s; dotted blue line, metaphase plate periphery. Bar, 1 µm. (e) A single slice (84) from an SBF-SEM stack of the cell displayed in d after fixation at t = 127.5 s. Red and yellow arrows, P and AP kinetochores; dotted blue line, metaphase plate periphery; white asterisks, spindle poles. Bar, 5 µm. (f) Zoom of the white box in d. Here, the congressing kinetochore pair followed in c and d can clearly be seen with end-on microtubule attachment at both sisters, confirming that it is bioriented. White arrows, microtubules; red and yellow arrows, P and AP kinetochores. Bar, 1 µm. (g) Rendered image of slices 87–95 from the SBF-SEM stack of the cell depicted in d–f.
Figure 2.
Figure 2.
The Ska complex is required for the maintenance of biorientation during congression. (a) Example image sequence of a sister kinetochore pair labeled with eGFP-CENP-A congressing to the metaphase plate in a cell treated with control siRNA (left) or initiating congression toward the metaphase plate in a Ska1-depleted cell, but then rotating through 90° relative to the spindle axis (flipping; right). Red and yellow arrows, P and AP kinetochores; red and yellow stars, position of the kinetochore pair at t = 0 (control) and preflip (Ska1 siRNA); pink stars, postflip position of the Ska1-depleted kinetochore pair; dotted blue line, metaphase plate periphery. Bar, 2 µm. (b) Quantification of unaligned bioriented kinetochore-pair behavior in eGFP-CENP-A–expressing cells treated with control or Ska1 siRNA. Error bars ± SD; n (control) = 157 KT from 90 cells; n (Ska1) = 114 KT from 67 cells. (c, left) Quantification of postflip kinetochore behavior in cells treated with Ska1 siRNA. Error bars ± SD, n = 114 KT from 67 cells. (right) Quantification of postflip kinetochore P-movement velocity in cells treated with Ska1 siRNA. (d, left) Proportion of unaligned sister-pairs oriented along their local microtubule path that are bioriented in cells treated with control or Ska1 siRNA. Error bars ± SD; n (control) = 93 KT from 59 cells; n (Ska1) = 138 KT from 82 cells. (right) Images of a prometaphase HeLa cell expressing eGFP-CENP-A depleted of Ska1 and stained with DAPI and an antibody against α-tubulin. Zoom boxes depict an unaligned kinetochore pair that is bioriented. Bars: (left) 5 µm; (right) 1 µm.
Figure 3.
Figure 3.
Confirming the role of Ska in congression. (a) Example image sequence of a congressing bioriented kinetochore pair labeled with eGFP-CENP-A in a cell depleted of Ska1 and subsequently rescued with an siRNA-resistant tagRFP-FKBP-Ska1 transgene. Red and yellow arrows, P and AP kinetochores; dotted blue line, metaphase plate periphery. Bars: (top) 5 µm; (bottom) 1 µm. (b) Quantification of unaligned bioriented kinetochore behavior during the Ska1 siRNA rescue experiment. Error bars ± SD; n (control+tagRFP-FKBP) = 126 KT from 39 cells; n (control+tagRFP-FKBP-Ska1) = 132 KT from 27 cells; n (Ska1+tagRFP-FKBP) = 251 KT from 77 cells; n (Ska1+tagRFP-FKBP-Ska1) = 57 KT from 29 cells. (c) Images of HeLa cells transfected with either an untargeted (WT Cas9) or Ska1-targeted (Ska1 Guide A WT Cas9) CRISPR/Cas9 vector and stained with DAPI and antibodies against Ska1 and CENP-A. Bar, 5 µm. (d) Quantification of cells treated with the Ska1-targeted CRISPR/Cas9 that displayed a knockdown of Ska1 as judged by a reduction in kinetochore staining intensity. Error bars ± SD; n = 200 cells. (e) Quantification of Ska1 staining intensity in the cells transfected with either an untargeted (WT Cas9) or Ska1-targeted (Ska1 Guide A WT Cas9) CRISPR/Cas9 vector that display a knockdown phenotype. n = 200 KT from 20 cells per condition. (f) Example image sequence of a flipping kinetochore pair labeled with eGFP-CENP-A in a cell treated with Ska1 GuideA WT Cas9. Red and yellow arrows, P and AP kinetochores; dotted blue line, metaphase plate periphery. Bar, 1 µm. (g) Quantification of unaligned bioriented kinetochore behavior in cells treated with Ska1 GuideA WTCas9. Error bar ± SD; n = 191 KT from 60 cells.
Figure 4.
Figure 4.
Kinetochore flipping corresponds to lead sister detachment. (a) Quantification of interkinetochore distance before and after the flip event in eGFP-CENP-A cells treated with Ska1 siRNA. Measurements were taken manually from the two time frames before the initiation of a flip and the two after the 90° rotation. n = 47 KT from 39 cells; P-value calculated using two-sample t test. (b) The proportion of flip events that occurred at either the P or AP kinetochore in cells treated with Ska1 siRNA. The flipping kinetochore was identified as the kinetochore that rotated ∼90° around its roughly stationary sister. Error bars ± SD; 39 KT from 37 cells. (c) The lead sister is no longer associated with microtubules after a flip event. Cells expressing eGFP-CENP-A were depleted of Ska1, and an unaligned bioriented kinetochore pair was followed during a flip. Immediately after the 90° rotation was observed, the cell was fixed with glutaraldehyde and microtubules were visualized using an anti–α-tubulin antibody. Insets show the flipped kinetochore in three z-sections. Red arrow indicates the P (flipped) kinetochore. Bars: (left) 3 µm; (right) 1 µm. (d) Image of a prometaphase cell stained with DAPI and antibodies against CENP-A and phosphorylated Hec1S55. Zoom boxes depict the staining intensities at aligned bioriented (1) and unaligned bioriented (2) kinetochore pairs. Bars: (top) 5 µm; (bottom) 1 µm. (e) Quantification of Hec1pS55 staining intensity relative to CENP-A at aligned and unaligned bioriented kinetochore pairs. n = 256 aligned KT and 135 unaligned KT from 26 cells; P-value calculated using two-sample t test. (f) Quantification of unaligned bioriented kinetochore behavior in eGFP-CENP-A cells treated with control siRNA and 2 µM ZM1 for ≥10 min. Error bars ± SD; 123 KT from 29 cells. (g) Video stills of a stalled kinetochore pair in an eGFP-CENP-A cell treated with control siRNA and 2 µM ZM1. Yellow arrows, kinetochore position; dotted blue line, metaphase plate periphery. Bar, 3 µm.
Figure 5.
Figure 5.
Force-dependent release of the leading kinetochore. (a) Images of cells treated with control, MCAK, or Ska1 + MCAK siRNA and stained with antibodies against CENP-A and MCAK. Zoom boxes depict the staining at individual kinetochores. Bars: (top) 5 µm; (bottom) 1 µm. (b) Quantification of MCAK intensities in cells treated with control, MCAK, or Ska1 + MCAK siRNA. n = 200 KT from 20 cells per condition. (c) Left, Images of cells treated with control, Ska1 + control, or MCAK siRNA and stained with antibodies against CENP-A and Ska1. Insets show individual kinetochores. Bars: (top) 5 µm; (bottom) 1 µm. (d) Quantification of Ska1 staining intensities in cells treated with control, Ska1 + control, or Ska1 + MCAK siRNA. n = 200 KT from 20 cells per condition. (e) Quantification of kinetochore speed during congression in eGFP-CENP-A–expressing cells treated with control or MCAK siRNA. Measurements were taken from tracks of persistent movement that lasted at least three time frames. n (MCAK) = 76 KT from 42 cells; n (control) = 75 KT from 53 cells; P-value calculated using two-sample t test. (f) Quantification of unaligned bioriented kinetochore behavior in eGFP-CENP-A–expressing cells treated with Ska1 + control, MCAK, or Ska1 + MCAK siRNA. Error bars ± SD; n (Ska1 + control) = 218 KT from 46 cells; n (Ska1 + MCAK) = 215 KT from 72 cells; n (MCAK) = 323 KT from 99 cells. (g) Quantification of unaligned bioriented kinetochore behavior in cells depleted of Ska1 by siRNA and treated with DMSO or 100 nM taxol for 1 h. Error bars ± SD; n (DMSO) = 132 KT from 35 cells; n (taxol) = 127 KT from 38 cells.
Figure 6.
Figure 6.
Congression is coupled to an increase in microtubule occupancy at kinetochores. (a, I) Single slice from an SBF-SEM image of a prometaphase HeLa cell; boxes show aligned bioriented (1) and unaligned bioriented (2) kinetochore pairs. Zoom boxes display single slices and their associated segmentation. Kinetochore-attached and non–kinetochore-attached microtubule structures are in light green and dark green, respectively. Dotted blue line, metaphase plate center; white asterisks, spindle pole positions. Bars: (left) 5 µm; (right) 1 µm. (II, top) Box depicting the spindle region used to render microtubule attachment at the sister pairs indicated in 1 and 2. (bottom) Z-projection (slices 56–65) of the kinetochore and microtubule model generated from the cell in I. Kinetochore-attached and non–kinetochore-attached microtubule structures are indicated in light green and dark green, respectively. (b) Quantification of microtubule structures terminating at kinetochores in either aligned bioriented or unaligned bioriented state by SBF-SEM. n = 100 aligned KT and 20 unaligned KT from three cells; P-value calculated using two-sample t test. Image of a prometaphase eGFP-CENP-A cell treated with control (c) or Ska1 (d) siRNA and stained with DAPI and anti–α-tubulin. Zoom boxes depict the staining intensities at aligned bioriented (1) and unaligned bioriented (2) kinetochore pairs, respectively. Bars: (top) 5 µm; (bottom) 1 µm. (e) Quantification of kinetochore-proximal α-tubulin signal at aligned bioriented and unaligned bioriented kinetochore pairs in cells treated with either control or Ska1 siRNA. n (control) = 199 aligned KT and 75 unaligned KT from 20 cells; n (Ska1) = 152 aligned KT and 38 unaligned KT from 16 cells; P-value calculated using two-sample t test.
Figure 7.
Figure 7.
Fates of flipped kinetochore pairs. (a) Quantification of unaligned bioriented kinetochore behavior in untreated (WT) eGFP-CENP-A–expressing cells and those treated with control siRNA. Error bars ± SD; n (control) =157 KT from 90 cells; n (WT) = 134 KT from 43 cells. (b) Quantification of interkinetochore distance before and after the flip event in control siRNA-treated cells; measurements were taken as in Fig. 4 a; n = 52 KT from 38 cells; P-value calculated using two-sample t test. (c) Proportion of flip events that occurred at the either P or AP kinetochore in control siRNA-treated cells; measurements were taken as in Fig. 4 b. Error bars ± SD; n = 52 KT from 43 cells. (d) Example image sequence of a Ska1-depleted kinetochore pair undergoing two sequential flip events (t = 60 and 112.5 s) interspersed by a period of reorientation (t = 75–82.5 s). Red and yellow arrows, P and AP kinetochores; dotted blue line, metaphase plate periphery. Bar, 2 µm. (e) Example image sequence of a kinetochore pair undergoing a flip event followed by reorientation and congression. Red and yellow arrows, P and AP kinetochores; dotted blue line, metaphase plate periphery. Bar, 2 µm. (f) Proportion of flipped kinetochore pairs that undergo a second flip event in cells treated with control or Ska1 siRNA. Error bar ± SD; n (control) = 28 KT from 27 cells; n (Ska1) = 78 KT from 59 cells. (g) Quantification of kinetochore pair fate after a flip event in cells treated with control or Ska1 siRNA. Error bar ± SD; n (control) = 28 KT from 27 cells; n (Ska1) = 78 KT from 59 cells. (h) Schematic illustrating the measurement of interkinetochore distance (d) and K–K axis angle (the angle of sister kinetochores [green lines] relative to metaphase plate). K–K axis angle is normalized so that a 90° orientation to the metaphase plate is 0. (i and j) Plot of K–K axis angle and interkinetochore distance during two sequential flip events in the Ska1-depleted kinetochore pair shown in d (i) or during a flip event followed by successful congression in the control siRNA treated kinetochore pair shown in e (j). Dotted green line, kinetochore axis angle of 75°; dotted red line, intersister distance in absence of microtubules (i.e., rest length).
Figure 8.
Figure 8.
Dynamic maturation of the Ska complex during congression. (a) Image of a prometaphase cell stained with DAPI and antibodies against CENP-A and Ska1. Zoom boxes show aligned (1) and unaligned (2) bioriented kinetochore pairs. Bars: (top) 5 µm; (bottom) 1 µm. (b) Quantification of Ska1 staining intensity at aligned and unaligned bioriented kinetochore pairs. n ≥ 157 KT from 37 cells per condition; P-value calculated using two-sample t test. (c) Image of a prometaphase eGFP-CENP-A–expressing cell transfected with tagRFP-FKBP-Ska1 (tagRFP channel is shown). Zoom boxes depict the staining at aligned (1) and unaligned (2) bioriented kinetochore pairs. Bars: (top) 5 µm; (bottom) 1 µm. (d) Quantification of tagRFP-FKBP-Ska1 intensities at aligned and unaligned bioriented kinetochore pairs after background subtraction. n ≥ 53 KT from 15 cells per condition; P-value calculated using two-sample t test. (e) Left, image of a late-prometaphase HeLa cell with a single unaligned kinetochore pair expressing eGFP-CENP-A and transfected with 2×tagRFP-Ska1. Right, image of the same cell after the unaligned kinetochore pair has congressed. Bar, 5 µm. (f) Quantification of 2×tagRFP-Ska1 intensity at single kinetochores when in an unaligned state and after congression. n = 12 KT from 10 cells; P-value calculated using two-sample t test. (g) Image of a cold-treated metaphase cell fixed and stained with DAPI and antibodies against α-tubulin and Ska1. Zoom boxes depict the staining intensities at individual kinetochore pairs. Bars: (top) 5 µm; (bottom) 1 µm. (h) Scatterplot of Ska1 and kinetochore proximal α-tubulin signals at single kinetochores after background subtraction in cold-treated metaphase cells. n = 300 KT from 30 cells.
Figure 9.
Figure 9.
Ska maturation correlates with loss of Bub1 from kinetochores. (a) Images of prometaphase HeLa cells stained with antibodies against Ska1 and Bub1 and CREST antisera. Zoom boxes depict the staining intensities at aligned bioriented (1 and 3), unaligned bioriented (2), and unaligned nonbioriented (4) kinetochore pairs. Bars: (zoom-out) 5 µm; (zoom-in) 1 µm. (b) Quantification of CREST-based intersister distance at the kinetochore pair subgroups shown in a. n = 159 KT from 16 cells. (c) Quantification of Ska1 staining intensity at the kinetochore pair subgroups defined in a. n = 159 KT from 16 cells. (d) Quantification of Bub1 staining intensity at the kinetochore pair subgroups defined in a. n = 159 KT from 16 cells. (e) Images of prometaphase cells stained with antibodies against Ska1 and Bub1 and CREST antisera. Zoom boxes depict an unaligned bioriented kinetochore pair with opposing Ska1/Bub1 loading. Bars: (left) 5 µm; (right) 1 µm.
Figure 10.
Figure 10.
Model for congression via DCP and integration with checkpoint signaling. (a) Schematic depicting the contribution of kinetochore factors to movement (green arrow) of bioriented chromosomes by DCP. Inset shows single microtubule-kinetochore attachment site. The Ska complex attaches to, and tracks with, the curving protofilaments as they peel away from the lattice, thus generating a pulling force. This coupling is essential for the maintenance of P kinetochore attachment when under load. Attachments absolutely require the Ndc80 complex, which may also contribute to force generation by biased diffusion (dotted curved arrow). In addition to these coupling factors, MCAK, Aurora B, and CENP-Q—a subunit of CENP-O complex (Bancroft et al., 2015)—contribute to force generation (Fpull). (b) Model for bioriented kinetochore maturation and attachment regulation during prometaphase. The canonical Aurora B error correction pathway destabilizes erroneous attachments (i.e., syntelic), promoting the formation of bioriented attachments. These unaligned bioriented kinetochore pairs then congress by DCP. During congression, each kinetochore progressively (and autonomously) loads Ska complexes. This increases the load-bearing capacity of the structure, enabling kinetochores to efficiently track the depolymerizing K-fiber microtubules, which are increasing in number and stability. Unaligned bioriented, but immature, kinetochore pairs do not silence the SAC. We propose that maturation is part of a mechanical microtubule attachment self-check: if the kinetochore does not recruit sufficient Ska complex, or microtubule recruitment is too rapid, the kinetochore will detach from its associated K-fiber. As a result, only mature bioriented sister kinetochores reach the metaphase plate and silence the SAC.

Similar articles

Cited by

References

    1. Abad M.A., Medina B., Santamaria A., Zou J., Plasberg-Hill C., Madhumalar A., Jayachandran U., Redli P.M., Rappsilber J., Nigg E.A., and Jeyaprakash A.A.. 2014. Structural basis for microtubule recognition by the human kinetochore Ska complex. Nat. Commun. 5:2964 10.1038/ncomms3964 - DOI - PMC - PubMed
    1. Armond J.W., Vladimirou E., Erent M., McAinsh A.D., and Burroughs N.J.. 2015. Probing microtubule polymerisation state at single kinetochores during metaphase chromosome motion. J. Cell Sci. 128:1991–2001. 10.1242/jcs.168682 - DOI - PMC - PubMed
    1. Auckland P., and McAinsh A.D.. 2015. Building an integrated model of chromosome congression. J. Cell Sci. 128:3363–3374. 10.1242/jcs.169367 - DOI - PubMed
    1. Bakhoum S.F., Thompson S.L., Manning A.L., and Compton D.A.. 2009. Genome stability is ensured by temporal control of kinetochore-microtubule dynamics. Nat. Cell Biol. 11:27–35. 10.1038/ncb1809 - DOI - PMC - PubMed
    1. Bancroft J., Auckland P., Samora C.P., and McAinsh A.D.. 2015. Chromosome congression is promoted by CENP-Q- and CENP-E-dependent pathways. J. Cell Sci. 128:171–184. 10.1242/jcs.163659 - DOI - PMC - PubMed

Publication types

MeSH terms

LinkOut - more resources