. 2017 Jul 7;292(27):11262-11279.
doi: 10.1074/jbc.M117.784959. Epub 2017 May 11.

The uniqueness of subunit α of mycobacterial F-ATP synthases: An evolutionary variant for niche adaptation

Affiliations

The uniqueness of subunit α of mycobacterial F-ATP synthases: An evolutionary variant for niche adaptation

Priya Ragunathan et al. J Biol Chem. .

Abstract

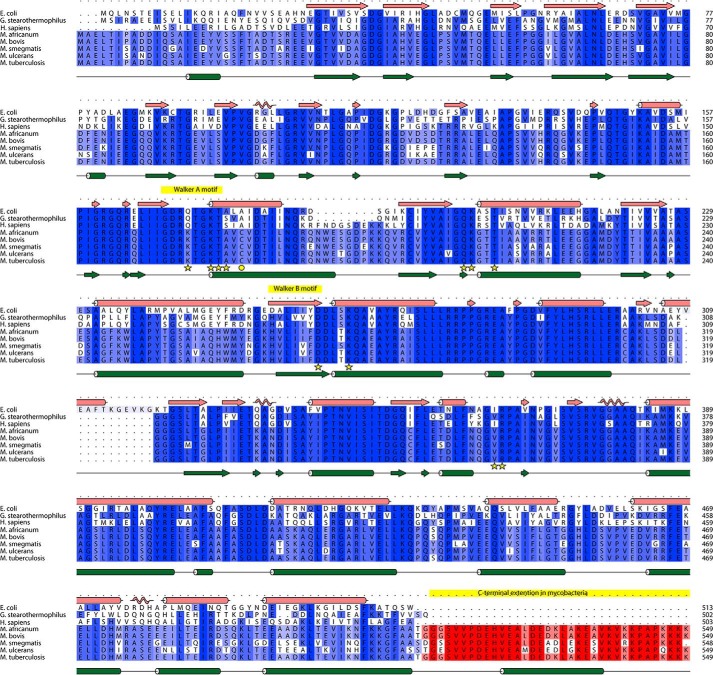
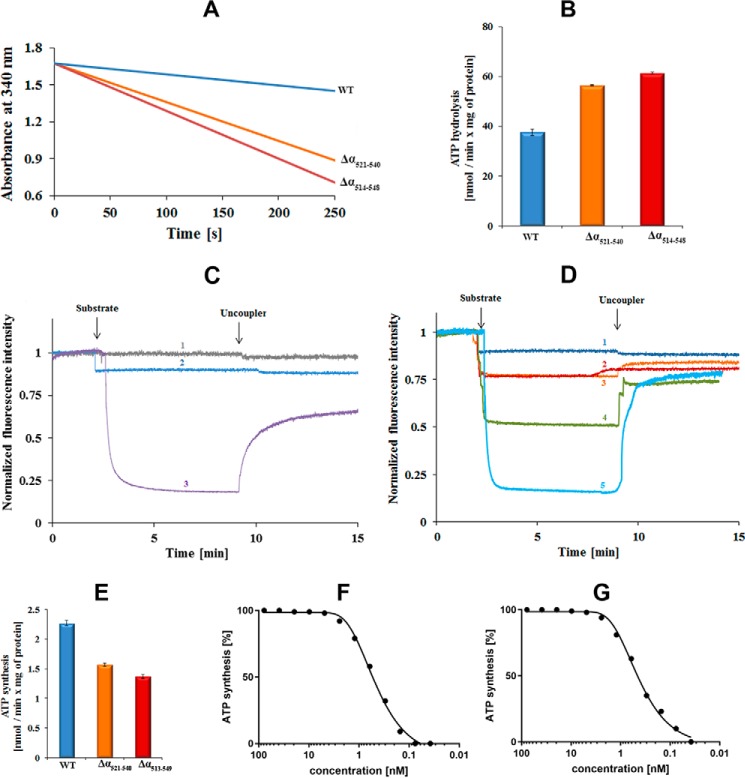
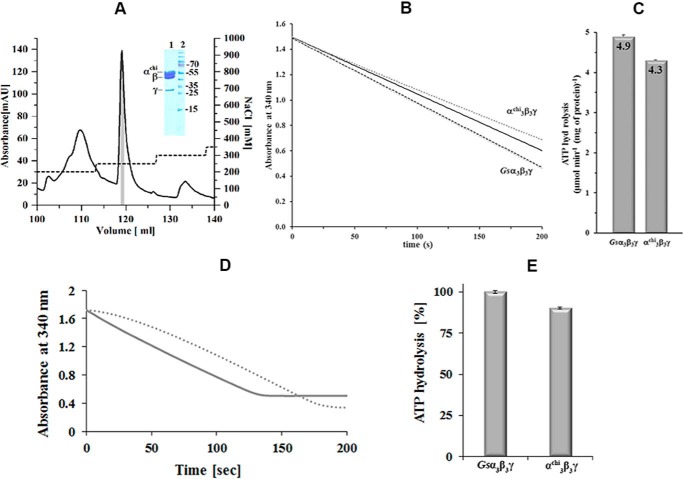
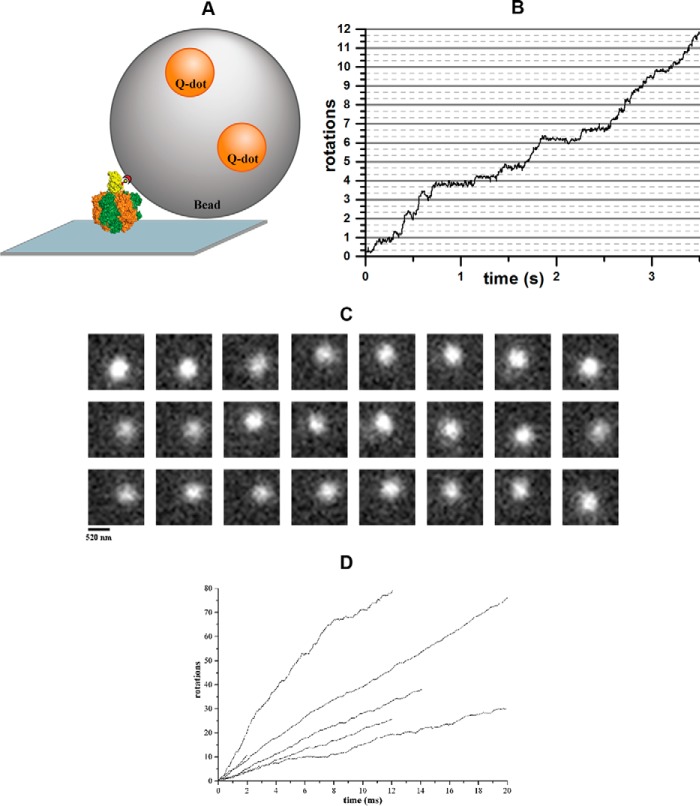
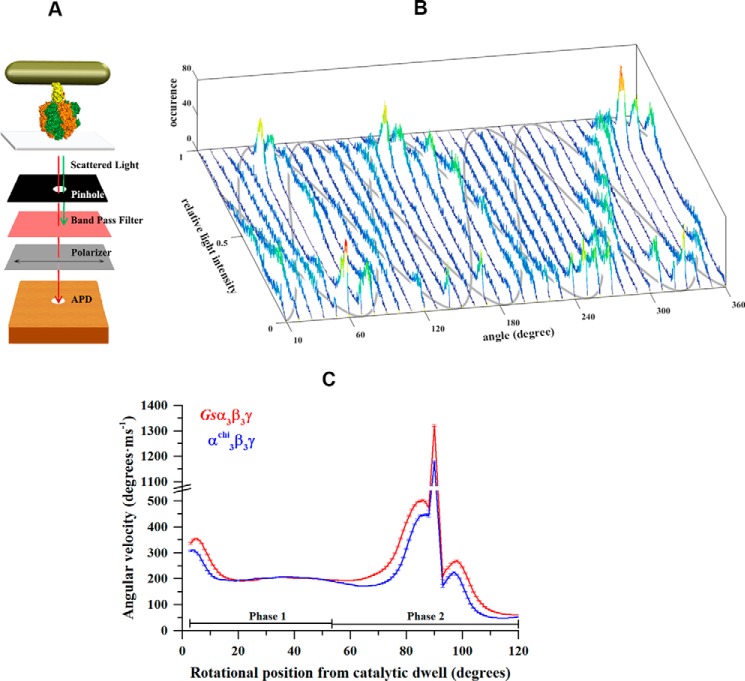
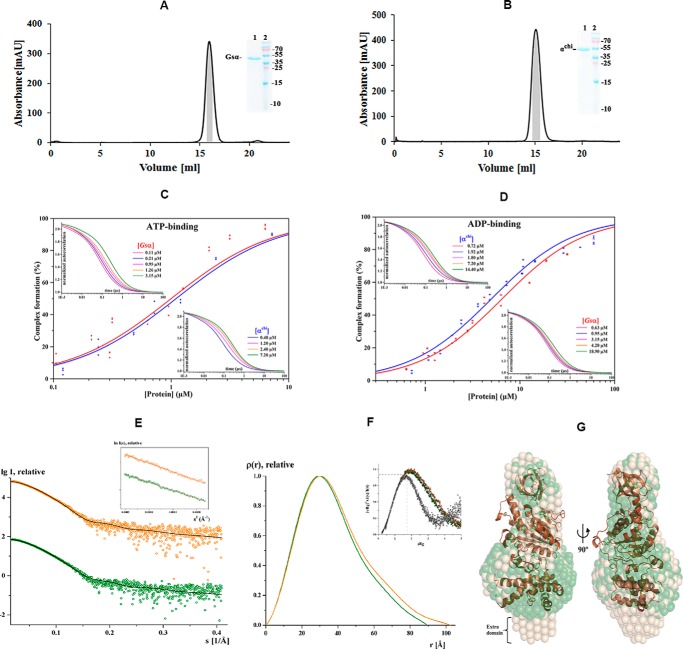
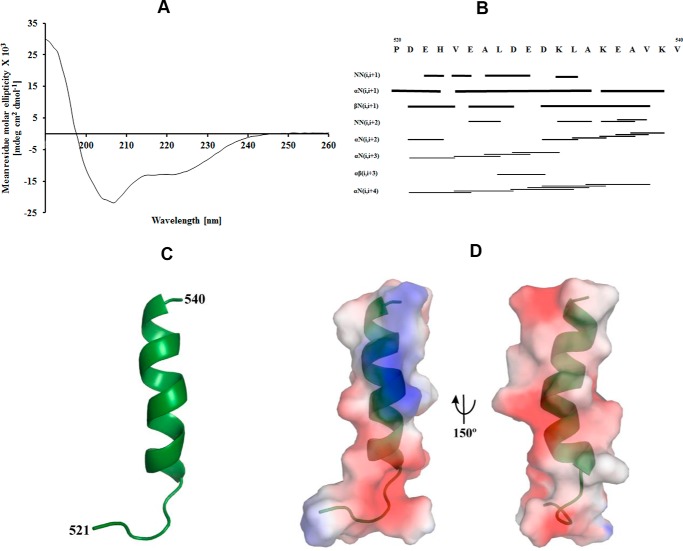
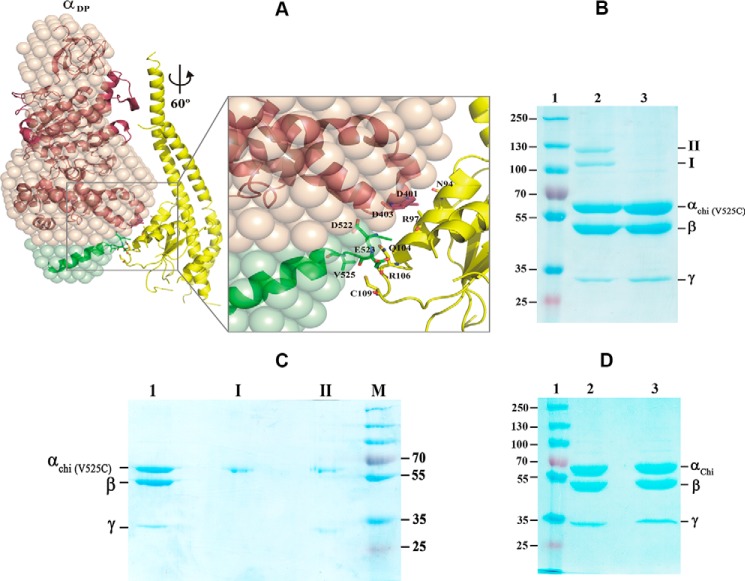
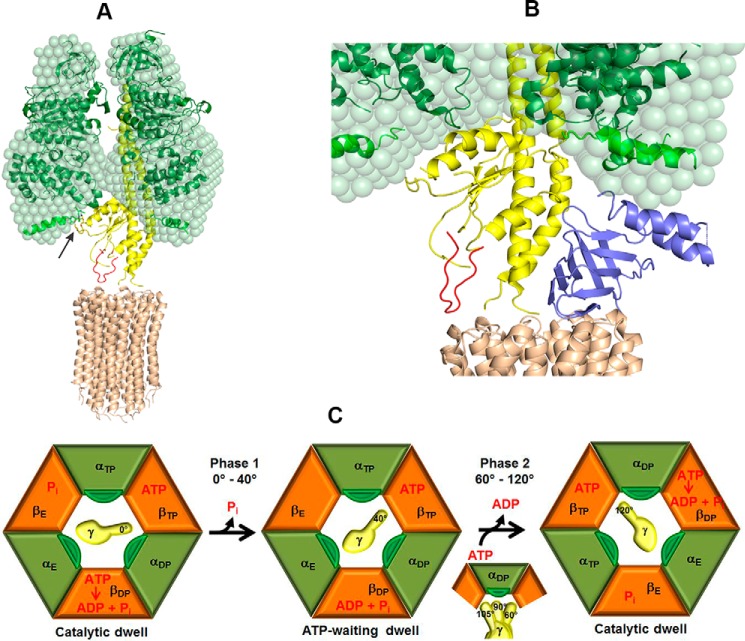
The F1F0 -ATP (F-ATP) synthase is essential for growth of Mycobacterium tuberculosis, the causative agent of tuberculosis (TB). In addition to their synthase function most F-ATP synthases possess an ATP-hydrolase activity, which is coupled to proton-pumping activity. However, the mycobacterial enzyme lacks this reverse activity, but the reason for this deficiency is unclear. Here, we report that a Mycobacterium-specific, 36-amino acid long C-terminal domain in the nucleotide-binding subunit α (Mtα) of F-ATP synthase suppresses its ATPase activity and determined the mechanism of suppression. First, we employed vesicles to show that in intact membrane-embedded mycobacterial F-ATP synthases deletion of the C-terminal domain enabled ATPase and proton-pumping activity. We then generated a heterologous F-ATP synthase model system, which demonstrated that transfer of the mycobacterial C-terminal domain to a standard F-ATP synthase α subunit suppresses ATPase activity. Single-molecule rotation assays indicated that the introduction of this Mycobacterium-specific domain decreased the angular velocity of the power-stroke after ATP binding. Solution X-ray scattering data and NMR results revealed the solution shape of Mtα and the 3D structure of the subunit α C-terminal peptide 521PDEHVEALDEDKLAKEAVKV540 of M. tubercolosis (Mtα(521-540)), respectively. Together with cross-linking studies, the solution structural data lead to a model, in which Mtα(521-540) comes in close proximity with subunit γ residues 104-109, whose interaction may influence the rotation of the camshaft-like subunit γ. Finally, we propose that the unique segment Mtα(514-549), which is accessible at the C terminus of mycobacterial subunit α, is a promising drug epitope.

Keywords: ATP synthase; F-ATP synthase; F1FO-ATPase; Mycobacterium; bioenergetics; membrane protein; subunit α; tuberculosis.


Conflict of interest statement

The authors declare that they have no conflicts of interest with the contents of this article

Figures

Figure 1.
Figure 1.
Sequence alignment of F-ATP synthase subunit α from various Mycobacterium species with the ones of E. coli, G. stearothermophilus, and human. The sequences were aligned with Clustal Omega and visualized using ALINE (61).
Figure 2.
Figure 2.
Catalytic activities of M. smegmatis F-ATP synthase wt and mutant proteins. A, continuous ATPase activity of wt (blue) M. smegmatis F-ATP synthase, Δα(514–548) (red), and Δα(521–540) mutants (orange), respectively, using IMVs measured in the presence of type II NADH dehydrogenase inhibitor thioridazine (80 μm) and 2 mm MgATP. B, specific ATPase activity of wt, Δα(514–548), and Δα(521–540) mutant IMVs. Values are the mean of six determinations with two different IMV batches of wt and mutants. C and D, substrate driven proton-pumping in IMVs. C, M. smegmatis mc2 155 wt membrane vesicles were diluted to 0.18 mg/ml. Fluorescence quenching of ACMA by wt IMVs was studied after the addition of a substrate (2 mm ATP (blue, profile 2)) or 2 mm NADH (purple, profile 3). The uncoupler (SF6847) was added at the indicated time point to collapse the proton gradient. In the control experiment, buffer was added in place for substrate (gray, profile 1). D, fluorescence quenching of ACMA by IMVs of the Δα(514–548) (red, profile 2) and Δα(521–540) mutant (orange, profile 3) after addition of ATP in comparison to the wt IMVs (blue, profile 1) and the recently described Δγ(166–179) mutant (green, profile 4) (23). Profile 5 (light blue) reveals the quenching of IMVs of the Δ(α514–548) mutant in the presence of 2 mm NADH. Fluorescence quenching of ACMA with wt- and α-mutant IMVs was performed with four and two different batches of vesicles, respectively. E, ATP synthesis measured for wt (blue), Δα(514–548) (red) and Δα(521–540) mutant (orange) IMVs of M. smegmatis. Effect of increasing concentrations of bedaquiline on ATP synthesis using the M. smegmatis Δα(514–548) mutant (F) and wt IMVs (G).
Figure 3.
Figure 3.
Purification of α3chiγ and ATP hydrolytic activity of Gsα3β3γ and α3chiγ. A, the chromatogram shows an elution profile of α3chiβ3γ using a Resource-Q column (6 ml). The inset in the figure reveals a SDS gel, which corresponds to the shaded area (gray) of the elution peak. The eluted α3chiβ3γ fractions were pooled and applied on the gel. Lanes 1 and 2 reveal the purified α3chiβ3γ and protein markers, respectively. The protein size in kDa is indicated on the right. B, continuous ATPase activity of Gsα3β3γ and α3chiβ3γ measured at 2 mm MgATP, 37 °C. Decrease in NADH absorption at 340 nm is plotted against time as dotted lines. The black lines show the linear least square fit for the first 10 s. C, specific ATPase activities of Gsα3β3γ and α3chiβ3γ determined from the slope of the least square fit. Values are the mean of 10 determinations. D, ATPase profile of nucleotide-depleted Gsα3β3γ (—) in a continuous ATPase activity assay measured at 2 mm MgATP. Bound MgADP was removed prior to activity measurements by incubating the protein with 5 mm Na-P and 10 mm EDTA for 30 min at 4 °C, and passing the enzyme samples through a Superdex 300TM column (GE Healthcare). (····) ATPase profile of Gsα3β3γ, which was preincubated with 100 μm MgADP for 30 min, revealing the MgADP inhibition effect, and confirming that tightly bound MgADP was removed due to the nucleotide depletion process of nucleotide-depleted Gsα3β3γ (—) described above. E, specific ATPase activities of the nucleotide-depleted Gsα3β3γ and α3chiβ3γ. Values are the mean of three determinations.
Figure 4.
Figure 4.
Single-molecule measurements of rotating beads complexed with Gsα3β3γ or α3chiβ3γ. A, schematic model of the experimental setup for the single-molecule rotation assay of protein-bead complexes. The enzyme was fixed to a Ni-NTA-coated coverslide via its His tags, whereas the biotinylated cysteine at γ109 served to bind a streptavidin-coated bead (Ø = 0.3 μm) doped with biotinylated quantum dots. B, trajectory of a rotating Gsα3β3γ-bead complex with a rotational rate of 3.4 rotations per second. C, sequence of single video frames (30 ms per frame) showing the counterclockwise rotation of a single Gsα3β3γ-bead complex. Each frame has a resolution of 20 × 20 pixel with 65 nm/pixel. D, trajectories of rotating α3chiβ3γ-bead complexes, revealing that all protein-bead complexes are continuously rotating forward, i.e. counterclockwise, when active.
Figure 5.
Figure 5.
Single-molecule measurements of rotating gold nanorods complexed with Gsα3β3γ or α3chiβ3γ. A, schematic model of the microscope setup. Gold nanorods are illuminated by a dark-field condenser. Red polarized light scattered from a nanorod was recorded by an APD after passing through a polarizer. The model also shows the interaction of a gold nanorod with Gsα3β3γ or α3chiβ3γ. The protein Gsα3β3γ or α3chiβ3γ (subunits α, β, and γ in orange, green, and yellow, respectively) is attached via its His10 tags in subunit β to a coverslide, whereas an avidin-coated nanorod is attached to the opposing biotin modified cysteine in subunit γ. B, consecutive histograms of light intensities of a rotating nanorod attached to α3chiβ3γ upon rotating the polarizer in 10°-steps. The three peak positions in the histograms, resulting from the catalytic dwells of protein, follow a sinusoidal curve over 360° rotation of the polarizer. The approximate courses of the three sine curves are indicated in gray. C, average angular velocity over angular position at 1 mm MgATP of Gsα3β3γ (red) and α3chiβ3γ (blue). Each point represents the average over three neighboring angular positions.
Figure 6.
Figure 6.
Purification, FCS and solution X-ray scattering studies of Gsα and αchi. Final purification of Gsα (A) and αchi (B) with a Superdex 200 column. The inset shows an SDS gel, which corresponds to the shaded area (gray) of the elution peak, pooled, and applied on the gel. Lanes 1 and 2 reveal the purified protein and protein markers, respectively. Binding properties of subunits Gsα and αchi to fluorescently labeled nucleotides. C and D, results of FCS experiments, showing the binding of labeled nucleotides to subunit α. The upper left and lower right insets show the normalized autocorrelation curves of MgATP- (C) and MgADP-ATTO-647N (D) obtained by increasing the quantity of subunits Gsα and αchi (increased protein concentration from left to right). C, binding of subunits Gsα and αchi to MgATP-ATTO-647N and D, MgADP-ATTO-647N displayed as relative bound fraction versus protein concentration. The best fits to titration curves are shown as a non-linear, logistic curve fits. The percentage of complex formation for each concentration was calculated using a two-component fitting model. The binding constant, KD, was derived by fitting the data with the Hill equation. E, small angle X-ray scattering pattern (○) for Gsα (green) and αchi (orange). Fitting of the theoretical scattering curve (—) for Gsα computed by CRYSOL with the experimental scattering pattern (○) for Gsα (green) and αchi (orange) resulted in χ2-values of 1.44 and 1.46, respectively. The curves are displayed in logarithmic units for clarity. Inset, Guinier plots show linearity indicating no aggregation. F, pair-distance distribution function P(r) for Gsα (green) and αchi (orange). Inset, normalized Kratky plot indicating the folded nature of the protein. G, the average solution shape of Gsα (green) and αchi (wheat) as calculated by the DAMMIN program is overlapped with the crystal structure of Gsα (brown).
Figure 7.
Figure 7.
CD and NMR studies of the peptide Mtα(521–540). A, circular dichroism (CD) spectrum of Mtα(521–540). B, the NOESY connectivity plot of Mtα(521–540). C, the average NMR structure of Mtα(521–540) is shown in schematic representation. D, molecular surface electrostatic potential of the peptide Mtα(521–540) generated by PyMOL (62), where the positive potentials are drawn in blue and the negative in red.
Figure 8.
Figure 8.
Interaction of the C-terminal stretch of α with the rotary subunit γ. A, a structural model of the α3chiβ3γ complex was generated based on the G. stearothermophilus F1-ATPase structure (32) (PDB code 4XD7). See text for details. At 60° rotation, the α-helical residues 90AYNSNVLRLVYQT102 of the central globular domain of subunit γ (yellow) come closer to the so-called DELSEED region, composed of residues 396AQFGSDLDK404 of subunit α (brown), and the extended C-terminal domain of αchi (green). The polar residues Gln104 and Arg106 as well as Cys109 are in proximity to the extended C-terminal residues Asp522, Glu523, and Val525. B, Val525 was substituted by a cysteine in the mutant α3chiβ3γ complex mutant resulting in the (αchi-V525C)3β3γ. The mutant protein was applied on a 9% SDS gel in the absence (lane 2) or presence (lane 3) of DTT. Two cross-link products of the oxidized complex are marked I and II (lane 2). Lane 1, represents molecular weight standard proteins. C, the bands of product I and II of Fig. 9B were cut out, incubated in the same buffer with 20 mm DTT, before embedding in a second 9% SDS gel under reducing condition. Lanes 1–4, represent the (αchi-V525C)3β3γ, product I, product II, and a molecular mass standard, respectively. D, the (αchi-V525C)β3γ complex in the absence (lane 2) or presence (lane 3) of DTT was applied on a 9% SDS gel. Lane 1, molecular weight standard.
Figure 9.
Figure 9.
Model of the interaction between subunits γ and αchi in α3chiβ3γ during rotation. A, the unique mycobacterial γ-loop (red), which is in the vicinity to the M. phlei c-ring (brown, PDB code 4V1G) (15), was inserted in the Gsγ (yellow). The arrow indicates the interaction between the 396AQFGSDLDK404 peptide (green) and the extra C-terminal domain of αchi (light green) with the α-helical peptide 90AYNSNVLRLVYQT102 of Gsγ. B, the proximity of the C-terminal helix of Mtϵ with the extended C-terminal stretch of αchi. Subunit ϵ (blue) inside the α3chiβ3γ complex was modeled based on the recently determined solution structure of Mtϵ (PDB code 5WY7), which was then superimposed onto the δ subunit of the bovine F1-ATPase. At 80° rotation of the central stalk, the compact C-terminal helix of Mtϵ might interact with the extended C-terminal domain of αchi on the way to form an extended conformation. C, subunits αchi, β with nucleotide occupancy, and γ with rotational position are shown in green, orange, and yellow, respectively, and labeled according to the native crystal structure (60). The extended C terminus of αchi is shown in dark green. Catalytic events are based on the model by Watanabe et al. (63). The state on the left shows the catalytic dwell. During phase 1 (see Fig. 5C) Pi release from βE triggers a 40° rotation of subunit γ, which leads the enzyme to adopt the ATP-waiting dwell. During phase 2, ATP binding and ADP release, accompanied by a change in the conformational states of the αchi and β subunits, causes subunit γ to further rotate by 80°. At a rotational position of 90° subunit γ is in close proximity to the extended C terminus of αchi.

References

    1. Sassetti C. M., Boyd D. H., and Rubin E. J. (2003) Genes required for mycobacterial growth defined by high density mutagenesis. Mol. Microbiol. 48, 77–84 - PubMed
    1. Cook G. M., Hards K., Vilcheze C., Hartman T., and Berney M. (2014) Energetics of respiration and oxidative phosphorylation in mycobacteria. Microbiol. Spectr. 2, 10.1128/microbiolspec.MGM2-0015-2013 - DOI - PMC - PubMed
    1. Lu P., Lill H., and Bald D. (2014) ATP synthase in mycobacteria: special features and implications for a function as drug target. Biochim. Biophys. Acta 1837, 1208–1218 - PubMed
    1. Santana M., Ionescu M. S., Vertes A., Longin R., Kunst F., Danchin A., and Glaser P. (1994) Bacillus subtilis F0F1 ATPase: DNA sequence of the atp operon and characterization of atp mutants. J. Bacteriol. 176, 6802–6811 - PMC - PubMed
    1. Cox R. A., and Cook G. M. (2007) Growth regulation in the mycobacterial cell. Curr. Mol. Med. 7, 231–245 - PubMed

Publication types

MeSH terms

LinkOut - more resources