. 2017 Jul;174(3):1289-1306.
doi: 10.1104/pp.16.01302. Epub 2017 May 11.

Bacterial Biosensors for in Vivo Spatiotemporal Mapping of Root Secretion

Affiliations

Bacterial Biosensors for in Vivo Spatiotemporal Mapping of Root Secretion

Francesco Pini et al. Plant Physiol. 2017 Jul.

Abstract

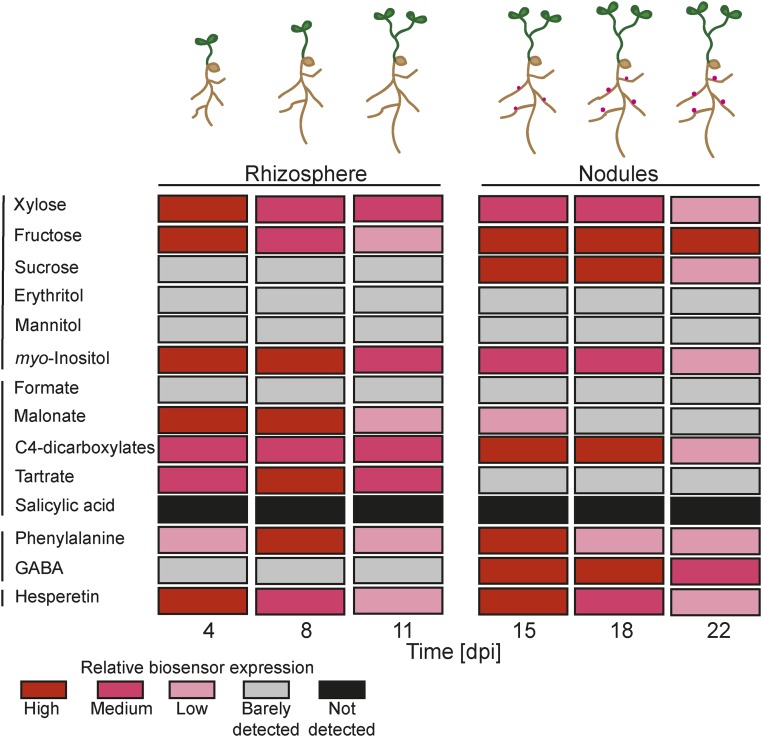
Plants engineer the rhizosphere to their advantage by secreting various nutrients and secondary metabolites. Coupling transcriptomic and metabolomic analyses of the pea (Pisum sativum) rhizosphere, a suite of bioreporters has been developed in Rhizobium leguminosarum bv viciae strain 3841, and these detect metabolites secreted by roots in space and time. Fourteen bacterial lux fusion bioreporters, specific for sugars, polyols, amino acids, organic acids, or flavonoids, have been validated in vitro and in vivo. Using different bacterial mutants (nodC and nifH), the process of colonization and symbiosis has been analyzed, revealing compounds important in the different steps of the rhizobium-legume association. Dicarboxylates and sucrose are the main carbon sources within the nodules; in ineffective (nifH) nodules, particularly low levels of sucrose were observed, suggesting that plant sanctions affect carbon supply to nodules. In contrast, high myo-inositol levels were observed prior to nodule formation and also in nifH senescent nodules. Amino acid biosensors showed different patterns: a γ-aminobutyrate biosensor was active only inside nodules, whereas the phenylalanine bioreporter showed a high signal also in the rhizosphere. The bioreporters were further validated in vetch (Vicia hirsuta), producing similar results. In addition, vetch exhibited a local increase of nod gene-inducing flavonoids at sites where nodules developed subsequently. These bioreporters will be particularly helpful in understanding the dynamics of root exudation and the role of different molecules secreted into the rhizosphere.


Figures

Figure 1.
Figure 1.
In vivo spatial and temporal mapping images of pea root colonization and nodulation with wild-type Rlv3841 luminescently labeled with a constitutive neomycin phosphotransferase promoter controlling Lux expression in pIJ11282 (Frederix et al., 2014). A, Images were acquired at 4, 8, 11, 15, 18, and 22 dpi, with nodules visible to the naked eye at between 11 and 15 dpi (scale, 300–12,000 cps). B, Mean luminescence (pixels mm−2) with se shown by error bars.
Figure 2.
Figure 2.
A to D, In vivo spatial and temporal mapping images of pea roots with biosensors detecting Suc (A; scale, 200–65,535 cps), myo-inositol (B; scale, 150–5,000 cps), malonate (C; scale, 50–2,000 cps), and Phe (D; scale, 150–15,000 cps). Images were acquired at 4, 8, 11, 15, 18, and 22 dpi, with nodules visible to the naked eye between 11 and 15 dpi. These images are representative of those from biosensors in the wild-type Rlv3841 background, which nodulates peas. E to H, Comparison of mean luminescence intensity per pixel from pea roots inoculated with biosensors in the wild-type Rlv3841 background (dark gray bars) and the Rlv3841 nodC128::Tn5 background (light gray bars). Only wild-type Rlv3841 can form nodules. The biosensors detect Suc (E), myo-inositol (F), malonate (G), and Phe (H). se values are shown by error bars; asterisks indicate significant differences between biosensors in the wild-type Rlv3841 background and the Rlv3841 nodC128::Tn5 background (Student’s t test, *, P < 0.05 and **, P < 0.01). Differences between each time point (ANOVA with posthoc Tukey’s test, P < 0.05) are reported in Supplemental Tables S4 and S5. For representative images from the Rlv3841 nodC128::Tn5 background, see Supplemental Figure S8. I to L, Closeup light-field photographs and luminescence of roots showing nodules at 15 dpi inoculated with biosensors detecting Suc (I), myo-inositol (J), malonate (K), and Phe (L).
Figure 3.
Figure 3.
Comparison of mean luminescence intensity per pixel from pea roots inoculated with biosensors in wild-type Rlv3841 (dark gray bars) or the Rlv3841 nodC128::Tn5 mutant (light gray bars). Only wild-type Rlv3841 can form nodules. Biosensors detect Xyl (A), Fru (B), C4-dicarboxylates (C), tartrate (D), GABA (E), and hesperetin (F). se values are shown by error bars; asterisks indicate significant differences between biosensors in wild-type Rlv3841 and Rlv3841 nodC128::Tn5 (Student’s t test, *, P < 0.05 and **, P < 0.01). Differences between each time point (ANOVA with posthoc Tukey’s test, P < 0.05) are reported in Supplemental Tables S4 and S5. For representative images from the Rlv3841 background and the Rlv3841 nodC128::Tn5 background, see Supplemental Figures S5 and S9, respectively.
Figure 4.
Figure 4.
Comparison of mean luminescence (cps mm−2) from pea nodules of different ages with biosensors in wild-type Rlv3841 (dark gray bars) or the Rlv3841 nifH::ΩSp mutant (white bars). Nodules formed by Rlv3841 fix nitrogen, whereas those formed by the mutant strain are unable to do so. Biosensors are constitutively active (A), or specific for Suc (B), myo-inositol (C), C4-dicarboxylates (D), and GABA (E). se values are shown by error bars; asterisks indicate significant differences between biosensors in wild-type Rlv3841 and the Rlv3841 nifH::ΩSp mutant (Student’s t test, *, P < 0.05 and **, P < 0.01). Differences between each time point (ANOVA with posthoc Tukey’s test, P < 0.05) are reported in Supplemental Tables S6 and S7.
Figure 5.
Figure 5.
Comparison of mean luminescence (cps mm−2) from vetch roots inoculated with biosensors in the wild-type Rlv3841 background. Biosensors detect Xyl (A), Fru (B), Suc (C), myo-inositol (D), malonate (E), C4-dicarboxylates (F), Phe (G), GABA (H), and hesperetin (I). se values are shown by error bars. Differences between each time point (ANOVA with posthoc Tukey’s test, P < 0.05) are reported in Supplemental Table S8. Nodules are visible to the naked eye from 8 dpi.
Figure 6.
Figure 6.
Time course of hesperetin detection on a vetch seedling root from 1 to 22 dpi. Arrowheads indicate spots where luminescence is concentrated and a nodule forms later.
Figure 7.
Figure 7.
Summary of metabolite detection on pea roots: in the rhizosphere (≤11 dpi) and within nitrogen-fixing nodules (≥15 dpi). Lines on the left side group similar chemicals into sugars and polyols, organic acids, amino acids, and flavonoids. Colors show levels detected in rhizosphere and nodules: high, red; medium, dark pink; low, pale pink; barely detected, gray; not detected, black.

Similar articles

Cited by

References

    1. Badri DV, Weir TL, van der Lelie D, Vivanco JM (2009) Rhizosphere chemical dialogues: plant-microbe interactions. Curr Opin Biotechnol 20: 642–650 - PubMed
    1. Baetz U, Martinoia E (2014) Root exudates: the hidden part of plant defense. Trends Plant Sci 19: 90–98 - PubMed
    1. Bais HP, Weir TL, Perry LG, Gilroy S, Vivanco JM (2006) The role of root exudates in rhizosphere interactions with plants and other organisms. Annu Rev Plant Biol 57: 233–266 - PubMed
    1. Beringer JE. (1974) R factor transfer in Rhizobium leguminosarum. J Gen Microbiol 84: 188–198 - PubMed
    1. Berrabah F, Ratet P, Gourion B (2015) Multiple steps control immunity during the intracellular accommodation of rhizobia. J Exp Bot 66: 1977–1985 - PMC - PubMed

MeSH terms