

Resolving the Complex Genetic Basis of Phenotypic Variation and Variability of Cellular Growth
- PMID: 28495957
- PMCID: PMC5500157
- DOI: 10.1534/genetics.116.195180
Resolving the Complex Genetic Basis of Phenotypic Variation and Variability of Cellular Growth
Abstract
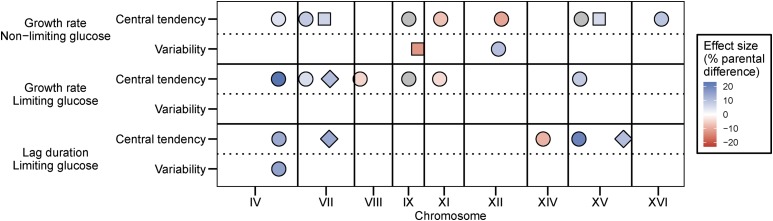
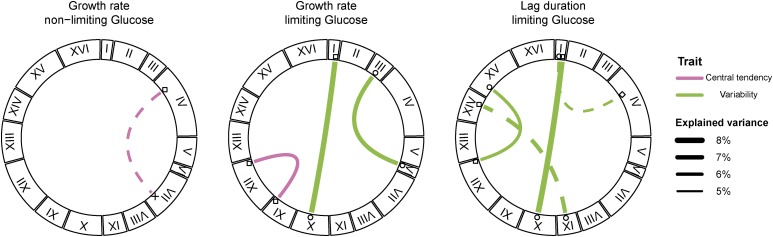
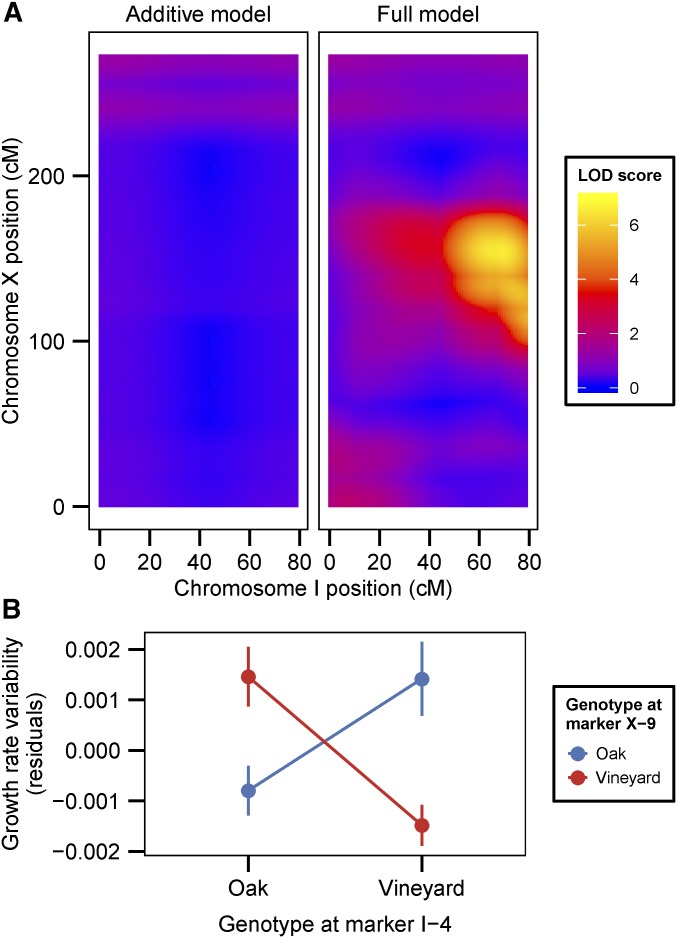
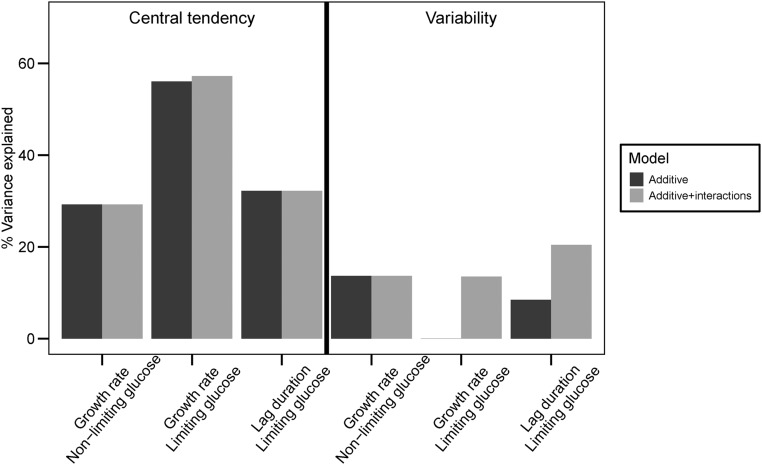
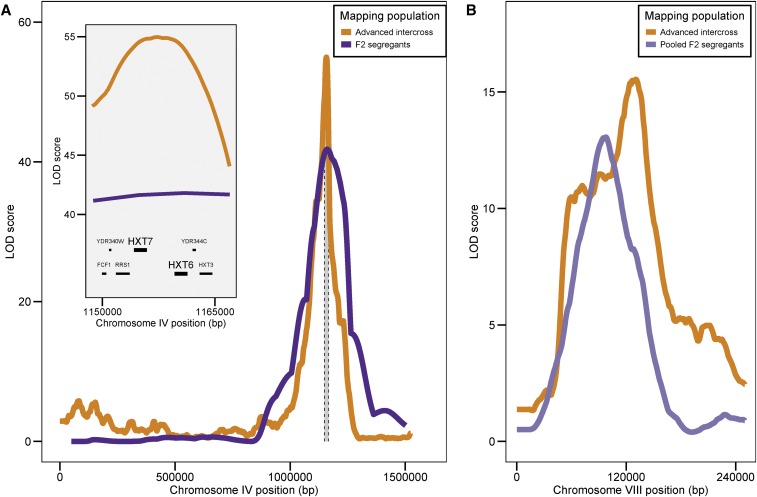
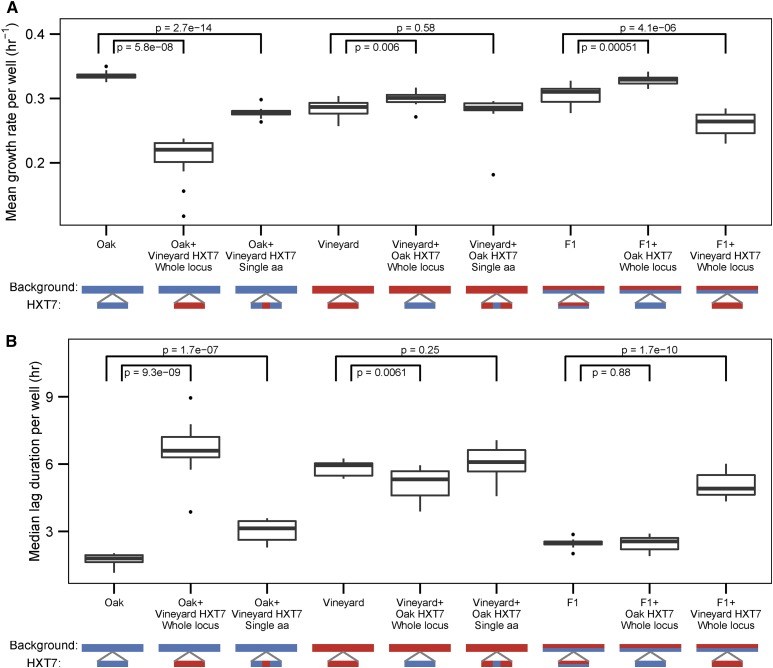
In all organisms, the majority of traits vary continuously between individuals. Explaining the genetic basis of quantitative trait variation requires comprehensively accounting for genetic and nongenetic factors as well as their interactions. The growth of microbial cells can be characterized by a lag duration, an exponential growth phase, and a stationary phase. Parameters that characterize these growth phases can vary among genotypes (phenotypic variation), environmental conditions (phenotypic plasticity), and among isogenic cells in a given environment (phenotypic variability). We used a high-throughput microscopy assay to map genetic loci determining variation in lag duration and exponential growth rate in growth rate-limiting and nonlimiting glucose concentrations, using segregants from a cross of two natural isolates of the budding yeast, Saccharomyces cerevisiae We find that some quantitative trait loci (QTL) are common between traits and environments whereas some are unique, exhibiting gene-by-environment interactions. Furthermore, whereas variation in the central tendency of growth rate or lag duration is explained by many additive loci, differences in phenotypic variability are primarily the result of genetic interactions. We used bulk segregant mapping to increase QTL resolution by performing whole-genome sequencing of complex mixtures of an advanced intercross mapping population grown in selective conditions using glucose-limited chemostats. We find that sequence variation in the high-affinity glucose transporter HXT7 contributes to variation in growth rate and lag duration. Allele replacements of the entire locus, as well as of a single polymorphic amino acid, reveal that the effect of variation in HXT7 depends on genetic, and allelic, background. Amplifications of HXT7 are frequently selected in experimental evolution in glucose-limited environments, but we find that HXT7 amplifications result in antagonistic pleiotropy that is absent in naturally occurring variants of HXT7 Our study highlights the complex nature of the genotype-to-phenotype map within and between environments.
Keywords: HXT7; bulk segregant mapping; microcolony; quantitative trait locus; yeast.
Copyright © 2017 by the Genetics Society of America.
Figures
Similar articles
-
Genetic Regulation of Phenotypic Plasticity and Canalisation in Yeast Growth.PLoS One. 2016 Sep 9;11(9):e0162326. doi: 10.1371/journal.pone.0162326. eCollection 2016. PLoS One. 2016. PMID: 27611930 Free PMC article.
-
Identification of Nitrogen Consumption Genetic Variants in Yeast Through QTL Mapping and Bulk Segregant RNA-Seq Analyses.G3 (Bethesda). 2017 Jun 7;7(6):1693-1705. doi: 10.1534/g3.117.042127. G3 (Bethesda). 2017. PMID: 28592651 Free PMC article.
-
Dissection of the molecular bases of genotype x environment interactions: a study of phenotypic plasticity of Saccharomyces cerevisiae in grape juices.BMC Genomics. 2018 Nov 9;19(1):772. doi: 10.1186/s12864-018-5145-4. BMC Genomics. 2018. PMID: 30409183 Free PMC article.
-
Genetic mapping of quantitative phenotypic traits in Saccharomyces cerevisiae.FEMS Yeast Res. 2012 Mar;12(2):215-27. doi: 10.1111/j.1567-1364.2011.00777.x. Epub 2012 Jan 24. FEMS Yeast Res. 2012. PMID: 22150948 Review.
-
Gene-gene and gene-environment interactions in complex traits in yeast.Yeast. 2018 Jun;35(6):403-416. doi: 10.1002/yea.3304. Epub 2018 Feb 22. Yeast. 2018. PMID: 29322552 Review.
Cited by
-
Fitness variation across subtle environmental perturbations reveals local modularity and global pleiotropy of adaptation.Elife. 2020 Dec 2;9:e61271. doi: 10.7554/eLife.61271. Elife. 2020. PMID: 33263280 Free PMC article.
-
Epistasis and cryptic QTL identified using modified bulk segregant analysis of copper resistance in budding yeast.Genetics. 2025 Apr 17;229(4):iyaf026. doi: 10.1093/genetics/iyaf026. Genetics. 2025. PMID: 39989051
-
High-Throughput Live Imaging of Microcolonies to Measure Heterogeneity in Growth and Gene Expression.J Vis Exp. 2021 Apr 18;(170):10.3791/62038. doi: 10.3791/62038. J Vis Exp. 2021. PMID: 33938878 Free PMC article.
-
Growth tradeoffs produce complex microbial communities on a single limiting resource.Nat Commun. 2018 Aug 10;9(1):3214. doi: 10.1038/s41467-018-05703-6. Nat Commun. 2018. PMID: 30097583 Free PMC article.
-
The Effects of Locality and Host Plant on the Body Size of Aeolothrips intermedius (Thysanoptera: Aeolothripidae) in the Southwest of Poland.Insects. 2019 Aug 22;10(9):266. doi: 10.3390/insects10090266. Insects. 2019. PMID: 31443520 Free PMC article.
References
-
- Blomberg A., 2011. Measuring growth rate in high-throughput growth phenotyping. Curr. Opin. Biotechnol. 22: 94–102. - PubMed
MeSH terms
Substances
Grants and funding
LinkOut - more resources
Full Text Sources
Other Literature Sources
Molecular Biology Databases
