. 2017 Jun 15;6(6):881-890.
doi: 10.1242/bio.024679.

Pias3 is necessary for dorso-ventral patterning and visual response of retinal cones but is not required for rod photoreceptor differentiation

Affiliations

Pias3 is necessary for dorso-ventral patterning and visual response of retinal cones but is not required for rod photoreceptor differentiation

Christie K Campla et al. Biol Open. .

Abstract

Protein inhibitor of activated Stat 3 (Pias3) is implicated in guiding specification of rod and cone photoreceptors through post-translational modification of key retinal transcription factors. To investigate its role during retinal development, we deleted exon 2-5 of the mouse Pias3 gene, which resulted in complete loss of the Pias3 protein. Pias3-/- mice did not show any overt phenotype, and retinal lamination appeared normal even at 18 months. We detected reduced photopic b-wave amplitude by electroretinography following green light stimulation of postnatal day (P)21 Pias3-/- retina, suggesting a compromised visual response of medium wavelength (M) cones. No change was evident in response of short wavelength (S) cones or rod photoreceptors until 7 months. Increased S-opsin expression in the M-cone dominant dorsal retina suggested altered distribution of cone photoreceptors. Transcriptome profiling of P21 and 18-month-old Pias3-/- retina revealed aberrant expression of a subset of photoreceptor genes. Our studies demonstrate functional redundancy in SUMOylation-associated transcriptional control mechanisms and identify a specific, though limited, role of Pias3 in modulating spatial patterning and optimal function of cone photoreceptor subtypes in the mouse retina.

Keywords: Cell type specification; Gene regulation; Mouse knockout; Retina development; SUMOylation; Vision.


Conflict of interest statement

Competing interestsThe authors declare no competing or financial interests.

Figures

Fig. 1.
Fig. 1.
Targeted disruption of mouse Pias3. (A) Strategy for targeting Pias3. Targeting vector includes LoxP sites (triangles) flanking exons 2 to 5 of the Pias3 gene and neomycin cassette (Neo) enclosed by FRT sites. Arrows indicate position of PCR primers. (B) PCR screening of correctly targeted ES cells. Presence of the neomycin cassette in ES cell lines was confirmed by a 3.6 kb product (3′-PCR). Floxed (fl) or wild-type (wt) 5′ LoxP sites were distinguished by a 200 or 166 bp product, respectively. Presence of LoxP sites and neomycin cassette was further confirmed by 6.8 kb product using 5′-PCR. (C) 5′ PCR genotyping of F2 generation mice. Presence of LoxP sites and neomycin cassette in the genome of offspring derived from ES clone 2 was validated by a 6.8 kb product (5′-PCR). (D) Pias3 mRNA expression in mouse retina. RNA-Seq was performed using P21 Pias3+/+ and Pias3−/− retina. Sashimi plots of raw read alignments are shown corresponding to Pias3 floxed and knockout alleles. (E) PCR analysis of genomic DNA. Presence of wild-type (wt), floxed (fl), knockout (KO), and Rx-Cre alleles in the genome were confirmed by PCR. (F) Immunoblot analysis of protein extracts from conditional and complete knockout mice. Immunoblots of retina and spleen protein extracts from each mouse line were probed with anti-Pias3 antibody and anti-Actb as a loading control. Arrowheads represent endogenous Pias3 protein isoforms. Asterisks indicate nonspecific staining (spleen) and/or aberrant protein isoforms arising from the deletion of exons 2-5 (retina). PCR and immunoblot results are representative of at least three experimental replicates.
Fig. 2.
Fig. 2.
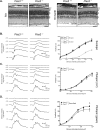
Normal retinal morphology but reduced ERG responses in Pias3−/− mice. (A) Hematoxylin and eosin (H&E) staining of methacrylate sections. Overall histology was assessed by H&E staining of retina sections from P21 and 18-month-old mice (n≥2 of each age and genotype). Scale bar: 50 μm. (B) Representative scotopic ERGs for Pias+/+ and Pias3−/− mice. P21 mice were dark-adapted for 24 h and scotopic responses recorded. Intensity response curves of the average a- and b-wave responses of ten Pias+/+ and six Pias3−/− mice (mean±s.e.m.) are shown. (C) Representative S-cone ERGs for Pias+/+ and Pias3−/−. P21 mice were light adapted and responses to UV light flashes were recorded. Intensity response curves of the average b-wave responses of ten Pias+/+ and six Pias3−/− mice (mean±s.e.m.) are shown. (D) Representative M-cone ERGs for Pias+/+ and Pias3−/− mice. P21 mice were light-adapted and responses to green light flashes were recorded. Intensity response curves of the average b-wave responses of ten Pias+/+ and six Pias3−/− mice (mean±s.e.m.; *P=0.0158) are shown.
Fig. 3.
Fig. 3.
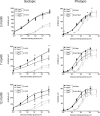
Pias3−/− mice exhibit age-associated decline in dark- and light-adapted flash ERG responses. Mice at 2, 7, and 12 months of age were dark-adapted for 24 h before recording scotopic responses. Intensity response curves of the average a- and b-wave responses of three mice of each genotype (mean±s.e.m.) are shown in the left panel. Mice were then light-adapted and responses to UV and green light flashes were recorded. Intensity response curves of the average photopic b-wave response (mean±s.e.m.) are shown in the right panel. *P<0.05.
Fig. 4.
Fig. 4.
Altered dorsoventral opsin expression in the Pias3−/− retina. (A) Flat-mount staining for cone opsins in dorsal and ventral retina. Cone opsin expression in flat-mounted retina from P21 mice was detected by immunostaining against S-opsin (Opn1sw, green) and M-opsin (Opn1mw, magenta). Scale bar: 50 μm. (B) Section staining for cone opsins in dorsal and ventral retina. Cone opsin expression in frozen sectioned eyes from P21 mice was detected by immunostaining against S-opsin (Opn1sw, green) and M-opsin (Opn1mw, magenta). Nuclei were detected by DAPI (blue). Scale bar: 50 μm. Results are representative of at least three biological replicates.
Fig. 5.
Fig. 5.
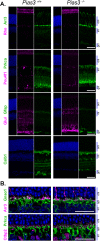
Retinal lamination and individual cell morphologies in Pias3−/− mice. (A) Immunostaining of P21 mouse retina sections. Primary antibodies were used to detect rod outer segments (Rho), cones (Arr3), ganglion cells (Pou4f1), bipolar cells (Prkca), normal and activated Müller glia (Glul and Gfap, respectively), and horizontal and amacrine cells (Calb1). Scale bar: 50 μm. (B) Immunostaining of outer plexiform layer synapses. Morphologies of cone synapse (Arr3), ON-bipolar synapse (Gnao1), ribbon synapse (Ctbp2), and rod bipolar synapse (Prkca) were examined by immunostaining using frozen retina sections from P21 mice. Scale bar: 25 μm. Results are representative of at least three biological replicates.
Fig. 6.
Fig. 6.
RNA-seq analysis of P21 Pias3−/− retina. (A) Scatter plot of global gene expression profiles between Pias3+/+ and Pias3−/− retina. RNA expression (in FPKM) of each gene expressed in Pias3+/+ (x-axis) is plotted against those in Pias3−/− (y-axis) retina (log10 scale). Red line represents equal expression value between samples. Gray lines represent FC of 1.5. (B) Volcano plot of differentially expressed genes in Pias3−/− retina. Difference in RNA expression between Pias3−/− and Pias3+/+ retina genes is plotted on the x-axis (log2 scale), and FDR adjusted significance is plotted on the y-axis. Genes up- or down-regulated by a factor ≥1.5 with FDR ≤0.05 are indicated in red. Vertical dashed lines represent FC=1.5. (C) Validation of RNA-seq results by qPCR. Differential expression values were compared between RNA-seq (black) and qPCR (dark gray) for 28 genes of either undefined or eye-related functions. Error bars represent s.e.m.; light gray background represents a FC of 1.5. (D) Classification of differentially expressed genes (DEGs) by cell type. DEGs were identified as rod- and/or cone-enriched by meta-analysis using RNA-Seq data from flow-sorted rods and cone-like photoreceptors. (E) Interaction analysis of DEGs. STRING (Search Tool for the Retrieval of Interacting Genes/Proteins) analysis was used to map putative protein interactions between DEGs. (F) Gene ontology (GO) annotations of DEGs. The top four over-represented GO pathways amongst DEGs at P21 were identified by GO enrichment analysis generated by PANTHER. (G) Circular visualization of GO enrichment analysis. Down-regulated genes (blue dots) and up-regulated genes (red dots) within each GO pathway are plotted based on logFC. Z-score bars indicate if an entire biological process is more likely to be increased or decreased based on the genes within it. (H) Chord plot representation of DEGs related to GO annotations. Overlaps in GO annotation amongst genes within each category are visualized.
Fig. 7.
Fig. 7.
RNA-Seq analysis of 18-month-old Pias3−/− mouse retina. (A) Scatter plot of global gene expression profiles of 18-month-old Pias3+/+ and Pias3−/− retina. RNA expression (shown in FPKM) of all expressed genes in Pias3+/+ (x-axis) retina was plotted against those in Pias3−/− (y-axis) retina (log10 scale). Red line represents equal expression value between samples. Gray lines represent FC of 1.5. (B) Volcano plot of differentially expressed genes in Pias3−/− retina. Fold change difference in RNA expression between Pias3−/− and Pias3+/+ retina is plotted on the x-axis (log2 scale), and false discovery rate adjusted significance is shown on the y-axis. Genes up- or downregulated by a factor ≥1.5 with false discovery rate ≤0.05 are indicated in red. (C) Classification of differentially expressed genes (DEGs) by cell type. DEGs were identified as rod- and/or cone-enriched by meta-analysis using RNA-Seq data from flow-sorted rods and cone-like photoreceptors. (D) Interaction analysis of DEGs. STRING (Search Tool for the Retrieval of Interacting Genes/Proteins) analysis was used to map putative protein interactions between DEGs.

Similar articles

Cited by

References

    1. Abad-Morales V., Domenech E. B., Garanto A. and Marfany G. (2015). mRNA expression analysis of the SUMO pathway genes in the adult mouse retina. Biol. Open 4, 224-232. 10.1242/bio.201410645 - DOI - PMC - PubMed
    1. Applebury M. L., Antoch M. P., Baxter L. C., Chun L. L. Y., Falk J. D., Farhangfar F., Kage K., Krzystolik M. G., Lyass L. A. and Robbins J. T. (2000). The murine cone photoreceptor: a single cone type expresses both S and M opsins with retinal spatial patterning. Neuron 27, 513-523. 10.1016/S0896-6273(00)00062-3 - DOI - PubMed
    1. Brzezinski J. A. and Reh T. A. (2015). Photoreceptor cell fate specification in vertebrates. Development 142, 3263-3273. 10.1242/dev.127043 - DOI - PMC - PubMed
    1. Bumsted K. and Hendrickson A. (1999). Distribution and development of short-wavelength cones differ between Macaca monkey and human fovea. J. Comp. Neurol. 403, 502-516. 10.1002/(SICI)1096-9861(19990125)403:4<502::AID-CNE6%3.0.CO;2-N - DOI - PubMed
    1. Cepko C. (2014). Intrinsically different retinal progenitor cells produce specific types of progeny. Nat. Rev. Neurosci. 15, 615-627. 10.1038/nrn3767 - DOI - PubMed