. 2017 May 23;114(21):5461-5466.
doi: 10.1073/pnas.1700557114. Epub 2017 May 11.

High-throughput biochemical profiling reveals sequence determinants of dCas9 off-target binding and unbinding

Affiliations

High-throughput biochemical profiling reveals sequence determinants of dCas9 off-target binding and unbinding

Evan A Boyle et al. Proc Natl Acad Sci U S A. .

Abstract

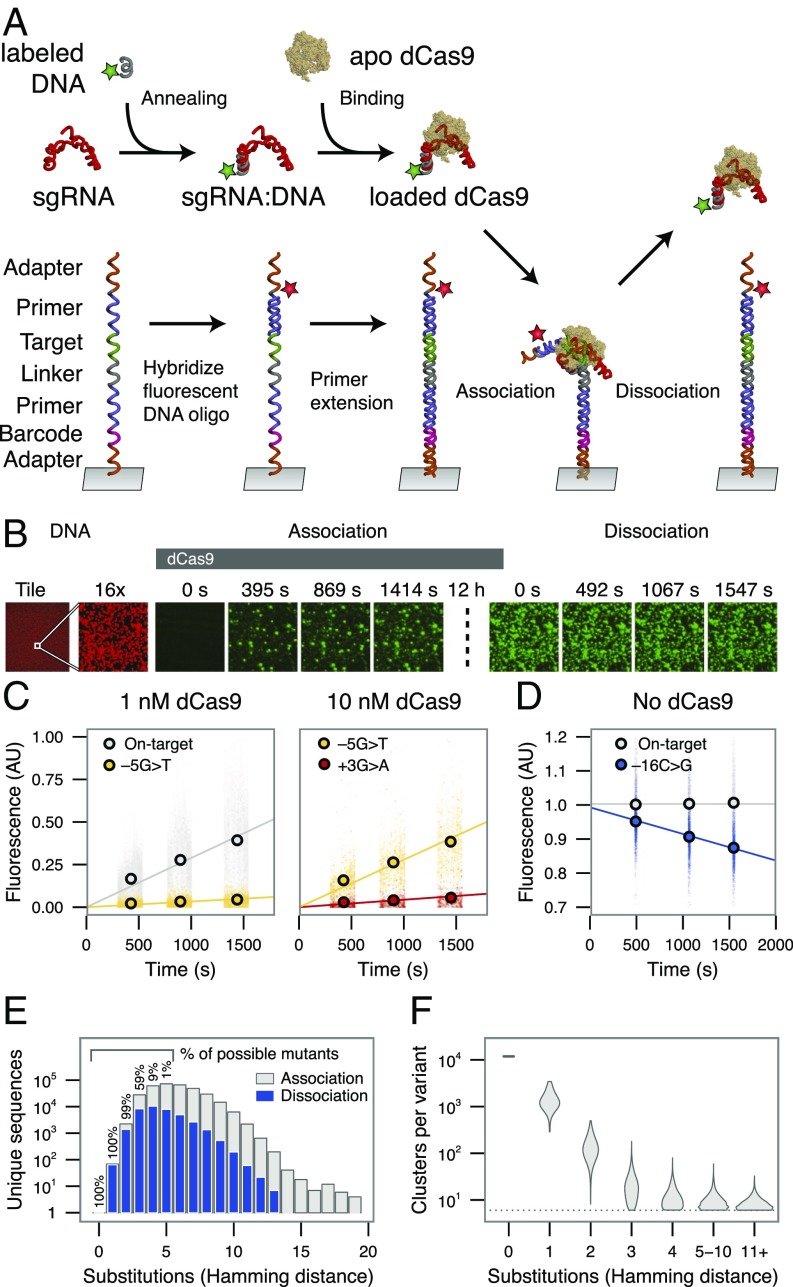
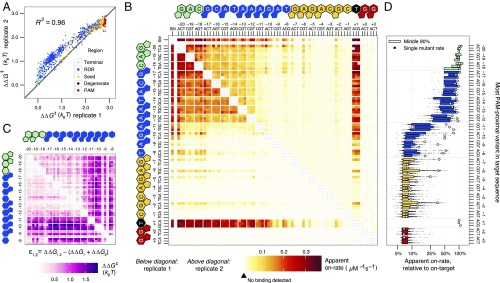
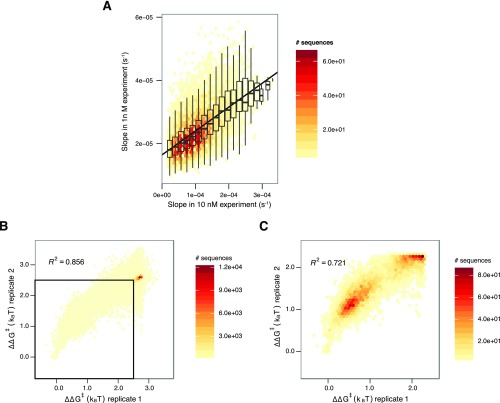
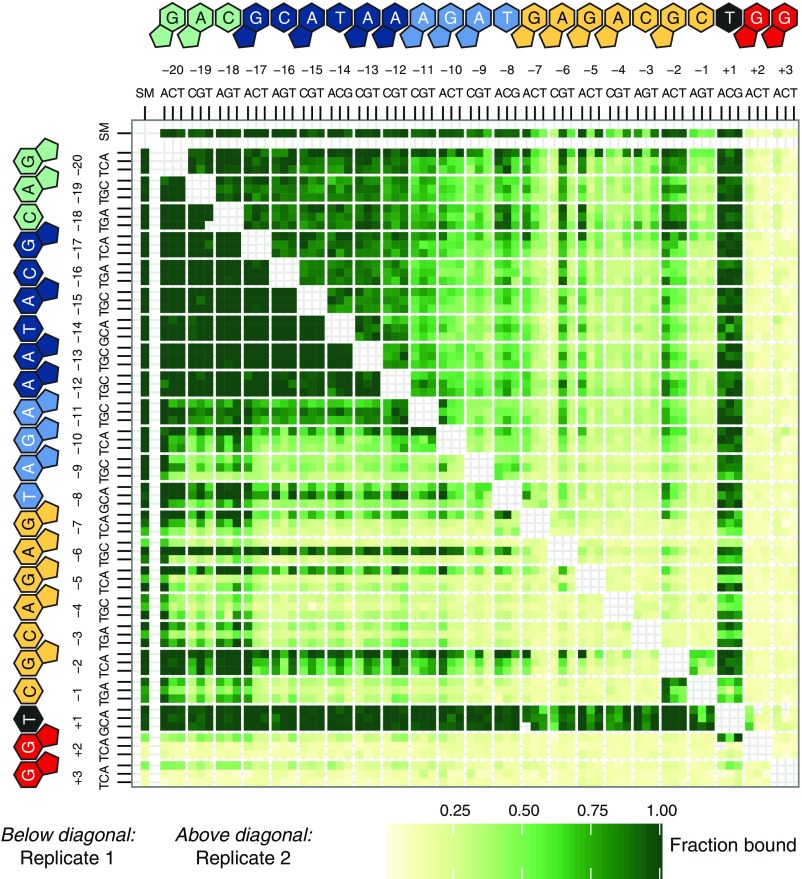
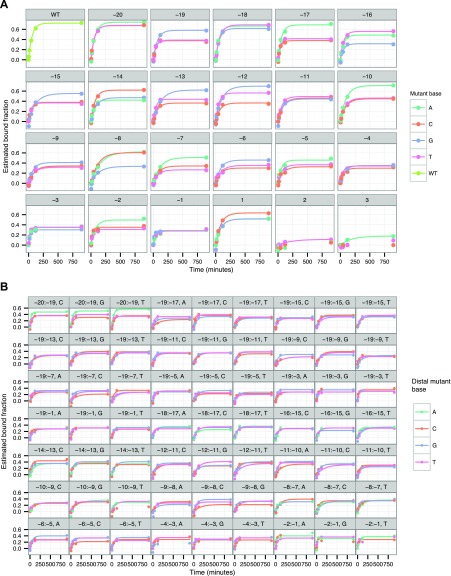
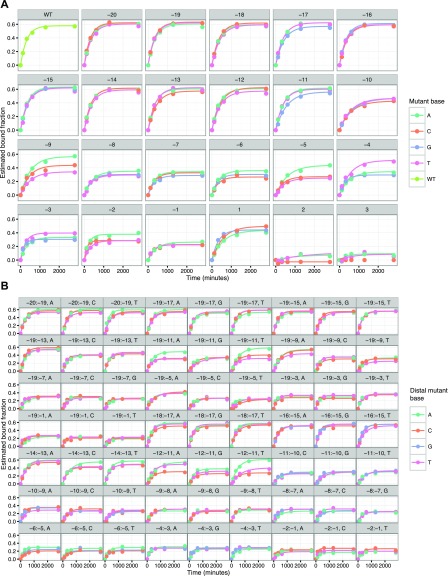
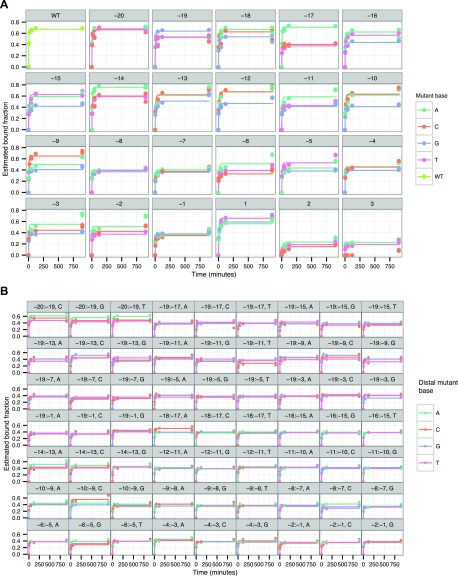
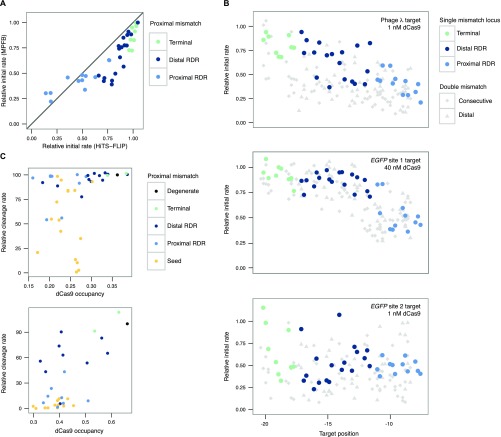
The bacterial adaptive immune system CRISPR-Cas9 has been appropriated as a versatile tool for editing genomes, controlling gene expression, and visualizing genetic loci. To analyze Cas9's ability to bind DNA rapidly and specifically, we generated multiple libraries of potential binding partners for measuring the kinetics of nuclease-dead Cas9 (dCas9) interactions. Using a massively parallel method to quantify protein-DNA interactions on a high-throughput sequencing flow cell, we comprehensively assess the effects of combinatorial mismatches between guide RNA (gRNA) and target nucleotides, both in the seed and in more distal nucleotides, plus disruption of the protospacer adjacent motif (PAM). We report two consequences of PAM-distal mismatches: reversal of dCas9 binding at long time scales, and synergistic changes in association kinetics when other gRNA-target mismatches are present. Together, these observations support a model for Cas9 specificity wherein gRNA-DNA mismatches at PAM-distal bases modulate different biophysical parameters that determine association and dissociation rates. The methods we present decouple aspects of kinetic and thermodynamic properties of the Cas9-DNA interaction and broaden the toolkit for investigating off-target binding behavior.

Keywords: CRISPR; DNA; kinetics; molecular biophysics; sequencing.


Conflict of interest statement

Conflict of interest statement: S.H.S. is an employee of Caribou Biosciences, Inc. and an inventor on patents and patent applications related to CRISPR-Cas systems and applications thereof. J.A.D. is a cofounder of Editas Medicine, Intellia Therapeutics, and Caribou Biosciences and a scientific advisor to Caribou, Intellia, eFFECTOR Therapeutics, and Driver. J.A.D. receives funding from Roche, Pfizer, the Paul Allen Institute, and the Keck Foundation.

Figures

Fig. 1.
Fig. 1.
Quantifying dCas9 binding behavior on a massively parallel array. (A) Experimental procedure for high-throughput biochemical profiling. A fluorescent DNA oligo hybridized to the dCas9 sgRNA was loaded into the apo-dCas9. In parallel, an Illumina sequencing-compatible DNA construct was both labeled and made double-stranded by extending a second fluorescent oligo. dCas9 was flowed into the chamber, allowing association with double-stranded DNA. A dissociation experiment was then performed by quantifying the decrease in dCas9 signal upon dilution or chase. (B) Example images taken in two channels on the array, Alexa Fluor 647-labeled DNA (red) and Cy3-labeled dCas9 (green). A 12-h incubation, meant to saturate the clusters with dCas9, separates association from dissociation experiments (dotted line). For most clusters, signal accumulated in the on-rate experiment largely remains throughout the dissociation. (Magnification: right nine panels, 16×.) (C and D) Examples of (C) association and (D) dissociation lines fit to different targets. The +1 base refers to the first base of the PAM, −1 to the most PAM-proximal base, and −20 to the most PAM-distal base. (E) The total number (y axis) and percentage (in text) of possible targets profiled for each number of substitutions from the on-target site. Only a fraction of sequences with quantified on-rates are profiled for off-rates (blue) with high confidence. (F) Clusters per variant for targets with the given number of substitutions. AU, arbitrary units.
Fig. 2.
Fig. 2.
Deep profiling of dCas9 observed initial association rates across a range of potential off-target sequences. (A) dCas9 effective energy barrier reproducibility (natural log of the ratio of observed initial on-rate to on-target observed initial on-rate) for single and double mutants across replicates, calculated relative to the on-target DNA. Points are colored by the more PAM-proximal mutation position, excepting the degenerate base of the NGG PAM. (B) Apparent association rates for all single mutants (the series of tiles “SM,” horizontal and vertical) and double mutants (all other tiles) across both replicates, shown above and below the diagonal. Heat reflects higher on-rate for off-target sequences with the substitutions indicated on the x and y axes. Targets with at least six clusters but with no detectable binding were colored the minimum quantified rate. Double mutant cells lacking six clusters are left unfilled. (C) Epistasis in energy barriers for double mutants for the PAM-distal nucleotides. Nearly all pairs of mismatches have slower rates than expected by single mismatch estimates. Targets with mismatches in the seed were excluded owing to low variation in rate. (D) Distribution of higher order (>2) mutant on-rates summarized by their most PAM-proximal mutation (degenerate base excluded). Single mutants are highlighted in outlined white circles and correspond to the single mutant rate data in C.
Fig. S1.
Fig. S1.
Merging of datasets and reproducibility of on-rates for 1 and 10 nM experiments. (A) The initial apparent on-rates from 10 nM data were extrapolated into apparent on-rates expected from 1 nM using a line fit to the on-rates for different sequences, shown above in scatter plot. The slope of the fit line is 0.076 (i.e., on-rates in the 1 nM data were 7.6% of that seen in the 10 nM data). Both differential protein loss in the microfluidic lines and pipetting error may explain the deviation from the expected 10%. (B) All mutant sequences are shown in this scatter plot. Most sequences are concentrated in the upper right, likely corresponding to PAM recognition kinetics. (C) Zooming into the indicated square in A highlights more than marginal binding. Sequences with high error in on-rate estimates (corresponding to 2% of sequences fit with on-rates) were removed before calculating correlations.
Fig. S2.
Fig. S2.
Variation in dCas9 end occupancy levels at off-targets. The fraction of fluorescent signal relative to the on-target site is shown for each single mutant (row and column labeled SM) and double mutant (other tiles) off-target sequence following a 12-h incubation with 10 nM dCas9 in the flow cell.
Fig. S3.
Fig. S3.
Parameterization of kinetic Monte Carlo strand invasion model and model evaluation against observed data. (A) dCas9 strand invasion was modeled with kinetic Monte Carlo simulations parameterized with an initial on-rate, PAM-association energy, transversion penalty, transition penalty, and a second protein association energy at a discrete position (which was also a fit parameter). Parameters were optimized by grid search by minimizing Euclidean distance of the observed data relative to the on-target simulation. (B) Each point is an off-target double mismatch sequence with a terminal nucleotide substitution (position −18, −19, or −20) colored by the position of a PAM-proximal mismatch. Double mutant energy barriers predicted from single mutant energy barriers (x axis) consistently underestimate the observed energy barriers (y axis). (C) Strand invasion simulations parameterized from the single mutant data also fail to predict the observed kinetics of double mutant binding, suggesting that this nonadditive effect cannot be captured by this thermodynamic model of strand invasion. The presence of an extremely PAM-distal or terminal mismatch raises the effective barrier height substantially beyond the effect of the PAM-proximal mismatch.
Fig. 3.
Fig. 3.
Variation in dCas9 dissociation rates suggests a model of Cas9 binding behavior. (A) dCas9 apparent off-rates for single and double mutants, as in Fig. 2B. Apparent off-rates are systematically higher in the presence of an unlabeled competitor dsDNA that prevents rebinding (below diagonal) than without (above diagonal). (B) Massively parallel filter-binding results for reversible binding at 10 nM dCas9. At shorter time scales (gray points), dissociation is most rapid for seed mutants for both targets. At longer time scales (all other points), dissociation is almost exclusively controlled by PAM-distal mismatches, either in isolation (black, positions –19 to –14) or when paired with a second mutation (green points). Consecutive mismatches in the seed show minimal dissociation after long association (pink points). (C) Model diagram for R-loop formation in different off-target contexts. Rates for protospacer mismatches are color-coded by off-target partition as in A. PAM and PAM-proximal mismatches affect early steps in the Cas9 target identification procedure, whereas distal mismatches influence later steps. Dissociation rates in A are likely products of the kinetics of unwinding of the R loop across the RDR. Dissociation rates associated with transient binding, as with most PAM mutants that fail to form R-loop structures, do not appreciably bind and thus are not captured in the dissociation experiment.
Fig. S4.
Fig. S4.
In-solution characterization of dCas9 association and dissociation. (A–F). Filter-binding measurements of association for the on-target sequence and five single mismatch targets. For dissociation, DNA was first incubated with 10 nM dCas9, and data represent time after quench with competitor DNA. (G and H) Gel shift measurement of association for the perfect target and the −5T mutant. (I) Observed kinetic on-rates, kobs, and off-rates, koff, from fits to the data. Association curves were fit to a first-order reversible binding reaction [f = (fmaxfmin)(1− exp(−kobs t))+ fmin] and dissociation curves to an exponential decay [f = (fmaxfmin)(exp(−koff t))+ fmin], where t is time and fmax and fmin are the minimum and maximum signals, respectively. The “No mutation” and −5T targets did not dissociate sufficiently for accurate quantification, and the +3 target did not show appreciable binding after 60 min in the filter assay. Conc, concentration.
Fig. S5.
Fig. S5.
Characterization of dCas9 apparent off-rates. (A) Single- and double-mutant on- versus off-rates, colored by the sequences’ more PAM-proximal mismatch. Apparent association and dissociation rates for off-targets share a complex relationship and appear to fall in one of three regions: near wild type (bottom right, mostly terminal mutants), fast off (top middle, mostly RDR mutants), or slow on, variable off (left, mostly seed mutants). (B) Single and double mutants colored by the more PAM-distal nucleotide clearly show that mutations in the reversibility-determining region dominate apparent dissociation rate behavior. Addition of unlabeled competitor DNA reveals faster apparent initial dissociation behavior. (C) Agreement across higher order (>2) mutants is lower. R2 is calculated postfiltering of noisy measurements or those with the highest 2% in estimated error. (D) Multiple mismatches increased the apparent initial off-rate in PAM-distal bases but not in seed bases. Mismatches in the −12 to −17 positions (the distal RDR) contributed most to reversible binding.
Fig. S6.
Fig. S6.
Massively parallel filter binding of lambda DNA library. Binding curves were fit for (A) nearly all single mutant and (B) select double mutant sequences in an association experiment at 1 nM dCas9.
Fig. S7.
Fig. S7.
Massively parallel filter binding of eGFP site 1 DNA library. Binding curves were fit for (A) nearly all single mutant and (B) select double mutant sequences in an association experiment at 40 nM dCas9.
Fig. S8.
Fig. S8.
Massively parallel filter binding of eGFP site 2 DNA library. Binding curves were fit for (A) nearly all single mutant and (B) select double mutant sequences in an association experiment at 10 nM dCas9.
Fig. S9.
Fig. S9.
Insights from massively parallel filter binding data. (A) 1 nM data from both HiTS-FLIP and massively parallel filter binding experiments for the λ-target single mutants. The y = x line for perfect agreement is shown. Discordant points are enriched in regions with faster off-rates. (B) The relative initial rate, which we define as kobs times the fit max, plotted for each of the three target libraries at positions relevant for epistasis. Diamonds are double mismatches at consecutive target positions (e.g., a diamond at −18 represents mismatches at positions −17 and −18). Triangles are double mismatches where a proximal mismatch is paired with a distal mismatch at position −19 (e.g., a triangle at −15 represents mismatches at −15 and −19). The original lambda DNA target exhibits widespread negative epistasis. By comparison, the eGFP targets appear to exhibit both positive and negative epistasis. (C) dCas9 occupancy measured at single time points by massively parallel filter binding (10 nM dCas9) versus Cas9 cleavage measured in an eGFP fluorescence assay (25) for a mismatch-insensitive, slow-binding target (eGFP site 1, above), 15 h association, and for a seed mutant-sensitive, fast-binding target (eGFP site 2, below), 45 min association. Occupancy is correlated with reported rates, but seed mutants show lower cleavage rates than expected compared with RDR mutants.

References

    1. Anders C, Niewoehner O, Duerst A, Jinek M. Structural basis of PAM-dependent target DNA recognition by the Cas9 endonuclease. Nature. 2014;513:569–573. - PMC - PubMed
    1. Mojica FJM, Díez-Villaseñor C, García-Martínez J, Almendros C. Short motif sequences determine the targets of the prokaryotic CRISPR defence system. Microbiology. 2009;155:733–740. - PubMed
    1. Wang H, La Russa M, Qi LS. CRISPR/Cas9 in genome editing and beyond. Annu Rev Biochem. 2016;85:227–264. - PubMed
    1. Sternberg SH, Redding S, Jinek M, Greene EC, Doudna JA. DNA interrogation by the CRISPR RNA-guided endonuclease Cas9. Nature. 2014;507:62–67. - PMC - PubMed
    1. Szczelkun MD, et al. Direct observation of R-loop formation by single RNA-guided Cas9 and Cascade effector complexes. Proc Natl Acad Sci USA. 2014;111:9798–9803. - PMC - PubMed

Publication types

MeSH terms