. 2017 May 11;7(1):1715.
doi: 10.1038/s41598-017-01924-9.

Serum Metabolomic Profiles for Breast Cancer Diagnosis, Grading and Staging by Gas Chromatography-Mass Spectrometry

Affiliations

Serum Metabolomic Profiles for Breast Cancer Diagnosis, Grading and Staging by Gas Chromatography-Mass Spectrometry

Naila Irum Hadi et al. Sci Rep. .

Abstract

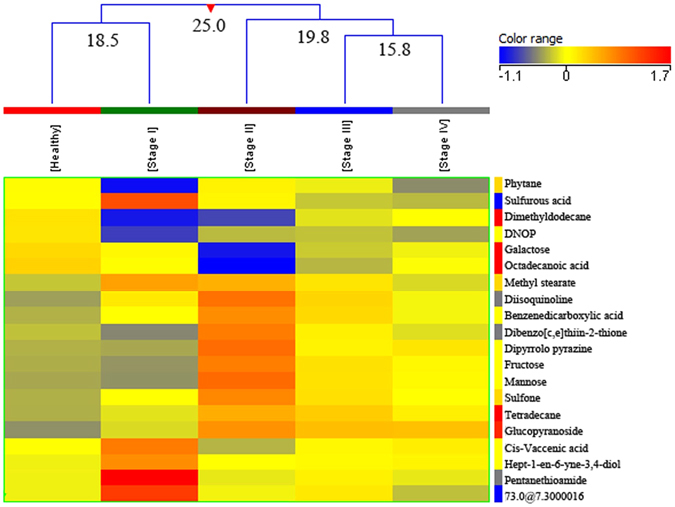
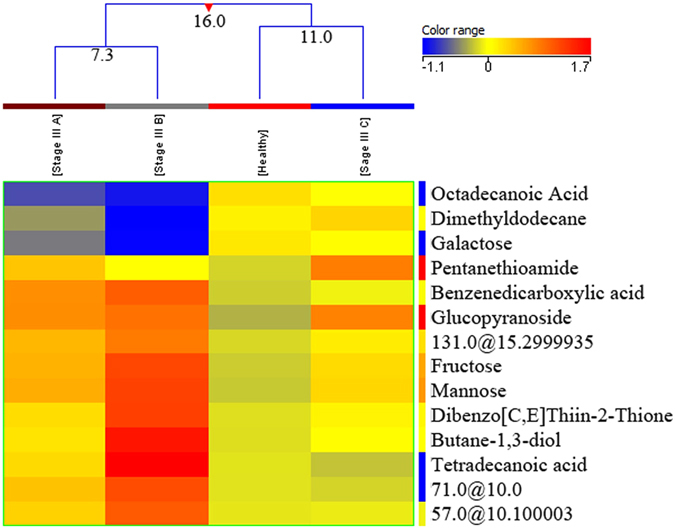
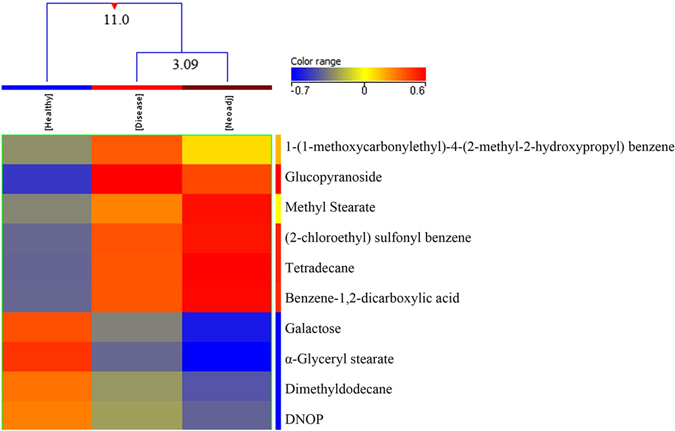
Detection of metabolic signature for breast cancer (BC) has the potential to improve patient prognosis. This study identified potentially significant metabolites differentiating between breast cancer patients and healthy controls to help in diagnosis, grading, staging and determination of neoadjuvant status. Serum was collected from 152 pre-operative breast cancer (BC) patients and 155 healthy controls in this case-controlled study. Gas chromatography-mass spectrometry (GC-MS) was used to obtain metabolic profiles followed by chemometric analysis with the identification of significantly differentiated metabolites including 7 for diagnosis, 18 for grading, 23 for staging, 15 for stage III subcategory and 10 for neoadjuvant status (p-value < 0.05). Partial Least Square Discriminant Analysis (PLS-DA) model revealed a distinct separation between healthy controls and BC patients with a sensitivity of 96% and specificity of 100% on external validation. Models for grading, staging and neoadjuvant status were built with Decision Tree Algorithm with predictive accuracy of 71.5%, 71.3% and 79.8% respectively. Pathway analysis revealed increased glycolysis, lipogenesis, and production of volatile organic metabolites indicating the metabolic alterations in breast cancer.


Conflict of interest statement

The authors declare that they have no competing interests.

Figures

Figure 1
Figure 1
Dendogram showing comparison of healthy controls and Breast Cancer patients using normalized intensities of seven significant metabolites (p < 0.05). The dendogram was constructed by applying a hierarchical clustering algorithm (Canberra, absolute distance metric, complete linkage).
Figure 2
Figure 2
Dendogram showing comparison of four groups of samples i.e. healthy controls, grade. I, II and III of Breast Cancer patients using normalized intensities of eighteen significant metabolites (p < 0.05). The dendogram was constructed by applying a hierarchical clustering algorithm (Canberra, absolute distance metric, complete linkage). Compounds that have been identified have their name mentioned while unidentified compounds are recognized by their retention time.
Figure 3
Figure 3
Dendogram showing comparison of five groups i.e. healthy controls, stage I, stage II, stage III and stage IV of Breast Cancer patients using normalized intensities of twenty significant metabolites (p < 0.05). The dendogram was constructed by applying a hierarchical clustering algorithm (Canberra, absolute distance metric, complete linkage). Compounds that have been identified have their name mentioned while one of the unidentified compound is recognized by its retention time. (DNOP - (1,2 Benzenedicarboxylic acid, bis (2-ethylhexyl) ester).
Figure 4
Figure 4
A dendogram showing comparison of four groups i.e. healthy controls, stage IIIA, stage IIIB and stage III C of Breast Cancer patients using normalized intensities of fourteen significant metabolites (p < 0.05). The dendogram was constructed by applying a hierarchical clustering algorithm (Canberra, absolute distance metric complete linkage). Compounds that have been identified have their names mentioned while three of the unidentified compounds are recognized by their retention time.
Figure 5
Figure 5
A dendogram showing comparison of three groups i.e. healthy controls, BC patients and Breast Cancer patients on neoadjuvant therapy using normalized intensities of ten significant metabolites (p < 0.05). The dendogram was constructed by applying a hierarchical clustering algorithm (Canberra, absolute distance metric, complete linkage). Compounds that have been identified have their names mentioned. (DNOP - 1,2 Benzenedicarboxylic acid, bis (2-ethylhexyl) ester).
Figure 6
Figure 6
PLS-DA scores scatter plots discriminating among healthy controls and breast cancer patients based on seven significantly differentiated metabolite profiling data. The blue squares indicate healthy controls (n = 155) while the red squares denote Breast Cancer patients (n = 152) respectively. (PLS-DA: Partial Least Squares-Discriminant Analysis).

References

    1. Ferlay J, et al. Cancer incidence and mortality worldwide: sources, methods and major patterns in GLOBOCAN 2012. Int J Cancer. 2015;136:E359–E386. doi: 10.1002/ijc.29210. - DOI - PubMed
    1. Breast cancer: Cancer statistics Key Stats. Cruk.org/cancerstats © Cancer Research UK [Internet]. Available from; stats. (Accessed on 16 May 2015) http://publications.camcerresearchuk.org/cancer (2014).
    1. Lord SJ, et al. A systematic review of the effectiveness of magnetic resonance imaging (MRI) as an addition to mammography and ultrasound in screening young women at high risk of breast cancer. Eur J Cancer. 2007;43(13):1905–1917. doi: 10.1016/j.ejca.2007.06.007. - DOI - PubMed
    1. Lindon JC, Holmes E, Nicholson JK. Metabonomics and its role in drug development and disease diagnosis. Expert Rev. Mol. Diagn. 2004;4(2):189–99. doi: 10.1586/14737159.4.2.189. - DOI - PubMed
    1. Zhang J, et al. Esophageal cancer metabolite biomarkers detected by LC-MS and NMR methods. PLoS One. 2012;7:e30181. doi: 10.1371/journal.pone.0030181. - DOI - PMC - PubMed