. 2017 May 11;7(1):1726.
doi: 10.1038/s41598-017-01929-4.

Genetic structure of Cercospora beticola populations on Beta vulgaris in New York and Hawaii

Affiliations

Genetic structure of Cercospora beticola populations on Beta vulgaris in New York and Hawaii

Niloofar Vaghefi et al. Sci Rep. .

Abstract

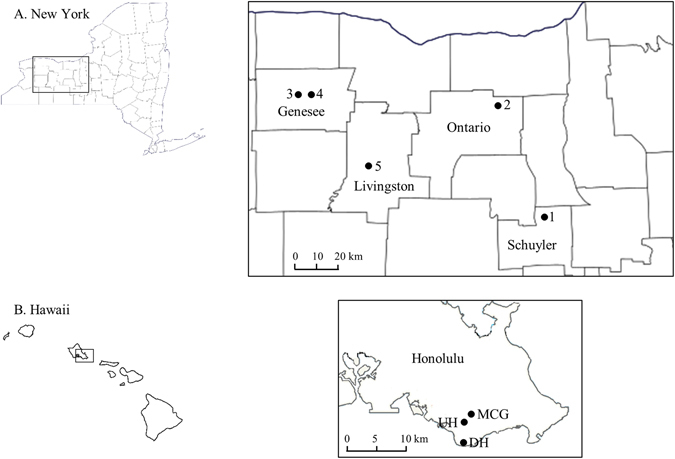
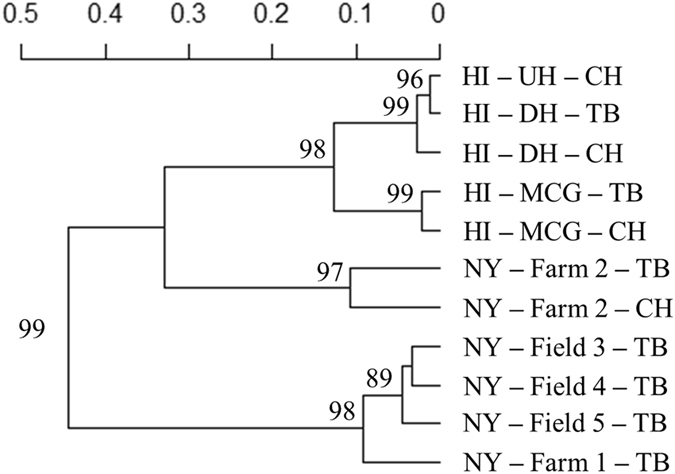
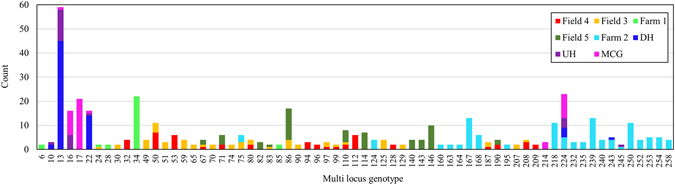
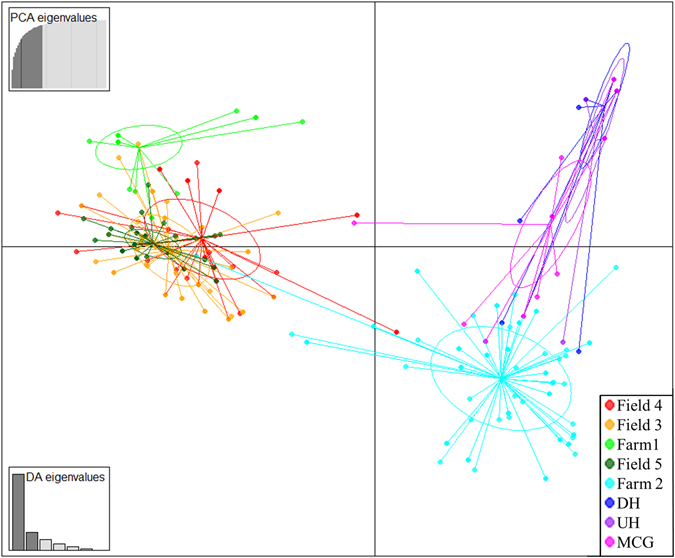
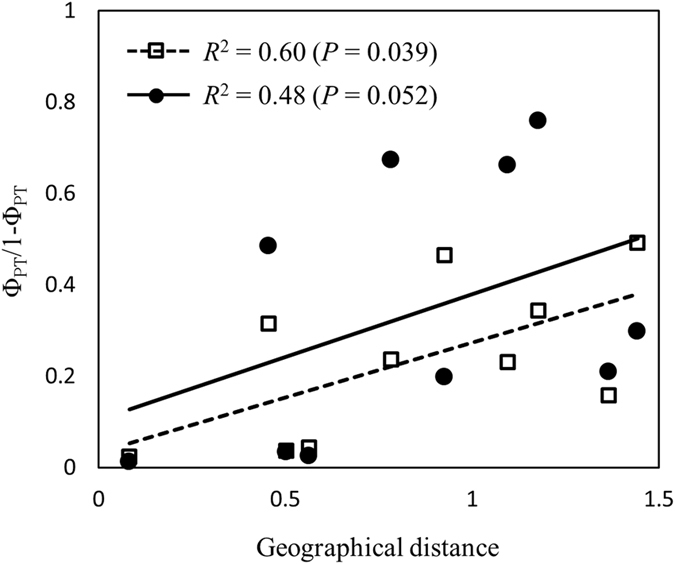
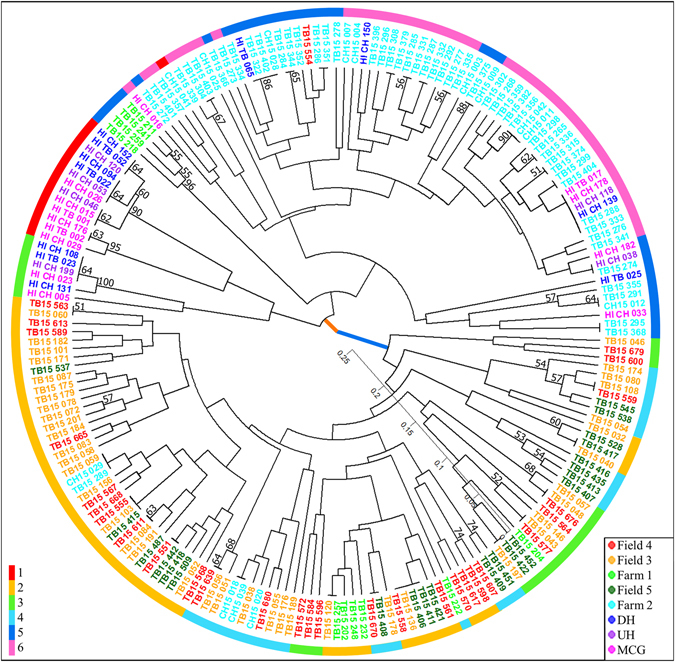
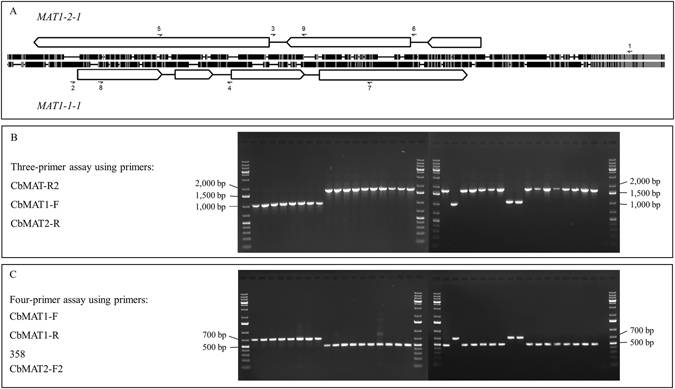
Cercospora leaf spot (CLS), caused by Cercospora beticola, is a major disease of Beta vulgaris worldwide. No sexual stage is known for C. beticola but in its asexual form it overwinters on infected plant debris as pseudostromata, and travels short distances by rain splash-dispersed conidiospores. Cercospora beticola infects a broad range of host species and may be seedborne. The relative contribution of these inoculum sources to CLS epidemics on table beet is not well understood. Pathogen isolates collected from table beet, Swiss chard and common lambsquarters in mixed-cropping farms and monoculture fields in New York and Hawaii, USA, were genotyped (n = 600) using 12 microsatellite markers. All isolates from CLS symptoms on lambsquarters were identified as C. chenopodii. Sympatric populations of C. beticola derived from Swiss chard and table beet were not genetically differentiated. Results suggested that local (within field) inoculum sources may be responsible for the initiation of CLS epidemics in mixed-cropping farms, whereas external sources of inoculum may be contributing to CLS epidemics in the monoculture fields in New York. New multiplex PCR assays were developed for mating-type determination for C. beticola. Implications of these findings for disease management are discussed.


Conflict of interest statement

The authors declare that they have no competing interests.

Figures

Figure 1
Figure 1
Sampling locations for Cercospora beticola populations collected in 2015 from (A) New York and (B) Hawaii. Numbers 1, 2, 3, 4, and 5 in New York represent Farm 1, Farm 2, Field 3, Field 4 and Field 5, respectively. In Hawaii, MCG, UH and DH represent community gardens in Honolulu (MCG = Manoa community garden, UH = University of Hawaii organic garden, and DH = Diamond Head community garden). The map presented here are modified from https://commons.wikimedia.org/wiki/File:Map_of_New_York_County_Outlines.svg and https://upload.wikimedia.org/wikipedia/commons/e/e5/Interstate_H1_map.png. Figures were produced in Microsoft Paint and Microsoft PowerPoint 2013.
Figure 2
Figure 2
UPGMA dendrogram constructed based on Nei’s distance among Cercospora beticola populations from New York and Hawaii (MCG = Manoa community garden, UH = University of Hawaii organic garden, and DH = Diamond Head community garden), 2015, represented by state–field–host (TB = table beet and CH = Swiss chard).
Figure 3
Figure 3
Recurrent multi-locus genotypes and their frequency in Cercospora beticola populations from New York (Farm 1, Farm 2, Field 3, Field 4 and Field 5) and Hawaii (MCG = Manoa community garden, UH = University of Hawaii organic garden, and DH = Diamond Head community garden), 2015.
Figure 4
Figure 4
Discriminant Analysis of Principal Components for Cercospora beticola populations from New York (Farm 1, Farm 2, Field 3, Field 4 and Field 5) and Hawaii (MCG = Manoa community garden, UH = University of Hawaii organic garden, and DH = Diamond Head community garden), 2015.
Figure 5
Figure 5
Standardized pairwise genetic distance (ΦPT/(1 − ΦPT)) plotted against geographic distance among five Cercospora beticola populations in New York, 2015. The open squares and dashed line are based on the complete data set, and the filled circles and solid line are based on the clone-corrected data set.
Figure 6
Figure 6
UPGMA dendrogram of Cercospora beticola isolates collected in 2015 from New York (Farm 1, Farm 2, Field 3, Field 4 and Field 5) and Hawaii (MCG = Manoa community garden, UH = University of Hawaii organic garden, and DH = Diamond Head community garden) based on Bruvo’s distance. Bootstrap support values greater than 50 are shown above the branches. The thick orange and blue branches denote the two clusters detected through Bayesian clustering method implemented in STRUCTURE. The colour of the isolates correspond to the field/community garden they belong as indicated in the right-hand-side legend. The colour of the outer ring corresponds to the six clusters detected by DAPC analysis as shown in the left-hand-side legend and Fig. S3.
Figure 7
Figure 7
(A) Schematic alignment of the MAT1 idiomorphs in Cercospora beticola; MAT1-2-1 (top) and MAT1-1-1 (bottom), showing the position and orientation of the open reading frames with arrowed boxes, and position of introns with black lines. The position of the primers used for mating-type determination are shown with arrows bearing the primer number according to Table 5. The thick black and grey lines in the alignment represent differences and similarities, respectively. (B) Three-primer mating-type assay, resulting in PCR amplicons of ~1,700 and ~1,050 bp in MAT1-1 and MAT1-2 isolates, respectively. (C) Four-primer mating type assay, resulting in PCR amplicons of ~500 and ~700 bp in MAT1-1 and MAT1-2 isolates, respectively. The first and last line in each gel include 6 µL of O’GeneRuler 1 kb Plus DNA Ladder (Thermo Scientific).

References

    1. McDonald BA. How can research on pathogen population biology suggest disease management strategies? The example of barley scald (Rhynchosporium commune) Plant Pathol. 2015;64:1005–1013. doi: 10.1111/ppa.12415. - DOI
    1. McDonald BA, Mundt CC. How knowledge of pathogen population biology informs management of Septoria tritici blotch. Phytopathology. 2016;106:948–955. doi: 10.1094/PHYTO-03-16-0131-RVW. - DOI - PubMed
    1. Milgroom MG, Peever TL. Population biology of plant pathogens: the synthesis of plant disease epidemiology and population genetics. Plant Dis. 2003;87:608–617. doi: 10.1094/PDIS.2003.87.6.608. - DOI - PubMed
    1. Linde C. Population genetic analyses of plant pathogens: new challenges and opportunities. Australas. Plant Pathol. 2010;39:23–28. doi: 10.1071/AP09061. - DOI
    1. Grünwald NJ, Goss EM. Evolution and population genetics of exotic and re-emerging pathogens: novel tools and approaches. Annu. Rev. Phytopathol. 2011;49:249–267. doi: 10.1146/annurev-phyto-072910-095246. - DOI - PubMed

Publication types

MeSH terms