. 2017 May 11;7(1):1721.
doi: 10.1038/s41598-017-01891-1.

Measurement of local temperature increments induced by cultured HepG2 cells with micro-thermocouples in a thermally stabilized system

Affiliations

Measurement of local temperature increments induced by cultured HepG2 cells with micro-thermocouples in a thermally stabilized system

Fan Yang et al. Sci Rep. .

Abstract

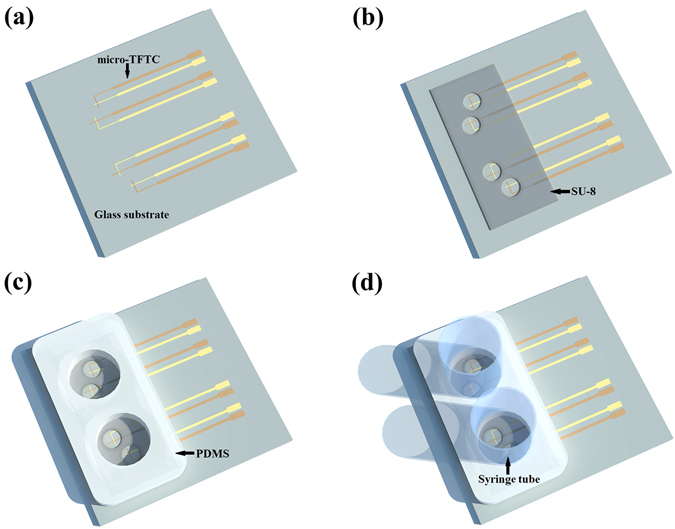
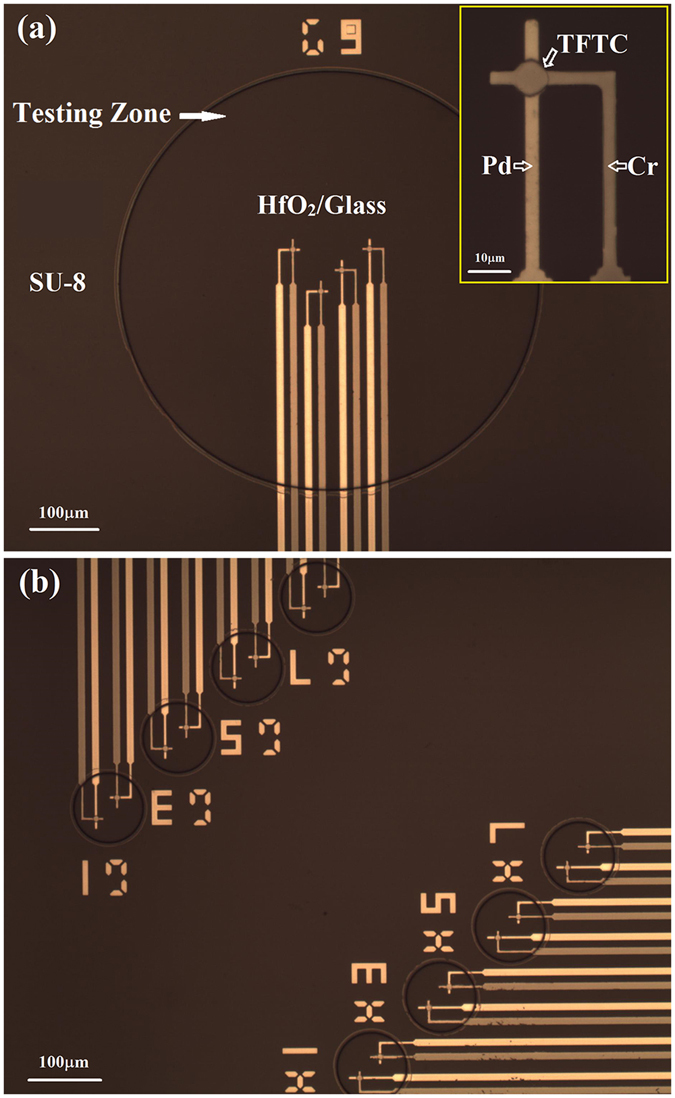
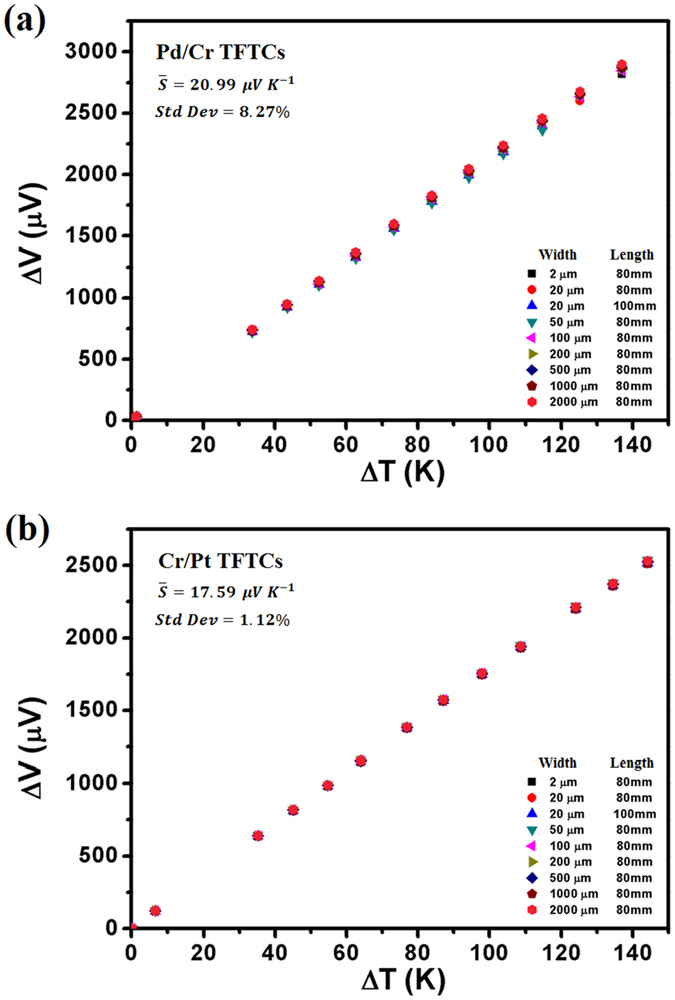
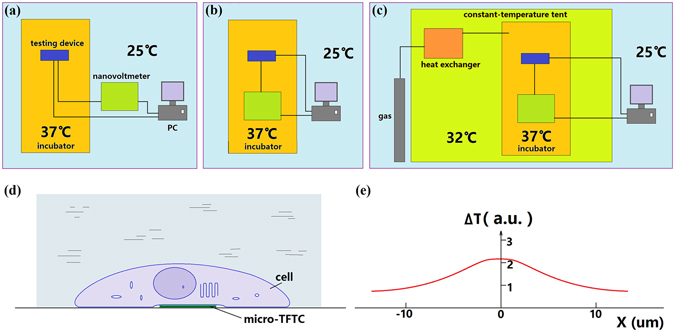
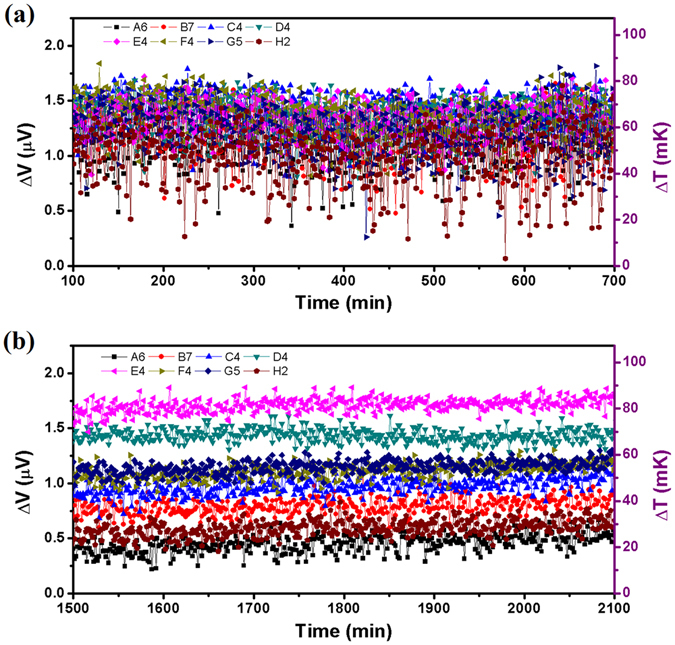
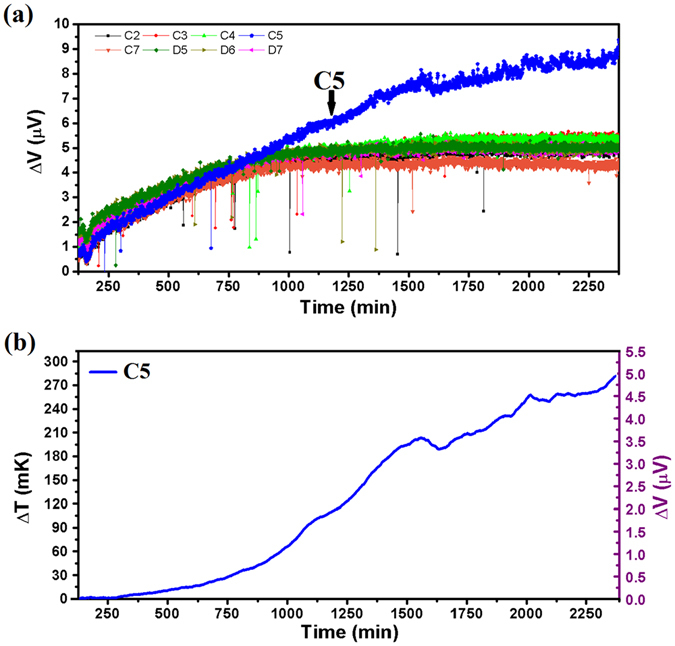
To monitor the temperature distribution of a cell and its changes under varied conditions is currently a technical challenge. A variety of non-contact methods used for measuring cellular temperature have been developed, where changes of local temperature at cell-level and sub-cell-level are indirectly calculated through the changes in intensity, band-shape, bandwidth, lifetime or polarization anisotropy of the fluorescence spectra recorded from the nano-sized fluorescent materials pre-injected into the target cell. Unfortunately, the optical properties of the fluorescent nano-materials may be affected by complicated intracellular environment, leading to unexpected measurement errors and controversial arguments. Here, we attempted to offer an alternative approach for measuring the absolute increments of local temperature in micro-Testing Zones induced by live cells. In this method, built-in high-performance micro-thermocouple arrays and double-stabilized system with a stability of 10 mK were applied. Increments of local temperature close to adherent human hepatoblastoma (HepG2) cells were continuously recorded for days without stimulus, showing frequent fluctuations within 60 mK and a maximum increment by 285 mK. This method may open a door for real-time recording of the absolute local temperature increments of individual cells, therefore offering valuable information for cell biology and clinical therapy in the field of cancer research.


Conflict of interest statement

The authors declare that they have no competing interests.

Figures

Figure 1
Figure 1
An illustration for the 3D structures of a testing device. (a) A micro-thin-film thermocouple (TFTC) array is fabricated on the glass substrate. (b) Testing Zones are confined by a layer of SU-8 above the micro-TFTC array. (c) Cylindroid rooms are confined by a layer of PDMS above the Testing Zones. (d) Syringe tubes are mounted to the PDMS layer at the holes’ positions.
Figure 2
Figure 2
Optical photographs of different Testing Zones. (a) A bigger Testing Zone with a diameter of 600 μm. It contains 4 Pd/Cr micro-TFTCs. The inset presents one of the Pd/Cr micro-TFTCs for details. The darker stripe is Cr stripe, the brighter stripe is Pd stripe. The stripe width is 3 μm. The overlapping junction on the top is the hot-end of the micro-TFTC. It has a diameter of 8 μm. (b) Two arrays of smaller Testing Zone with a diameter of 100 μm. Each Testing Zone contains 2 Pd/Cr micro-TFTCs.
Figure 3
Figure 3
Calibration results of the Pd/Cr and Cr/Pt TFTCs. The calculated thermopower is the average value of 9 different TFTCs. (a) Calibration results of 9 different Pd/Cr TFTCs. These TFTCs have varied stripe width of 2 μm, 20 μm, 50 μm, 100 μm, 200 μm, 500 μm, 1000 μm, and 2000 μm, and different stripe length of 80 mm and 100 mm. The calculated thermopower of Pd/Cr TFTCs is 20.99 ± 0.1 μV/K, with a standard deviation of 8.27%. (b) Calibration results of 9 different Cr/Pt TFTCs. These TFTCs have the same size with the Pd/Cr TFTCs. The calculated thermopower of Pd/Cr TFTCs is 17.59 ± 0.3 μV/K, with a standard deviation of 1.12%.
Figure 4
Figure 4
Schematic of the structures of measurement system and the measurement of local cellular temperature. (a) In normal practice, the testing device is put into the incubator at 37 °C and the other measurement instruments are put on the outside of the incubator at 25 °C. (b) The testing device and the other measurement instruments are put into the incubator at 37 °C, leaving the computer and monitor outside of the incubator at 25 °C. (c) A big constant-temperature tent kept at 32 °C is put on the outside of the incubator. Testing device and measurement instruments are put inside the incubator. The CO2 gas tank, computer and monitor are put on the outside of the tent. (d) A live cell firmly sticks to the micro-TFTC sensor. (e) A non-uniform temperature distribution in the cell (15–25 μm in diameter).
Figure 5
Figure 5
Thermal fluctuations of 8 Pd/Cr micro-TFTCs under different conditions. (a) Thermal fluctuations of 8 Pd/Cr micro-TFTCs (A6, B7, C4, D4, E4, F4, G5 and H2 located in different Testing Zones of different regions) tested in an ordinary laboratory kept at 25 °C, which were exposed to the air. (b) Thermal fluctuations of the same TFTCs tested in the double-stabilized constant-temperature system kept at 32 °C, which were covered by culture medium.
Figure 6
Figure 6
Microscopic images of cultured HepG2 cells. The top panel and bottom panel are photographs taken before and after test, respectively. (ad) The relative positions of adherent HepG2 cells and labelled micro-TFTCs E10, F6, F9 and G7. The live cells show typical irregular shape and light contrast, and the apoptotic cells show round shape and dark contrast.
Figure 7
Figure 7
Typical cases of increments of local temperature in Testing Zones recorded with 4 Pd/Cr micro-TFTCs at 32 °C. (ad) Measurement data of different Testing Zones taken from Pd/Cr micro-TFTC sensors of E10, F6, F9 and G7, respectively. For the data plotted here, background temperature has been deducted. The grey symbols and lines represent the original data, and the thick lines present the average values of each set of data. Recorded increments of local temperature in Testing Zones are within 60 mK.
Figure 8
Figure 8
Maximum increment of local temperature in Testing Zone recorded with Cr/Pt micro-TFTCs at 37 °C. (a) Output data of 8 Cr/Pt micro-TFTCs (C2, C3, C4, C5, C7, D5, D6 and D7) located in the same region. Except sensor C5 which is rising above, all the other 7 sensors behave according to the same synchronized trend. (b) Absolute increment of the output data for sensor C5 from the background temperature. The recorded absolute increment is 285 mK.

Similar articles

Cited by

References

    1. Paulik MA, et al. Development of infrared imaging to measure thermogenesis in cell culture: thermogenic effects of uncoupling protein-2, troglitazone, and beta-adrenoceptor agonists. Pharmaceutical Research. 1998;15:944–949. doi: 10.1023/A:1011993019385. - DOI - PubMed
    1. Zohar O, et al. Thermal imaging of receptor-activated heat production in single cells. Biophysical Journal. 1998;74:82–89. doi: 10.1016/S0006-3495(98)77769-0. - DOI - PMC - PubMed
    1. Sakaguchi R, Kiyonaka S, Mori Y. Fluorescent sensors reveal subcellular thermal changes. Current Opinion in Biotechnology. 2015;31:57–64. doi: 10.1016/j.copbio.2014.07.013. - DOI - PubMed
    1. Lowell BB, Spiegelman BM. Towards a molecular understanding of adaptive thermogenesis. Nature. 2000;404:652–660. - PubMed
    1. Vetrone F, et al. Temperature sensing using fluorescent nanothermometers. Acs Nano. 2010;4:3254–3258. doi: 10.1021/nn100244a. - DOI - PubMed

Publication types

LinkOut - more resources