

Adsorption energy of oxygen molecules on graphene and two-dimensional tungsten disulfide
- PMID: 28496178
- PMCID: PMC5431967
- DOI: 10.1038/s41598-017-01883-1
Adsorption energy of oxygen molecules on graphene and two-dimensional tungsten disulfide
Abstract
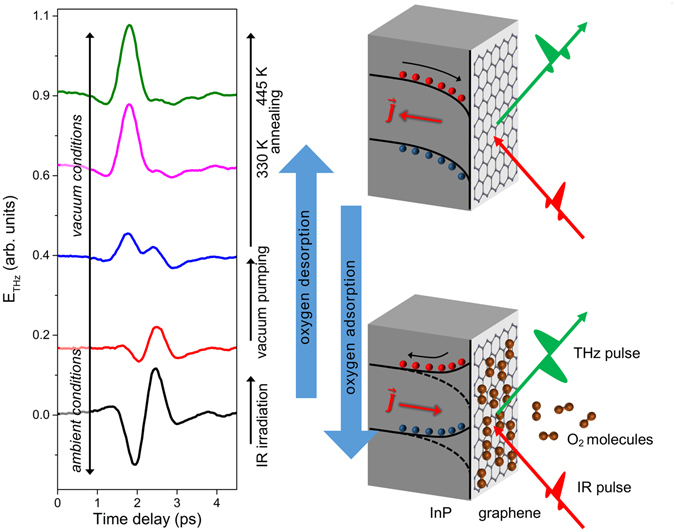
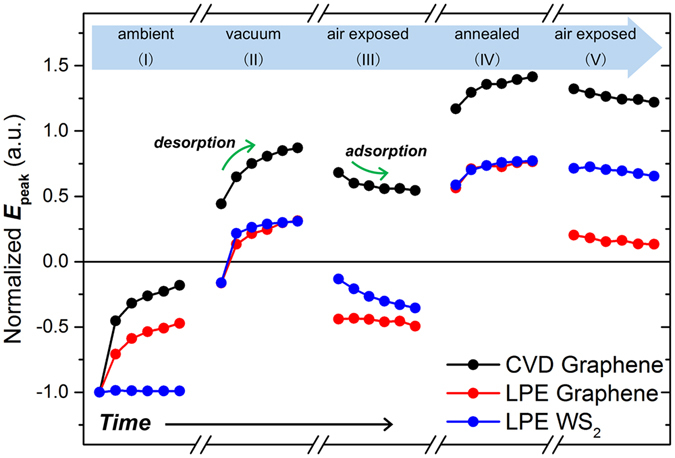
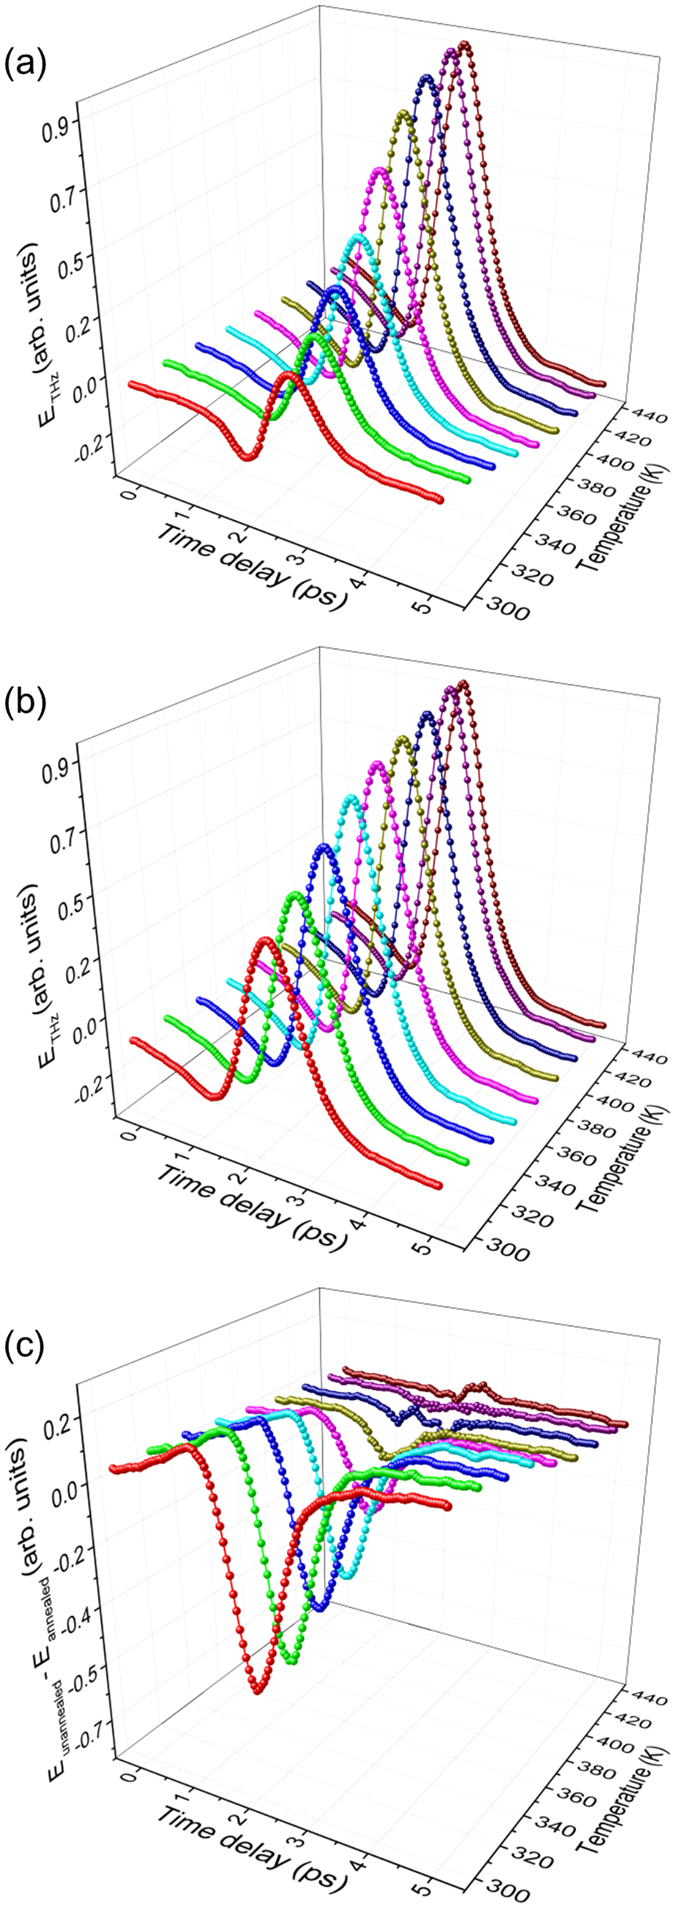
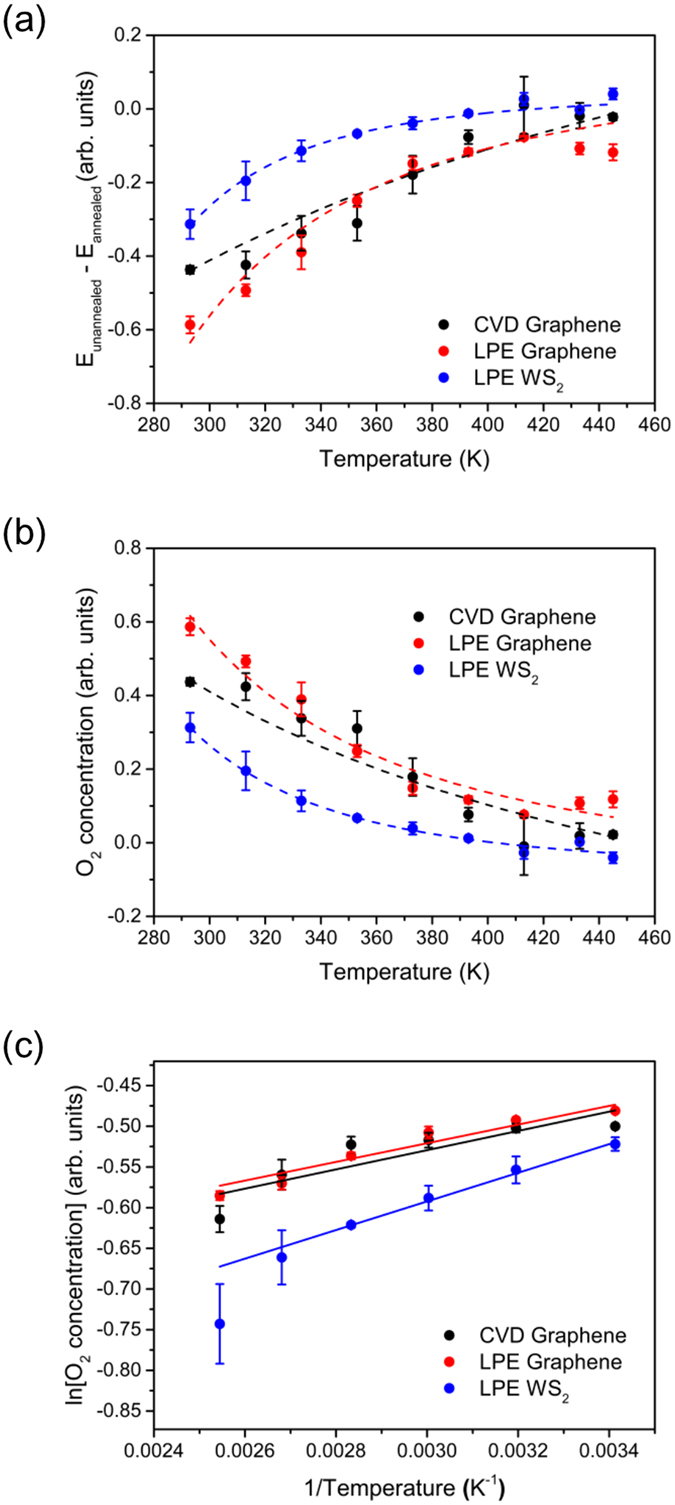
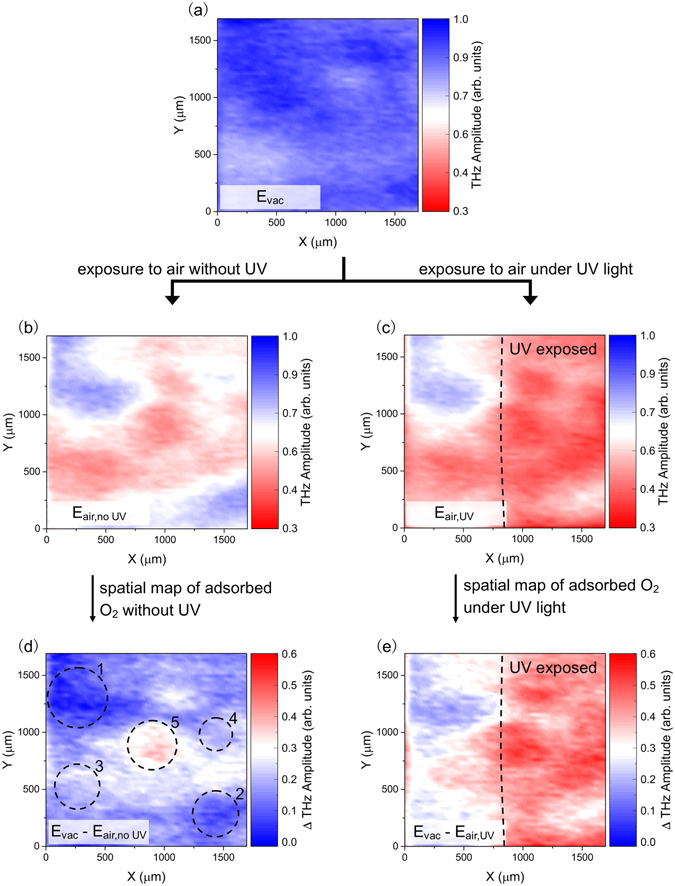
Adsorption of gas molecules on the surface of atomically layered two-dimensional (2D) materials, including graphene and transition metal dichalcogenides, can significantly affect their electrical and optical properties. Therefore, a microscopic and quantitative understanding of the mechanism and dynamics of molecular adsorption and desorption has to be achieved in order to advance device applications based on these materials. However, recent theoretical calculations have yielded contradictory results, particularly on the magnitude of the adsorption energy. Here, we have experimentally determined the adsorption energy of oxygen molecules on graphene and 2D tungsten disulfide using temperature-programmed terahertz (THz) emission microscopy (TPTEM). The temperature dependence of THz emission from InP surfaces covered with 2D materials reflects the change in oxygen concentration due to thermal desorption, which we used to estimate the adsorption energy of oxygen molecules on graphene (~0.15 eV) and tungsten disulphide (~0.24 eV). Furthermore, we used TPTEM to visualize relative changes in the spatial distribution of oxygen molecules on monolayer graphene during adsorption and desorption. Our results provide much insight into the mechanism of molecular adsorption on the surface of 2D materials, while introducing TPTEM as a novel and powerful tool for molecular surface science.
Conflict of interest statement
The authors declare that they have no competing interests.
Figures
Similar articles
-
Terahertz surface and interface emission spectroscopy for advanced materials.J Phys Condens Matter. 2019 Apr 17;31(15):153001. doi: 10.1088/1361-648X/ab00c0. Epub 2019 Jan 22. J Phys Condens Matter. 2019. PMID: 30669133
-
Imaging molecular adsorption and desorption dynamics on graphene using terahertz emission spectroscopy.Sci Rep. 2014 Aug 13;4:6046. doi: 10.1038/srep06046. Sci Rep. 2014. PMID: 25116593 Free PMC article.
-
Noble metal (Ag, Au, Pd and Pt) doped TaS2 monolayer for gas sensing: a first-principles investigation.Phys Chem Chem Phys. 2021 Sep 14;23(34):18359-18368. doi: 10.1039/d1cp02011k. Epub 2021 Aug 18. Phys Chem Chem Phys. 2021. PMID: 34612377
-
In Situ Transmission Electron Microscopy Characterization and Manipulation of Two-Dimensional Layered Materials beyond Graphene.Small. 2017 Sep;13(35). doi: 10.1002/smll.201604259. Epub 2017 Aug 7. Small. 2017. PMID: 28783241 Review.
-
Gas adsorption properties of hybrid graphene-MOF materials.J Colloid Interface Sci. 2018 Mar 15;514:801-813. doi: 10.1016/j.jcis.2017.11.049. Epub 2017 Nov 21. J Colloid Interface Sci. 2018. PMID: 29187296 Review.
Cited by
-
First-principles study of highly sensitive graphene/hexagonal boron nitride heterostructures for application in toxic gas-sensing devices.RSC Adv. 2024 Feb 6;14(7):4904-4916. doi: 10.1039/d3ra08017j. eCollection 2024 Jan 31. RSC Adv. 2024. PMID: 38323020 Free PMC article.
-
Revealing the role of the 1T phase on the adsorption of organic dyes on MoS2 nanosheets.RSC Adv. 2019 Sep 9;9(49):28345-28356. doi: 10.1039/c9ra05427h. eCollection 2019 Sep 9. RSC Adv. 2019. PMID: 35529663 Free PMC article.
-
Tungsten-Embedded Graphene: Theoretical Study on a Potential High-Activity Catalyst toward CO Oxidation.Materials (Basel). 2018 Sep 28;11(10):1848. doi: 10.3390/ma11101848. Materials (Basel). 2018. PMID: 30274145 Free PMC article.
-
Disclosing Fast Detection Opportunities with Nanostructured Chemiresistor Gas Sensors Based on Metal Oxides, Carbon, and Transition Metal Dichalcogenides.Sensors (Basel). 2024 Jan 17;24(2):0. doi: 10.3390/s24020584. Sensors (Basel). 2024. PMID: 38257677 Free PMC article. Review.
-
Kinetics of Direct Reaction of Vanadate, Chromate, and Permanganate with Graphene Nanoplatelets for Use in Water Purification.Nanomaterials (Basel). 2024 Jan 8;14(2):140. doi: 10.3390/nano14020140. Nanomaterials (Basel). 2024. PMID: 38251105 Free PMC article.
References
Publication types
LinkOut - more resources
Full Text Sources
Other Literature Sources
