

Inflammatory Effects of Menthol vs. Non-menthol Cigarette Smoke Extract on Human Lung Epithelial Cells: A Double-Hit on TRPM8 by Reactive Oxygen Species and Menthol
- PMID: 28496415
- PMCID: PMC5406458
- DOI: 10.3389/fphys.2017.00263
Inflammatory Effects of Menthol vs. Non-menthol Cigarette Smoke Extract on Human Lung Epithelial Cells: A Double-Hit on TRPM8 by Reactive Oxygen Species and Menthol
Abstract
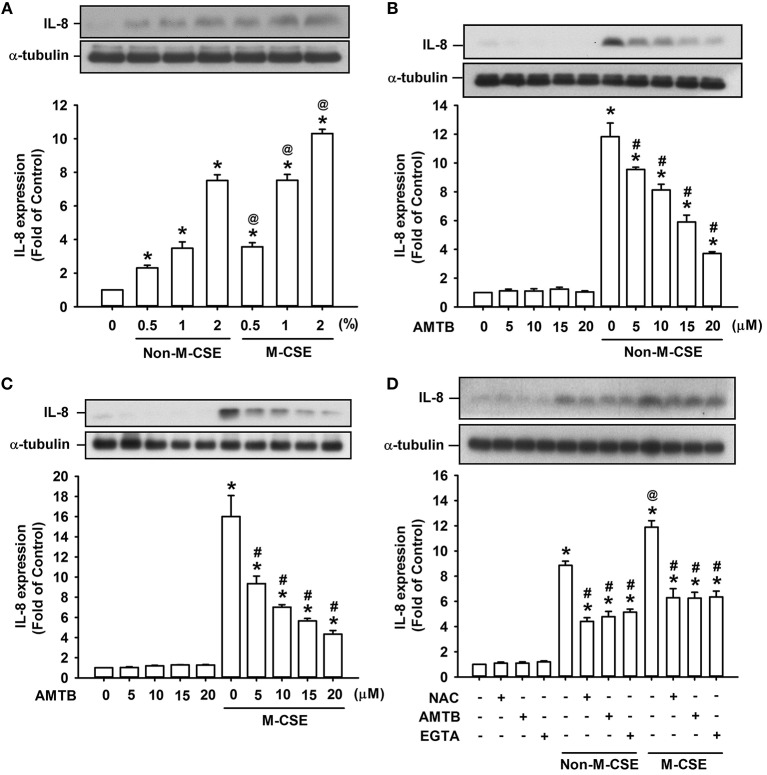
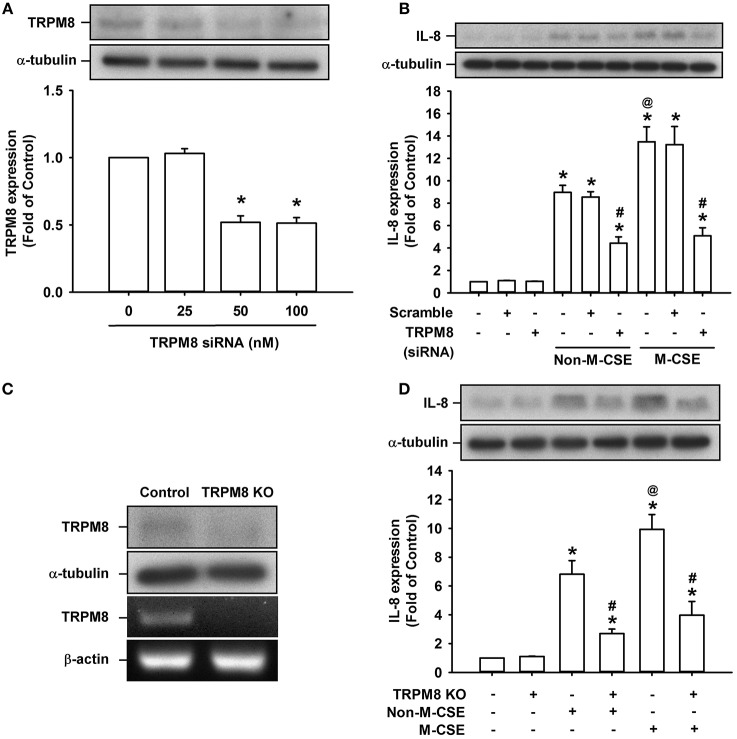
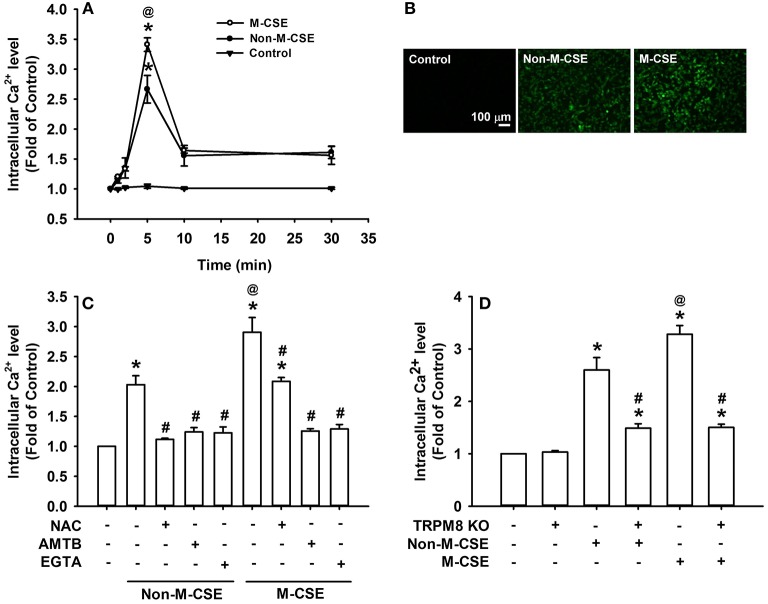
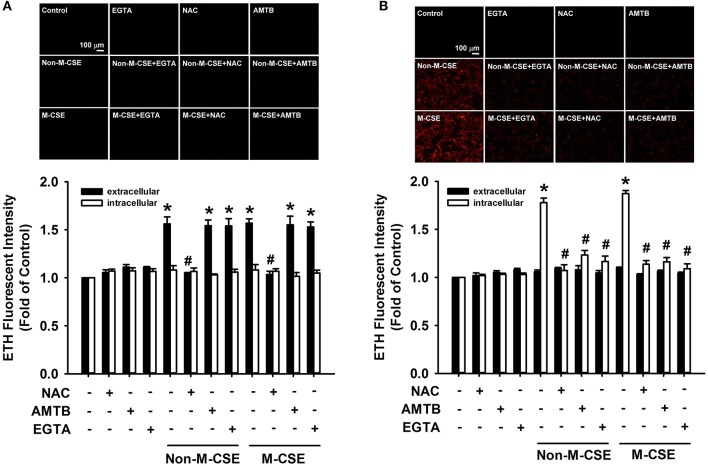
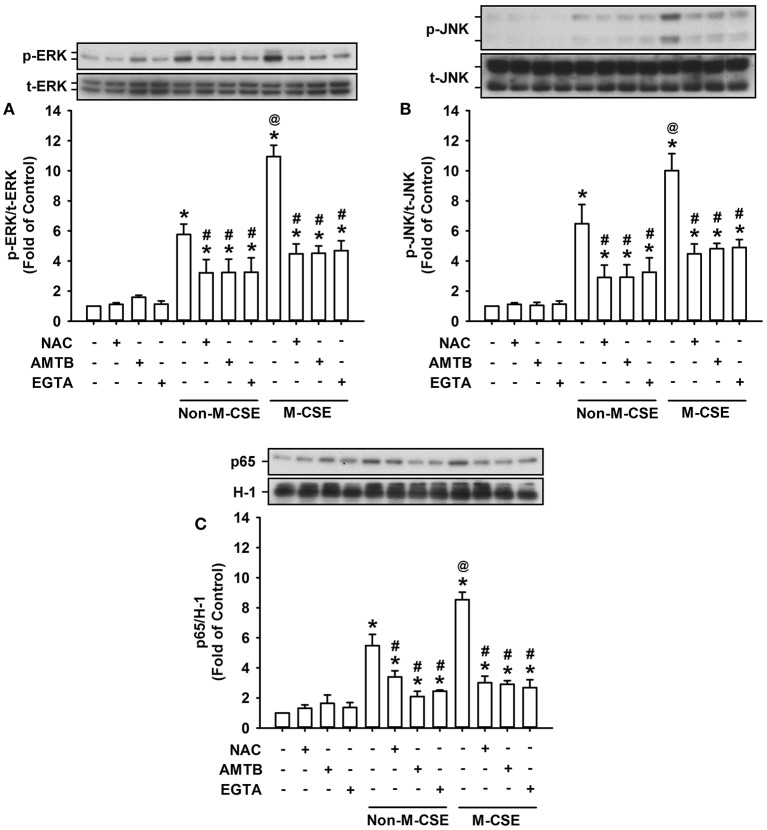
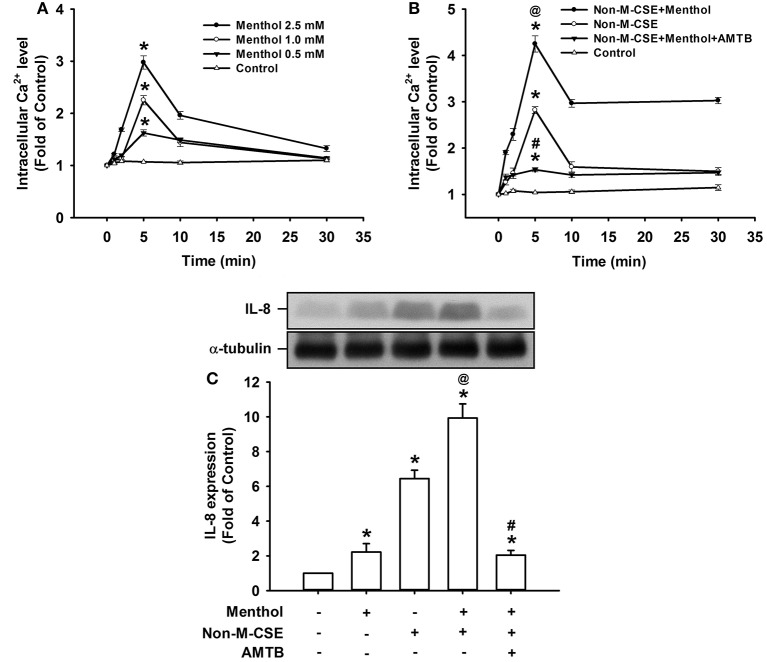
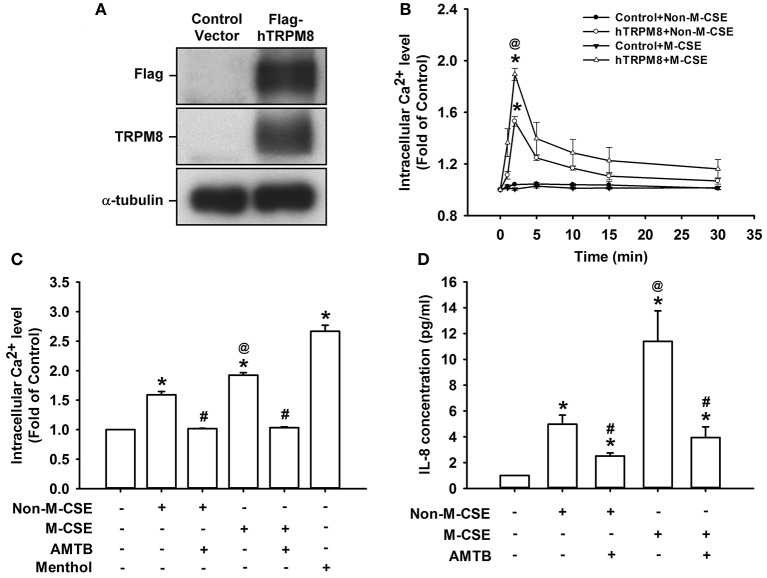
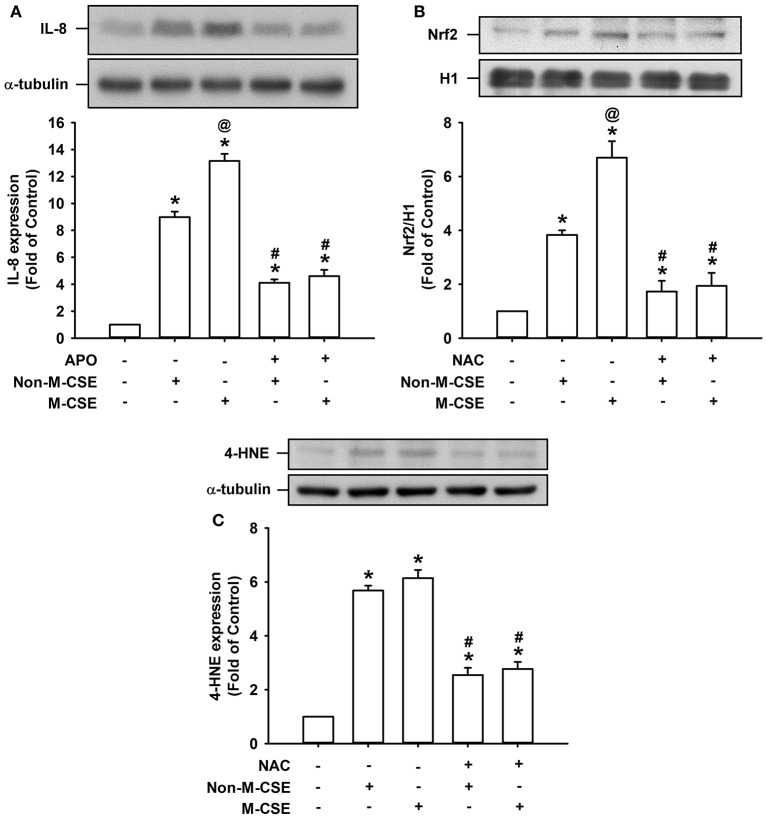
Clinical studies suggest that smokers with chronic obstructive pulmonary disease who use menthol cigarettes may display more severe lung inflammation than those who smoke non-menthol cigarette. However, the mechanisms for this difference remain unclear. Menthol is a ligand of transient receptor potential melastatin-8 (TRPM8), a Ca2+-permeant channel sensitive to reactive oxygen species (ROS). We previously reported that exposure of human bronchial epithelial cells (HBECs) to non-menthol cigarette smoke extract (Non-M-CSE) triggers a cascade of inflammatory signaling leading to IL-8 induction. In this study, we used this in vitro model to compare the inflammatory effects of menthol cigarette smoke extract (M-CSE) and Non-M-CSE and delineate the mechanisms underlying the differences in their impacts. Compared with Non-M-CSE, M-CSE initially increased a similar level of extracellular ROS, suggesting the equivalent oxidant potency. However, M-CSE subsequently produced more remarkable elevations in intracellular Ca2+, activation of the mitogen-activated protein kinases (MAPKs)/nuclear factor-κB (NF-κB) signaling, and IL-8 induction. The extracellular ROS responses to both CSE types were totally inhibited by N-acetyl-cysteine (NAC; a ROS scavenger). The intracellular Ca2+ responses to both CSE types were also totally prevented by NAC, AMTB (a TRPM8 antagonist), or EGTA (an extracellular Ca2+ chelator). The activation of the MAPK/NF-κB signaling and induction of IL-8 to both CSE types were suppressed to similar levels by NAC, AMTB, or EGTA. These results suggest that, in addition to ROS generated by both CSE types, the menthol in M-CSE may act as another stimulus to further activate TRPM8 and induce the observed responses. We also found that menthol combined with Non-M-CSE induced greater responses of intracellular Ca2+ and IL-8 compared with Non-M-CSE alone. Moreover, we confirmed the essential role of TRPM8 in these responses to Non-M-CSE or M-CSE and the difference in these responses between the both CSE types using HBECs with TRPM8 knockdown and TRPM8 knockout, and using HEK293 cells transfected with hTRPM8. Thus, compared with exposure to Non-M-CSE, exposure to M-CSE induced greater TRPM8-mediated inflammatory responses in HBECs. These augmented effects may be due to a double-hit on lung epithelial TRPM8 by ROS generated from CSE and the menthol in M-CSE.
Keywords: TRPM8; calcium; cigarette smoke; lung epithelial cell; lung inflammation; menthol; reactive oxygen species; signaling pathway.
Figures
Similar articles
-
Menthol Cigarette Smoke Induces More Severe Lung Inflammation Than Non-menthol Cigarette Smoke Does in Mice With Subchronic Exposure - Role of TRPM8.Front Physiol. 2018 Dec 18;9:1817. doi: 10.3389/fphys.2018.01817. eCollection 2018. Front Physiol. 2018. PMID: 30618827 Free PMC article.
-
Transient Receptor Potential Melastatin 8 (TRPM8)-Based Mechanisms Underlie Both the Cold Temperature-Induced Inflammatory Reactions and the Synergistic Effect of Cigarette Smoke in Human Bronchial Epithelial (16HBE) Cells.Front Physiol. 2019 Mar 29;10:285. doi: 10.3389/fphys.2019.00285. eCollection 2019. Front Physiol. 2019. PMID: 31001124 Free PMC article.
-
Lung Epithelial TRPA1 Transduces the Extracellular ROS into Transcriptional Regulation of Lung Inflammation Induced by Cigarette Smoke: The Role of Influxed Ca²⁺.Mediators Inflamm. 2015;2015:148367. doi: 10.1155/2015/148367. Epub 2015 Oct 4. Mediators Inflamm. 2015. PMID: 26504357 Free PMC article.
-
Menthol to Induce Non-shivering Thermogenesis via TRPM8/PKA Signaling for Treatment of Obesity.J Obes Metab Syndr. 2021 Mar 30;30(1):4-11. doi: 10.7570/jomes20038. J Obes Metab Syndr. 2021. PMID: 33071240 Free PMC article. Review.
-
Current Knowledge on the Vascular Effects of Menthol.Front Physiol. 2020 Apr 7;11:298. doi: 10.3389/fphys.2020.00298. eCollection 2020. Front Physiol. 2020. PMID: 32317987 Free PMC article. Review.
Cited by
-
Risk factors for acute surgical site infections after lumbar surgery: a retrospective study.J Orthop Surg Res. 2017 Jul 19;12(1):116. doi: 10.1186/s13018-017-0612-1. J Orthop Surg Res. 2017. PMID: 28724387 Free PMC article.
-
Menthol Cigarette Smoke Induces More Severe Lung Inflammation Than Non-menthol Cigarette Smoke Does in Mice With Subchronic Exposure - Role of TRPM8.Front Physiol. 2018 Dec 18;9:1817. doi: 10.3389/fphys.2018.01817. eCollection 2018. Front Physiol. 2018. PMID: 30618827 Free PMC article.
-
Protein profiling in the habenula after chronic (-)-menthol exposure in mice.J Neurochem. 2021 Sep;158(6):1345-1358. doi: 10.1111/jnc.15495. Epub 2021 Sep 2. J Neurochem. 2021. PMID: 34407206 Free PMC article.
-
Acute Eosinophilic Pneumonia Secondary to Menthol Cigarette Use: A Rare Phenomenon With a Review of Literature.J Investig Med High Impact Case Rep. 2020 Jan-Dec;8:2324709620925978. doi: 10.1177/2324709620925978. J Investig Med High Impact Case Rep. 2020. PMID: 32462944 Free PMC article. Review.
-
ADP-Ribose and oxidative stress activate TRPM8 channel in prostate cancer and kidney cells.Sci Rep. 2019 Mar 11;9(1):4100. doi: 10.1038/s41598-018-37552-0. Sci Rep. 2019. PMID: 30858386 Free PMC article.
References
-
- Caraballo R. S., Holiday D. B., Stellman S. D., Mowery P. D., Giovino G. A., Muscat J. E., et al. . (2011). Comparison of serum cotinine concentration within and across smokers of menthol and nonmenthol cigarette brands among non-Hispanic black and non-Hispanic white U.S. adult smokers, 2001–2006. Cancer Epidemiol. Biomarkers Prev. 20, 1329–1340. 10.1158/1055-9965.EPI-10-1330 - DOI - PubMed
LinkOut - more resources
Full Text Sources
Other Literature Sources
Miscellaneous