

On-Chip Fluorescent Labeling using Reversed-phase Monoliths and Microchip Electrophoretic Separations of Selected Preterm Birth Biomarkers
- PMID: 28496521
- PMCID: PMC5421993
- DOI: 10.1039/C6AY01803C
On-Chip Fluorescent Labeling using Reversed-phase Monoliths and Microchip Electrophoretic Separations of Selected Preterm Birth Biomarkers
Abstract
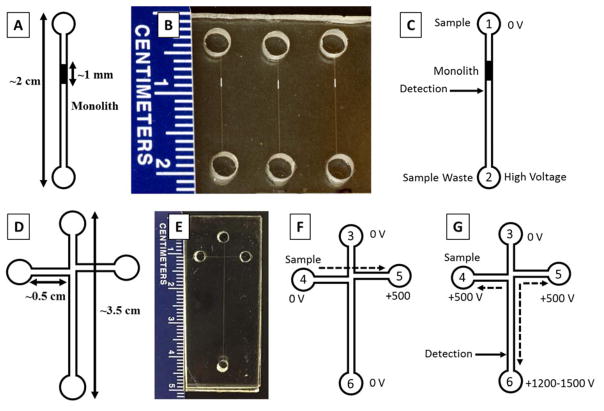
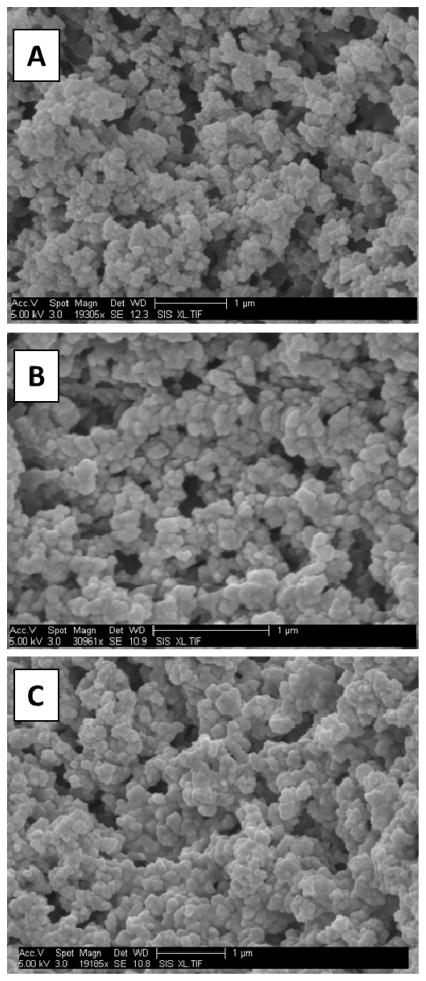
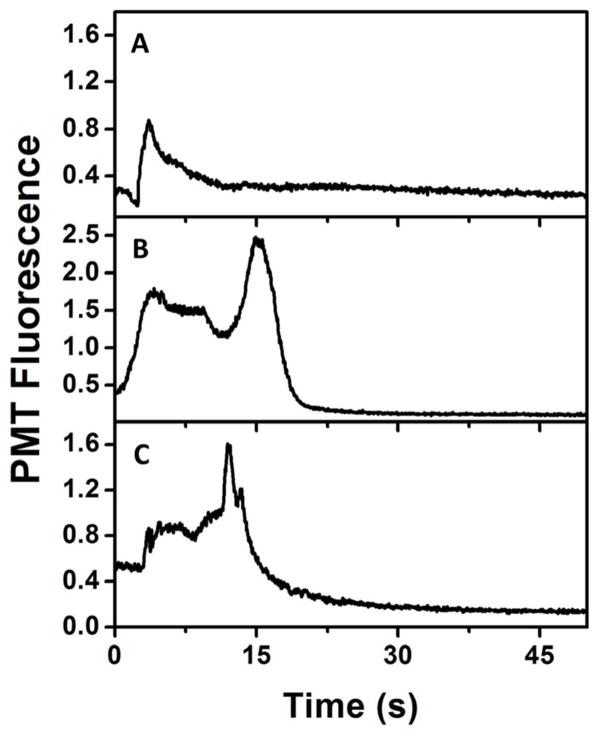
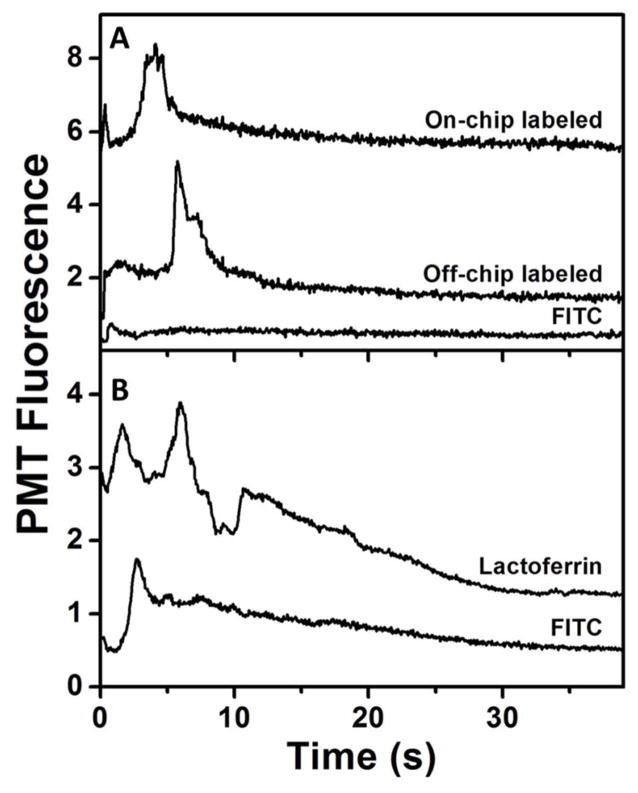
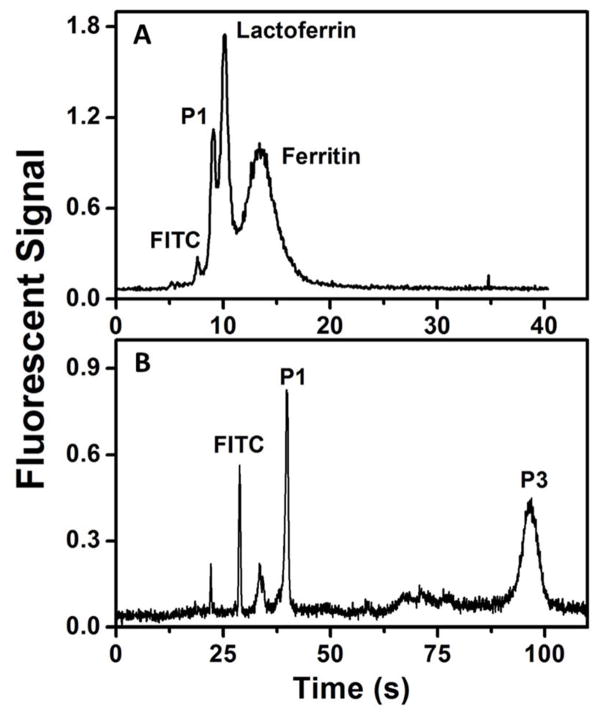
On-chip preconcentration, purification, and fluorescent labeling are desirable sample preparation steps to achieve complete automation in integrated microfluidic systems. In this work, we developed electrokinetically operated microfluidic devices for solid-phase extraction and fluorescent labeling of preterm birth (PTB) biomarkers. Reversed-phase monoliths based on different acrylate monomers were photopolymerized in cyclic olefin copolymer microdevices and studied for the selective retention and elution of a fluorescent dye and PTB biomarkers. Octyl methacrylate-based monoliths with desirable retention and elution characteristics were chosen and used for on-chip fluorescent labeling of three PTB biomarkers. Purification of on-chip labeled samples was done by selective elution of unreacted dye prior to sample. Automated and rapid on-chip fluorescent labeling was achieved with similar efficiency to that obtained for samples labeled off chip. Additionally, protocols for microchip electrophoresis of several off-chip-labeled PTB biomarkers were demonstrated in poly(methyl methacrylate) microfluidic devices. This study is an important step toward the development of integrated on-chip labeling and separation microfluidic devices for PTB biomarkers.
Figures
Similar articles
-
Recent advances in microfluidic sample preparation and separation techniques for molecular biomarker analysis: A critical review.Anal Chim Acta. 2017 Sep 15;986:1-11. doi: 10.1016/j.aca.2017.07.043. Epub 2017 Jul 24. Anal Chim Acta. 2017. PMID: 28870312 Free PMC article. Review.
-
Integrated electrokinetically driven microfluidic devices with pH-mediated solid-phase extraction coupled to microchip electrophoresis for preterm birth biomarkers.Electrophoresis. 2017 Jul;38(13-14):1743-1754. doi: 10.1002/elps.201700054. Epub 2017 Apr 25. Electrophoresis. 2017. PMID: 28272749 Free PMC article.
-
Automated microfluidic devices integrating solid-phase extraction, fluorescent labeling, and microchip electrophoresis for preterm birth biomarker analysis.Anal Bioanal Chem. 2018 Jan;410(3):933-941. doi: 10.1007/s00216-017-0548-7. Epub 2017 Aug 10. Anal Bioanal Chem. 2018. PMID: 28799040 Free PMC article.
-
Microfluidic chips with reversed-phase monoliths for solid phase extraction and on-chip labeling.J Chromatogr A. 2012 Oct 26;1261:129-35. doi: 10.1016/j.chroma.2012.08.095. Epub 2012 Sep 1. J Chromatogr A. 2012. PMID: 22995197 Free PMC article.
-
[In situ photopolymerization of polyacrylamide-based preconcentrator on a microfluidic chip for capillary electrophoresis].Yakugaku Zasshi. 2012;132(9):1031-5. doi: 10.1248/yakushi.132.1031. Yakugaku Zasshi. 2012. PMID: 23023420 Review. Japanese.
Cited by
-
Microchip electrophoresis separation of a panel of preterm birth biomarkers.Electrophoresis. 2018 Sep;39(18):2300-2307. doi: 10.1002/elps.201800078. Epub 2018 Jun 1. Electrophoresis. 2018. PMID: 29683528 Free PMC article.
-
Sequence-specific DNA solid-phase extraction in an on-chip monolith: Towards detection of antibiotic resistance genes.J Chromatogr A. 2017 Nov 10;1523:309-315. doi: 10.1016/j.chroma.2017.07.028. Epub 2017 Jul 10. J Chromatogr A. 2017. PMID: 28734608 Free PMC article.
-
Recent advances in microfluidic sample preparation and separation techniques for molecular biomarker analysis: A critical review.Anal Chim Acta. 2017 Sep 15;986:1-11. doi: 10.1016/j.aca.2017.07.043. Epub 2017 Jul 24. Anal Chim Acta. 2017. PMID: 28870312 Free PMC article. Review.
-
Sequence-specific sepsis-related DNA capture and fluorescent labeling in monoliths prepared by single-step photopolymerization in microfluidic devices.J Chromatogr A. 2018 Aug 10;1562:12-18. doi: 10.1016/j.chroma.2018.05.042. Epub 2018 May 21. J Chromatogr A. 2018. PMID: 29859687 Free PMC article.
-
Integrated electrokinetically driven microfluidic devices with pH-mediated solid-phase extraction coupled to microchip electrophoresis for preterm birth biomarkers.Electrophoresis. 2017 Jul;38(13-14):1743-1754. doi: 10.1002/elps.201700054. Epub 2017 Apr 25. Electrophoresis. 2017. PMID: 28272749 Free PMC article.
References
Grants and funding
LinkOut - more resources
Full Text Sources
Other Literature Sources