. 2017 Apr 19:5:106-115.
doi: 10.1016/j.omtm.2017.04.006. eCollection 2017 Jun 16.

Improved MECP2 Gene Therapy Extends the Survival of MeCP2-Null Mice without Apparent Toxicity after Intracisternal Delivery

Affiliations

Improved MECP2 Gene Therapy Extends the Survival of MeCP2-Null Mice without Apparent Toxicity after Intracisternal Delivery

Sarah E Sinnett et al. Mol Ther Methods Clin Dev. .

Abstract

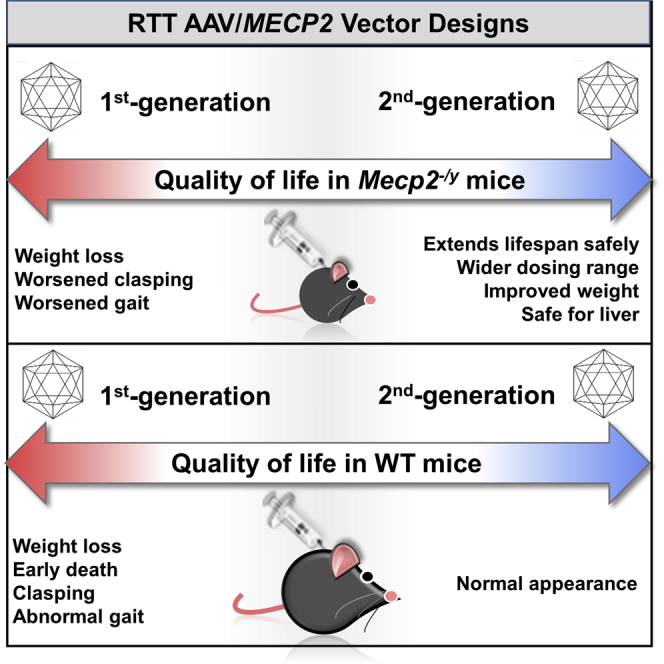
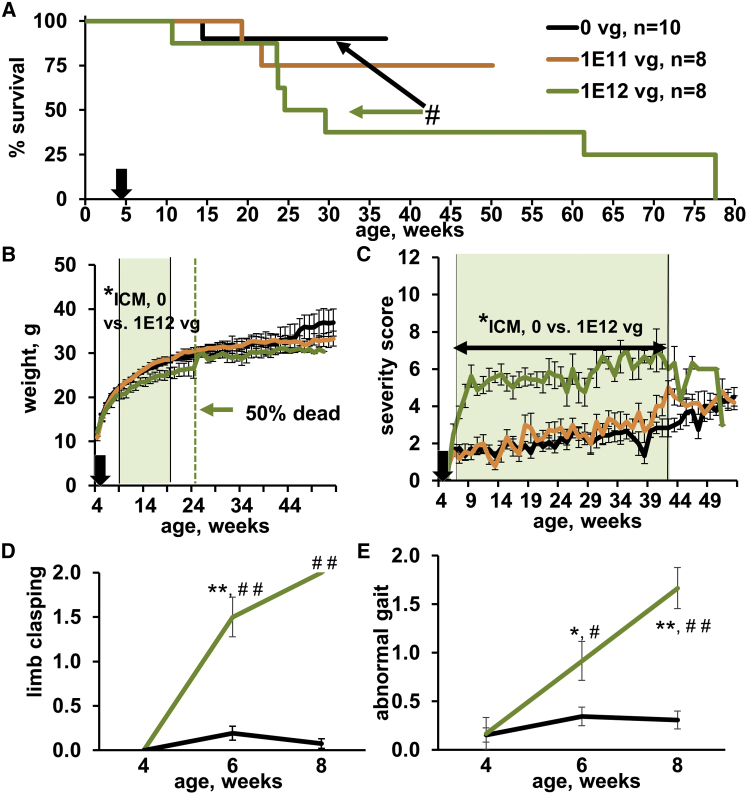
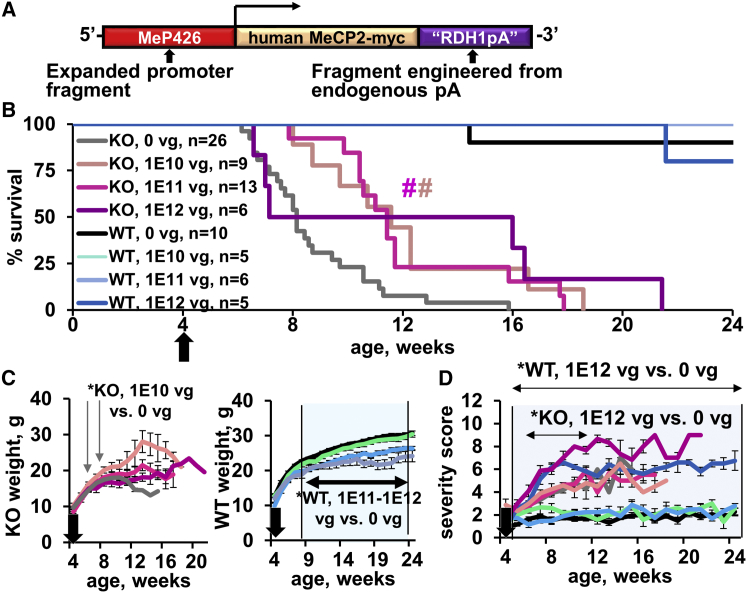
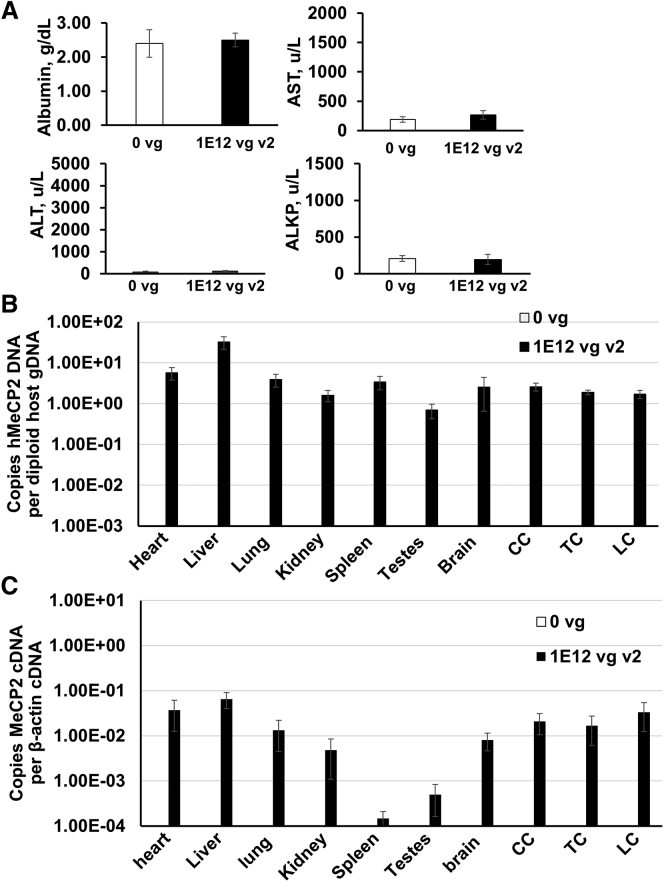
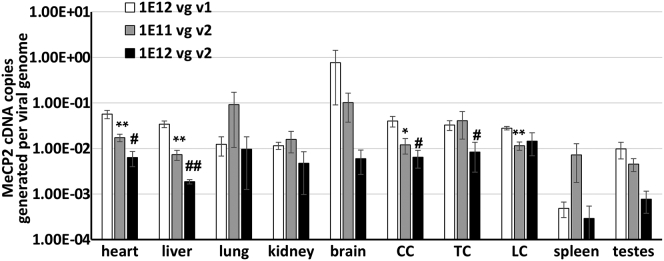
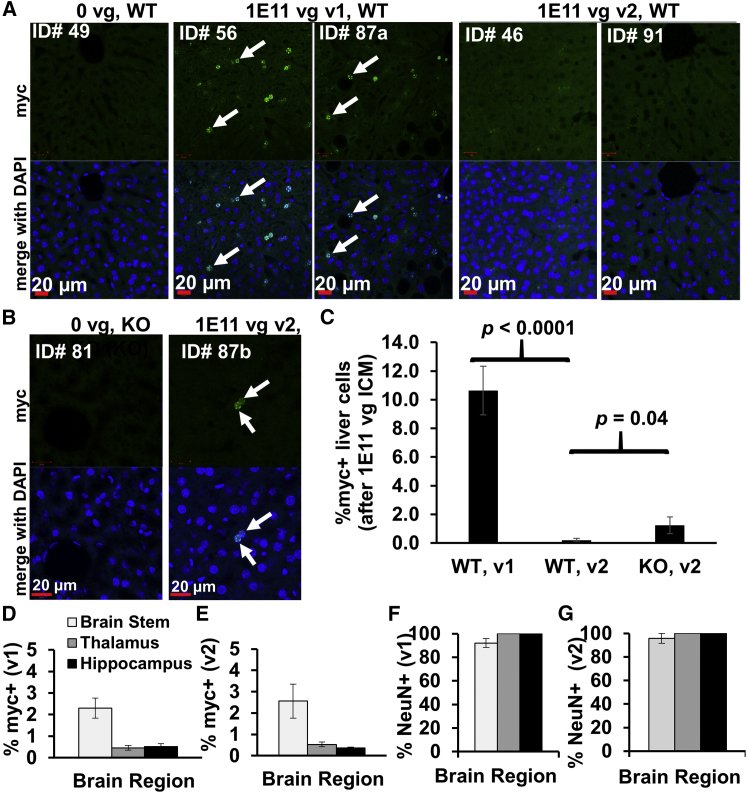
Intravenous administration of adeno-associated virus serotype 9 (AAV9)/hMECP2 has been shown to extend the lifespan of Mecp2-/y mice, but this delivery route induces liver toxicity in wild-type (WT) mice. To reduce peripheral transgene expression, we explored the safety and efficacy of AAV9/hMECP2 injected into the cisterna magna (ICM). AAV9/hMECP2 (1 × 10¹² viral genomes [vg]; ICM) extended Mecp2-/y survival but aggravated hindlimb clasping and abnormal gait phenotypes. In WT mice, 1 × 10¹² vg of AAV9/hMECP2 induced clasping and abnormal gait. A lower dose mitigated these adverse phenotypes but failed to extend survival of Mecp2-/y mice. Thus, ICM delivery of this vector is impractical as a treatment for Rett syndrome (RTT). To improve the safety of MeCP2 gene therapy, the gene expression cassette was modified to include more endogenous regulatory elements believed to modulate MeCP2 expression in vivo. In Mecp2-/y mice, ICM injection of the modified vector extended lifespan and was well tolerated by the liver but did not rescue RTT behavioral phenotypes. In WT mice, these same doses of the modified vector had no adverse effects on survival or neurological phenotypes. In summary, we identified limitations of the original vector and demonstrated that an improved vector design extends Mecp2-/y survival, without apparent toxicity.

Keywords: AAV; MeCP2; Mecp2−/y; Rett syndrome; cisterna magna; intrathecal; microRNA; viral vector.


Figures

None
Graphical abstract
Figure 1
Figure 1
ICM Delivery of AAV9/hMECP2(v1) Extends the Lifespan of Mecp2−/y Mice, but with Deleterious Side Effects (A) One month after ICM injection of 1 × 1012 vg/mouse, modest transduction efficiency is observed throughout the brains of Mecp2−/y mice. Above are confocal images of myc+ cells (indicated by white arrows) in the hippocampus, brain stem, and thalamus. Merged images show anti-myc immunoreactivity (green), anti-NeuN immunoreactivity (red), and DAPI+ nuclei (blue). (B) Left: transduction efficiencies calculated for three brain regions. Right: neuronal tropism calculated for three brain regions. n = 2 injected Mecp2−/y mice, with five to six slices imaged per brain region. (C) AAV9/hMECP2(v1) significantly extends the median lifespan of Mecp2−/y mice from 57 days to 84 days. #p = 0.01 (Gehan-Breslow-Wilcoxon test) for treated Mecp2−/y mice (1 × 1012 vg/mouse, ICM) versus controls (0 vg/mouse, ICM). The legend in (C) also applies to (D)–(G). (C–E) Approximate injection time point indicated by black arrows. (D) AAV9/hMECP2(v1) (red) decreased body weight after ICM injection in 4- to 5-week-old mice. (E) 1 × 1012 vg AAV9/hMECP2(v1) (red) worsens aggregate behavior scores in Mecp2−/y mice after ICM administration. (D and E) Shaded area indicates time during which scores for ICM cohorts (saline versus 1 × 1012 vg) were significantly different. *p < 0.05. (F and G) Specifically, 1 × 1012 vg AAV9/hMECP2(v1) (ICM) aggravates limb clasping and abnormal gait in Mecp2−/y mice. p values (paired t test) for treated Mecp2−/y mice versus their pre-treatment scores: **p ≤ 0.0002; *p ≤ 0.002. p values (unpaired t test) comparing virus- and saline-treated mice at a fixed time point: #p ≤ 0.0006. (H) Examples of virus-treated mice with limb clasping (mouse IDs 43, 47). The older saline-treated and AAV9/GFP-treated Mecp2−/y mice do not yet have hindlimb clasping. Blue arrows point to curled toes and limbs held closely against the body. (B and D–G) Data points are mean ± SEM.
Figure 2
Figure 2
Peripheral Transgene Expression Is Observed after ICM Administration of AAV9/hMECP2(v1) in Mecp2−/y Mice (A) Vector biodistribution in Mecp2−/y mice. (B) Transgene expression in Mecp2−/y mice. (A and B) n = 3 saline-treated mice and n = 5 AAV9/hMECP2(v1)-treated mice. Data are mean ± SEM. CC, cervical spinal cord; LC, lumbar spinal cord; TC, thoracic spinal cord.
Figure 3
Figure 3
ICM Delivery of AAV9/hMECP2(v1) Induces Behavioral Abnormalities in WT Mice (A) AAV9/hMECP2(v1) shortens WT lifespan. Because WT and Mecp2−/y mice were tested in parallel, Figures 3 and 1 present the same data for saline-treated controls. #p = 0.04 (Gehan-Breslow-Wilcoxon test) for treated mice (WT, 1 × 1012 vg, ICM) versus controls (WT, 0 vg, ICM). (A–C) Injection time point is indicated by black arrows. (B and C) Shaded areas indicate times during which saline- and virus-treated cohorts had significantly different body weights or behavior scores; *p < 0.05. (B) 1 × 1012 vg (ICM) AAV9/hMECP2(v1) decreases body weight. Green dashed line at 25 weeks indicates the time point at which 50% of mice treated with 1 × 1012 vg AAV9/hMECP2(v1) (ICM) died. An increased mean weight for survivors is observed after this point. (C) In WT mice, 1 × 1012 vg AAV9/hMECP2(v1) induces behavioral abnormalities that are similar to those observed in Mecp2−/y mice (compare to Figure 1). Abnormalities persist until death. (D and E) AAV9/hMECP2(v1) (ICM) aggravates limb clasping and abnormal gait in WT mice. For clarity, only data for saline-treated and 1 × 1012 vg v1-treated mice are shown. p values (paired t test) for virus-treated WT mice versus their pre-treatment scores: **p = 0.001; *p = 0.04. p values (unpaired t test) comparing virus- and saline-treated mice at a fixed time point: ##p ≤ 0.0001; #p = 0.02. (B–E) Data points are mean ± SEM.
Figure 4
Figure 4
IntraCSF Delivery of AAV9/hMECP2(v2) Extends the Lifespan of Mecp2−/y Mice (A) Cartoon of modified gene expression cassette. Figures 1, 3, and 4 present the same saline-treated control data. (B) 1 × 1010 and 1 × 1011 vg AAV9/hMECP2(v2) extend the median lifespan of Mecp2−/y mice from 57 days to 81 days (#p = 0.01) and 80 days (#p = 0.001), respectively. (B–D) Approximate injection time point indicated by black arrows. (C) Left: gray arrows indicate times at which 1 × 1010 vg AAV9/hMECP2(v2) significantly increases the mean body weight of Mecp2−/y mice. Although the mean weight for Mecp2−/y mice (1 × 1010 vg AAV9/hMECP2(v2)) continued to increase after 8 weeks of age, significant differences (versus the weight of saline-treated mice) were not observed presumably due to the early deaths of saline-treated mice. Right: 1 × 1011 to 1 × 1012 vg AAV9/hMECP2(v2) decrease the mean body weight of WT mice. Shaded areas indicate times during which saline- and virus-treated cohorts had significantly different body weights. To improve clarity, weight data for saline-treated WT mice was offset by +1 g. (D) 1 × 1010 or 1 × 1011 vg modified vector does not rescue aggregate behavior scores in Mecp2−/y mice after intraCSF administration, and at 1 × 1012, it worsened behavioral scores in Mecp2−/y and WT mice (p ≤ 0.05 beginning at 6 and 5 weeks of age for treated Mecp2−/y and WT mice [respectively] versus saline controls). (C and D) Data points are mean ± SEM.
Figure 5
Figure 5
Peripheral Transgene Expression without Hepatic Toxicity Is Observed after ICM Administration of AAV9/hMECP2(v2) in Mecp2−/y mice (A) Blood serum levels of liver toxicity indicators in saline and virus-treated Mecp2−/y mice. No significant differences were observed. p = 0.8 for albumin; p = 0.4 for ALT; p = 0.4 for AST; p = 0.9 for ALKP. n = 5 mice per group. (B) Vector biodistribution in Mecp2−/y mice. High levels of vector DNA are observed in liver cells (relative to background signal). (C) Transgene expression in Mecp2−/y mice. (B and C) n = 3 saline-treated mice and 4 AAV9/hMECP2(v2)-treated mice (1 × 1012 vg/mouse). (A–C) Data are mean ± SEM. CC, cervical spinal cord; LC, lumbar spinal cord; TC, thoracic spinal cord.
Figure 6
Figure 6
AAV9/hMECP2(v2) Provides Tighter Regulation of Transgene Expression In Mecp2−/y mice, the second-generation vector genome generates fewer cDNA copies per viral genome in specific organs. n = 4 to 5 mice per treatment. **p ≤ 0.004 for heart, liver, and lumbar spinal cord; *p = 0.04 for cervical spinal cord; ##p = 0.001 for liver; #p ≤ 0.05 for heart, cervical spinal cord, and thoracic spinal cord. For clarity, p values are only shown for comparisons against mice treated with 1 × 1012 vg AAV9/hMECP2(v1). Data points are mean ± SEM. CC, cervical spinal cord; LC, lumbar spinal cord; TC, thoracic spinal cord.
Figure 7
Figure 7
The hMECP2(v2) Viral Genome Tightly Regulates Transgene Expression in WT Liver Tissue after ICM Administration (A) In WT mice, the hMECP2(v2) viral genome tightly regulates transgene expression in the liver. Arrows point to myc+ cells. (B and C) hMECP2(v2) drives transgene expression in MeCP2 null liver tissue. (C) Percentage of myc+ liver cells (versus all DAPI+ liver cells). n = 3–5 mice and 9–15 imaged sections per group. (D–G) AAV9/hMECP2(v1) and AAV9/hMECP2(v2) yield similar transduction efficiencies and neuronal tropism in treated WT mice. (A–G) A single dose (1 × 1011 vg/mouse) was evaluated for AAV9/hMECP2(v1) and AAV9/hMECP2(v2). (C–G) Data points are mean ± SEM.

Similar articles

Cited by

References

    1. Chapleau C.A., Lane J., Larimore J., Li W., Pozzo-Miller L., Percy A.K. Recent progress in Rett syndrome and MeCP2 dysfunction: assessment of potential treatment options. Future Neurol. 2013;8 - PMC - PubMed
    1. Feldman D., Banerjee A., Sur M. Developmental dynamics of Rett syndrome. Neural Plast. 2016;2016:6154080. - PMC - PubMed
    1. Kirby R.S., Lane J.B., Childers J., Skinner S.A., Annese F., Barrish J.O., Glaze D.G., Macleod P., Percy A.K. Longevity in Rett syndrome: analysis of the North American Database. J. Pediatr. 2010;156:135–138.e1. - PMC - PubMed
    1. Amir R.E., Van den Veyver I.B., Wan M., Tran C.Q., Francke U., Zoghbi H.Y. Rett syndrome is caused by mutations in X-linked MECP2, encoding methyl-CpG-binding protein 2. Nat. Genet. 1999;23:185–188. - PubMed
    1. Shahbazian M.D., Antalffy B., Armstrong D.L., Zoghbi H.Y. Insight into Rett syndrome: MeCP2 levels display tissue- and cell-specific differences and correlate with neuronal maturation. Hum. Mol. Genet. 2002;11:115–124. - PubMed