. 2017 Aug;242(4):448-462.
doi: 10.1002/path.4917.

Modulation of basal cell fate during productive and transforming HPV-16 infection is mediated by progressive E6-driven depletion of Notch

Affiliations

Modulation of basal cell fate during productive and transforming HPV-16 infection is mediated by progressive E6-driven depletion of Notch

Christian Kranjec et al. J Pathol. 2017 Aug.

Abstract

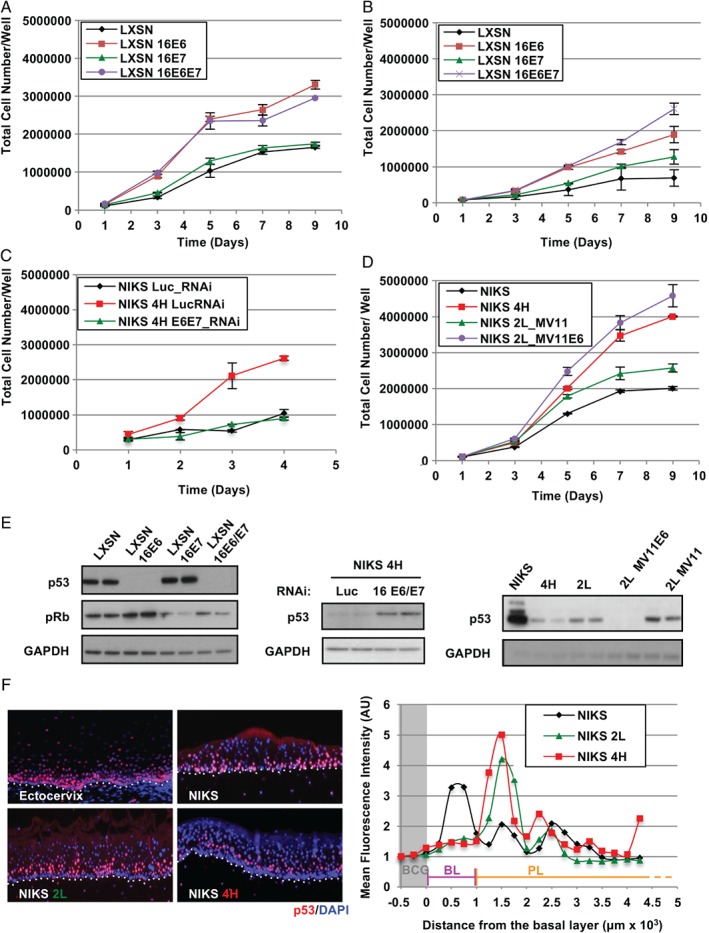
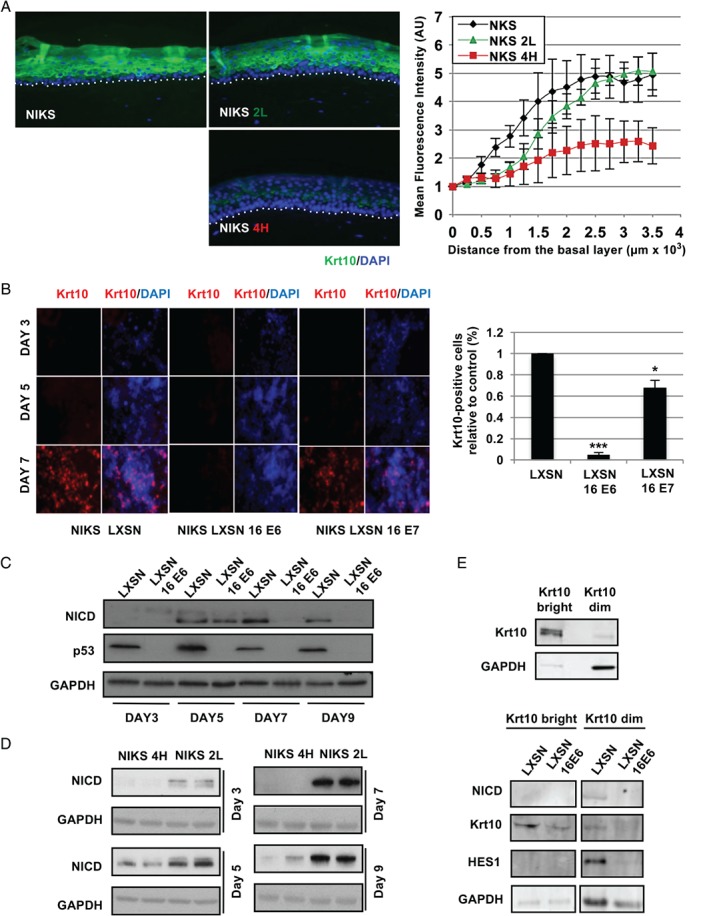
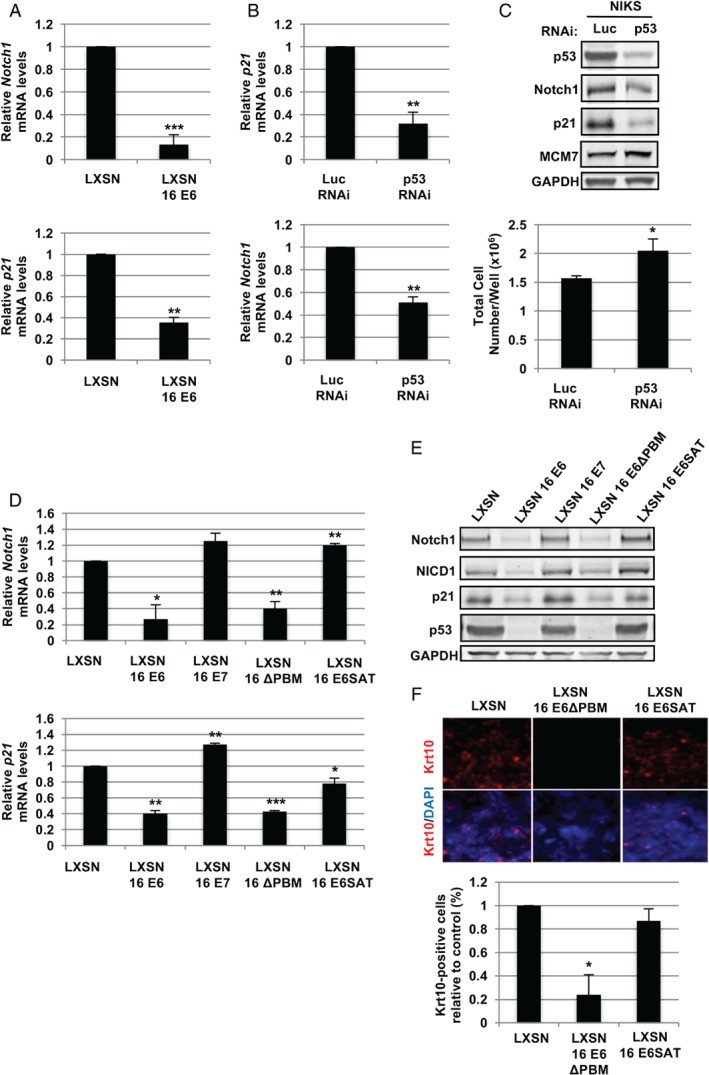
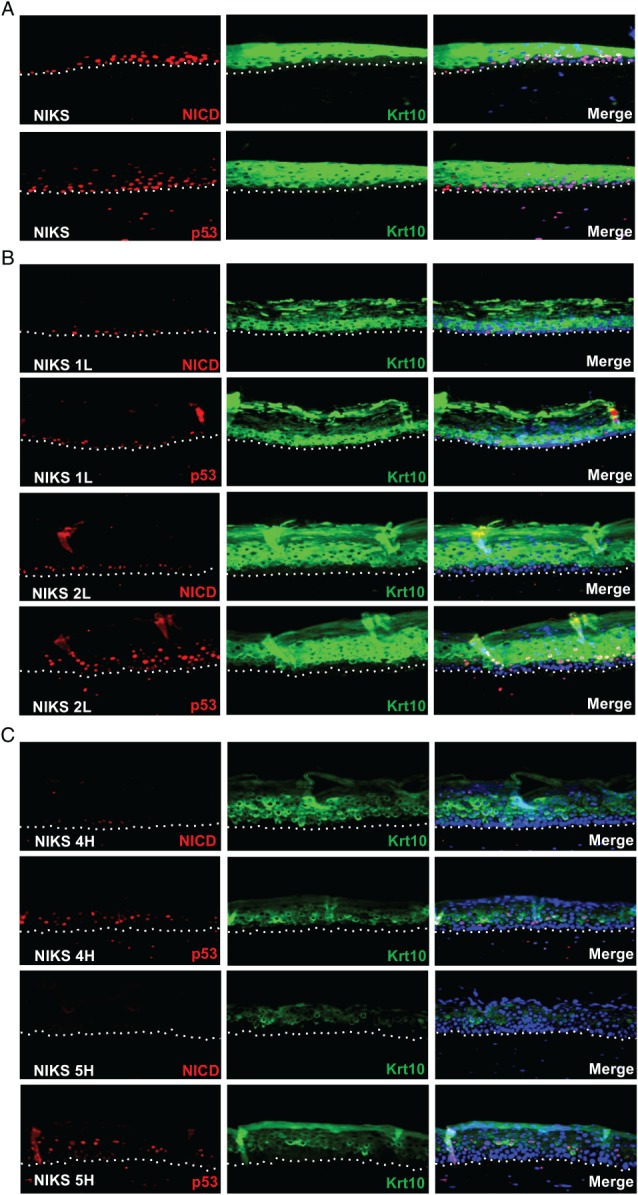
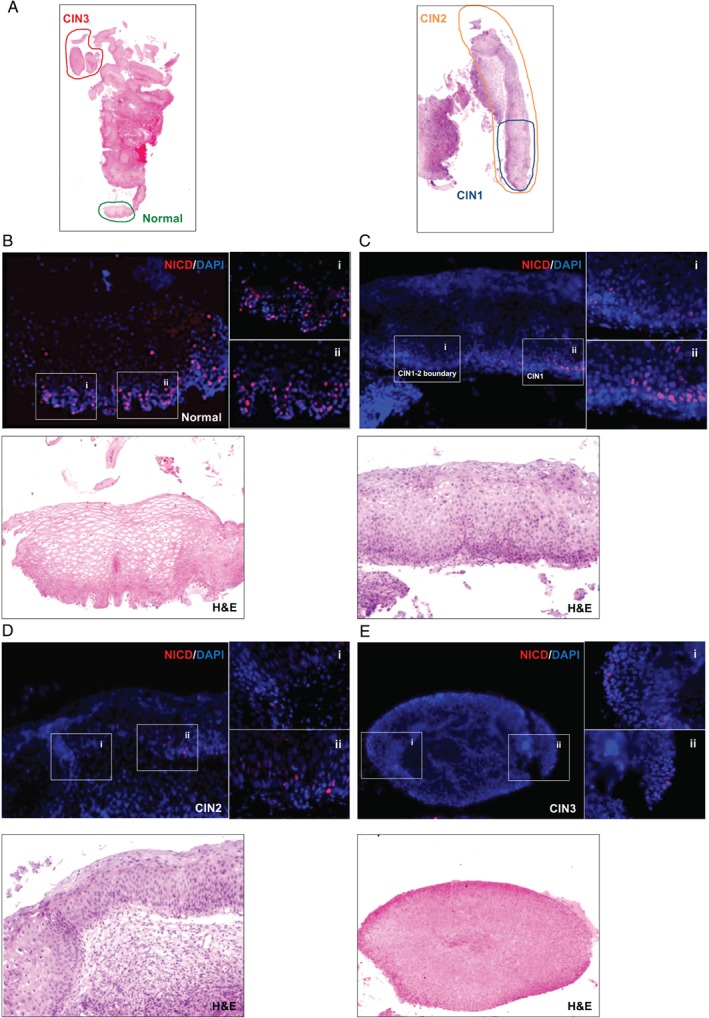
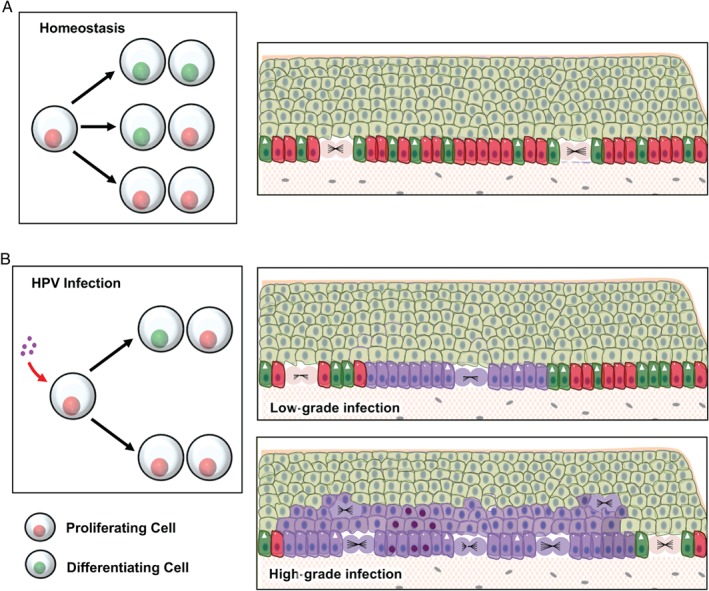
In stratified epithelia such as the epidermis, homeostasis is maintained by the proliferation of cells in the lower epithelial layers and the concomitant loss of differentiated cells from the epithelial surface. These differentiating keratinocytes progressively stratify and form a self-regenerating multi-layered barrier that protects the underlying dermis. In such tissue, the continual loss and replacement of differentiated cells also limits the accumulation of oncogenic mutations within the tissue. Inactivating mutations in key driver genes, such as TP53 and NOTCH1, reduce the proportion of differentiating cells allowing for the long-term persistence of expanding mutant clones in the tissue. Here we show that through the expression of E6, HPV-16 prevents the early fate commitment of human keratinocytes towards differentiation and confers a strong growth advantage to human keratinocytes. When E6 is expressed either alone or with E7, it promotes keratinocyte proliferation at high cell densities, through the combined inactivation of p53 and Notch1. In organotypic raft culture, the activity of E6 is restricted to the basal layer of the epithelium and is enhanced during the progression from productive to abortive or transforming HPV-16 infection. Consistent with this, the expression of p53 and cleaved Notch1 becomes progressively more disrupted, and is associated with increased basal cell density and reduced commitment to differentiation. The expression of cleaved Notch1 is similarly disrupted also in HPV-16-positive cervical lesions, depending on neoplastic grade. When taken together, these data depict an important role of high-risk E6 in promoting the persistence of infected keratinocytes in the basal and parabasal layers through the inactivation of gene products that are commonly mutated in non-HPV-associated neoplastic squamous epithelia. © 2017 The Authors. The Journal of Pathology published by John Wiley & Sons Ltd on behalf of Pathological Society of Great Britain and Ireland.

Keywords: E6; HPV; NICD; Notch; differentiation; p53.


Figures

Figure 1
Figure 1
Dominant role of HPV‐16 E6 in driving the growth of NIKS at high cell densities. (A, B) Effects of E6 and E7 expression on the growth pattern of NIKS cells with (A) or without (B) supplemented growth factors. Each point on the plot represents the average from three independent experiments. Error bars represent mean ± SD. (C) NIKS HPV‐16 4H cells were transfected with E6 and E7 RNAi and grown for the indicated time before harvesting and counting. Error bars represent mean ± SD (n = 3). (D) HPV‐16 E6 was ectopically overexpressed in NIKS 2 L (NIKS 2 L MV11_E6) and the effects on cell growth were monitored by growth assay. Error bars represent mean ± SD (n = 3). (E) Representative western blots validating the expression of HPV‐16 E6 and E7 in the experiments in A, C, and D. Levels of p53 and pRb were monitored as surrogate markers for the expression of E6 and E7, respectively. (F) The pattern of expression of p53 was used as a surrogate marker to locate the expression of E6 in raft culture of NIKS 2 L and 4H episomal cell lines. The p53 fluorescence signal was enhanced using tetramethylrhodamine (TMR) tyramide amplification. All sections were counterstained with 4',6‐diamidino‐2‐phenylindole (DAPI). The fluorescent intensity was quantified in the first 0.17 inches of the raft epithelium and normalized with the background signal (BCG) detected immediately underneath the basal layer. BL = basal layer; PL = parabasal layers.
Figure 2
Figure 2
The expression of HPV‐16 E6 prevents the commitment to differentiation of NIKS keratinocytes. (A) Comparison of the timing of expression of the keratin‐10 (Krt10) differentiation marker during epithelial differentiation in organotypic raft cultures of NIKS or the NIKS 2 L (LSIL‐like) and 4H (HSIL‐like) episomal cell lines. Quantification of the Krt10 fluorescence signal during differentiation is shown in the far‐right panel to highlight differences between the different rafts. The fluorescence intensity was normalized against the background signal and plotted against distance from the basal cell layer. Error bars represent mean ± SD (n = 3). (B) Krt10 expression was monitored by immunofluorescence in monolayers of the indicated NIKS cell lines grown to sub‐confluence (day 3), confluence (day 5), and post‐confluence (day 7). The right‐hand panel shows the quantification of Krt10‐positive cells expressed as a percentage of the total cell population at the 7‐day time point relative to the control (LXSN). Ten random fields were acquired for each sample and cells were counted using ImageJ software. (C, D) Western blot analyses of the modulation of NICD by HPV‐16 E6 in NIKS (C) or in NIKS 2 L and 4H (D) across a 9‐day growth assay. (E) Western blot analysis of components of Notch in Krt10‐high and ‐dim FACS‐sorted NIKS cell populations (see also supplementary material, Figure S4).
Figure 3
Figure 3
HPV‐16 E6 affects the levels of full‐length and cleaved Notch1 through the degradation of p53. (A, B) RT‐qPCR analysis of the expression of Notch1 and p21 mRNA in control and E6‐expressing cells at post‐confluence (day 7) (A) or in NIKS cells transfected with RNAi to luciferase (control) or p53 (B). Each bar chart represents the average values from three independent experiments. Error bars represent mean ± SD. (C) NIKS cells transfected with RNAi as in panel B were subjected to western blot analysis for the indicated proteins (upper panel). The total cell number of NIKS transfected with control or p53 RNAi was estimated 72 h post‐transfection (see also supplementary material, Figure S5). Error bars represent mean ± SD (n = 3). RT‐qPCR analysis of NOTCH1 and P21 mRNA expression in control NIKS (LXSN) and NIKS expressing E6, E7 or the indicated E6 mutants at post‐confluence (day 7). Error bars represent mean ± SD (n = 3). (E) NIKS cell lines as in panel D were grown to post‐confluence and subjected to western blot analysis for the indicated proteins. (F) Control NIKS or NIKS cells expressing either the wt HPV‐16 E6 or the 16E6 SAT and ΔPBM mutants were grown to post‐confluence prior to fixation. The pattern of Krt10 expression was then analysed by immunofluorescence using Alexa Fluor 594‐conjugated secondary antibodies. The lower panel shows the quantification of Krt10‐positive cells expressed as a percentage of the total cell population at the 7‐day time point relative to the control (LXSN). The quantitative analysis was carried out as in Figure 2B using ImageJ software. Where shown, statistical significance was evaluated using the Student's t‐test.
Figure 4
Figure 4
Loss of p53, NICD, and Krt10 expression correlates with abortive infection phenotypes in raft culture. (A–C) Representative images showing the pattern of p53, NICD, and Krt10 expression in organotypic raft culture sections of parental NIKS (A) and LSIL‐like (B) and HSIL‐like (C) NIKS HPV‐16 episomal lines. The fluorescence signal for p53 and NICD was amplified with TMR. Krt10 fluorescence was visualized using Alexa Fluor 488‐conjugated secondary antibodies (see also supplementary material, Figure S9). All sections were counterstained with DAPI.
Figure 5
Figure 5
Loss of NICD expression correlates with abortive infections in the human cervix. (A) Low‐power images of H&E‐stained HPV‐16‐positive cervical lesions. Cervical tissue sections were stained with NICD antibodies followed by TMR tyramide fluorescence signal amplification. Tissue sections were counterstained with DAPI. Digital images of stained sections were acquired with a Pannoramic Slide Scanner prior to counterstaining with H&E. Coloured circles with relative CIN grading (according to pathologist's diagnosis) mark the areas shown in detail in panels B–E. (B–E) Magnified images showing the pattern of NICD staining and relative H&E counterstains in normal cervix (B), CIN1 (C), CIN2 (D), and CIN3 (E) (see also supplementary material, Figure S10).
Figure 6
Figure 6
Proposed model for the modulation of keratinocyte cell fate based on the inactivation of p53 and Notch by E6 expression. (A) Homeostasis in the squamous epithelium is determined by the balanced probability of the outcome of each cell division: two differentiating cells, one differentiating and one proliferating progenitor, and two proliferating progenitors (left panel). According to this model, the fate of each division is stochastic; however, across the total population, the odds of having one of the three possible outcomes is balanced. As a result, in the basal layer the proliferation of progenitor cells (red cells with circles) compensates for the loss of cells by terminal differentiation (green cells with arrowhead). (B) Upon infection with HPV‐16, the inactivation of p53 and Notch leads to an unbalanced fate of cell divisions, with a skew towards proliferation (left panel). In low‐grade lesions (upper‐right panel), reduced levels of p53 and Notch in HPV‐infected (purple) cells allow for the maintenance and expansion of the HPV‐infected pool in the basal layer. However, low levels of E6 and E7 expression allow for an adequate level of keratinocyte differentiation able to sustain the viral life cycle. Its deregulation (lower‐right panel) is thought to be associated with an elevation of E6 and E7 expression. Increased E6 levels further reduce the proportion of differentiating cells within the infected basal cell population, allowing for their clonal expansion and persistence with the colonization of large areas of the epithelium. Increased levels of proliferation and long‐term persistence in the epithelium may eventually lead to the accumulation of oncogenic mutations (cells with dark purple nuclei) predisposing to the development of malignancy.

Similar articles

Cited by

References

    1. Bernard HU, Burk RD, Chen Z, et al Classification of papillomaviruses (PVs) based on 189 PV types and proposal of taxonomic amendments. Virology 2010; 401 : 70–79. - PMC - PubMed
    1. de Villiers EM, Fauquet C, Broker TR, et al Classification of papillomaviruses. Virology 2004; 324: 17‐27. - PubMed
    1. zur Hausen H. Papillomaviruses and cancer: from basic studies to clinical application. Nat Rev Cancer 2002; 2: 342–350. - PubMed
    1. Doorbar J, Quint W, Banks L, et al The biology and life‐cycle of human papillomaviruses. Vaccine 2012; 30 (suppl 5): F55‐F70. - PubMed
    1. Fuchs E. Skin stem cells: rising to the surface. J Cell Biol 2008; 180: 273–284. - PMC - PubMed

Publication types

MeSH terms