R-Ras deficiency does not affect papain-induced IgE production in mice
- PMID: 28497586
- PMCID: PMC5569372
- DOI: 10.1002/iid3.168
R-Ras deficiency does not affect papain-induced IgE production in mice
Abstract
Introduction: R-Ras GTPase has recently been implicated in the regulation of immune functions, particularly in dendritic cell (DC) maturation, immune synapse formation, and subsequent T cell responses.
Methods: Here, we investigated the role of R-Ras in allergen-induced immune response (type 2 immune response) in Rras deficient (R-Ras KO) and wild type (WT) mice.
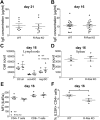
Results: Initially, we found that the number of conventional DC's in the lymph nodes (LNs) was reduced in R-Ras KO mice. The expression of co-stimulatory CD80 and CD86 molecules on these cells was also reduced on DC's from the R-Ras KO mice. However, there was no difference in papain-induced immune response between the R-Ras WT and KO as measured by serum IgE levels after the immunization. Interestingly, neither the DC number nor co-stimulatory molecule expression was different between WT and R-Ras KO animals after the immunization.
Conclusions: Taken together, despite having reduced number of conventional DC's in the R-Ras KO mice and low expression of CD80 on DC's, the R-Ras KO mice are capable of mounting papain-induced IgE responses comparable to that of the WT mice. To our knowledge, this is the first report addressing potential differences in in vivo allergen responses regulated by the R-Ras GTPase.
Keywords: Allergology; IgE; R-Ras; dendritic cells; knock-out mice.
© 2017 The Authors. Immunity, Inflammation and Disease Published by John Wiley & Sons Ltd.
Figures


Similar articles
-
In Vivo Immunological Effects of CD73 Deficiency.Cell Physiol Biochem. 2019;52(5):1192-1202. doi: 10.33594/000000081. Cell Physiol Biochem. 2019. PMID: 31001959
-
The phenotype and function of murine bone marrow-derived dendritic cells is not affected by the absence of VDR or its ability to bind 1α,25-dihydroxyvitamin D3.J Steroid Biochem Mol Biol. 2016 Nov;164:239-245. doi: 10.1016/j.jsbmb.2015.08.010. Epub 2015 Sep 4. J Steroid Biochem Mol Biol. 2016. PMID: 26343449
-
Enhanced suppression of polyclonal CD8+25+ regulatory T cells via exosomal arming of antigen-specific peptide/MHC complexes.J Leukoc Biol. 2017 May;101(5):1221-1231. doi: 10.1189/jlb.3A0716-295RR. Epub 2017 Jan 17. J Leukoc Biol. 2017. PMID: 28096300
-
Piperlongumine Suppresses Dendritic Cell Maturation by Reducing Production of Reactive Oxygen Species and Has Therapeutic Potential for Rheumatoid Arthritis.J Immunol. 2016 Jun 15;196(12):4925-34. doi: 10.4049/jimmunol.1501281. Epub 2016 May 6. J Immunol. 2016. PMID: 27183580
-
Functions of dendritic-cell-bound IgE in allergy.Mol Immunol. 2015 Dec;68(2 Pt A):116-9. doi: 10.1016/j.molimm.2015.05.016. Epub 2015 Jun 4. Mol Immunol. 2015. PMID: 26052071 Free PMC article. Review.
Cited by
-
Proteomics Analysis of R-Ras Deficiency in Oxygen Induced Retinopathy.Int J Mol Sci. 2023 Apr 26;24(9):7914. doi: 10.3390/ijms24097914. Int J Mol Sci. 2023. PMID: 37175621 Free PMC article.
-
Selective Targeting and Tissue Penetration to the Retina by a Systemically Administered Vascular Homing Peptide in Oxygen Induced Retinopathy (OIR).Pharmaceutics. 2021 Nov 15;13(11):1932. doi: 10.3390/pharmaceutics13111932. Pharmaceutics. 2021. PMID: 34834347 Free PMC article.
References
-
- Lowe, D. G. , Capon D. J., Delwart E., Sakaguchi A. Y., Naylor S. L., and Goeddel D. V.. 1987. Structure of the human and murine R‐ras genes, novel genes closely related to ras proto‐oncogenes. Cell 48(1):137–146. - PubMed
-
- Ehrhardt, A. , Ehrhardt G. R., Guo X., and Schrader J. W.. 2002. Ras and relatives‐job sharing and networking keep an old family together. Exp. Hematol. 30(10):1089–1106. - PubMed
-
- Zhang, Z. , Vuori K., Wang H., Reed J. C., and Ruoslahti E.. 1996. Integrin activation by R‐ras. Cell 85(1):61–69. - PubMed
-
- Ada‐Nguema, A. S. , Xenias H., Hofman J. M., Wiggins C. H., Sheetz M. P., and Keely P. J.. 2006. The small GTPase R‐Ras regulates organization of actin and drives membrane protrusions through the activity of PLCepsilon. J. Cell Sci. 119(Pt 7):1307–1319. - PubMed
Publication types
MeSH terms
Substances
LinkOut - more resources
Full Text Sources
Other Literature Sources
Medical
Molecular Biology Databases
Research Materials

