. 2017 May 12:8:15058.
doi: 10.1038/ncomms15058.

BLISS is a versatile and quantitative method for genome-wide profiling of DNA double-strand breaks

Affiliations

BLISS is a versatile and quantitative method for genome-wide profiling of DNA double-strand breaks

Winston X Yan et al. Nat Commun. .

Abstract

Precisely measuring the location and frequency of DNA double-strand breaks (DSBs) along the genome is instrumental to understanding genomic fragility, but current methods are limited in versatility, sensitivity or practicality. Here we present Breaks Labeling In Situ and Sequencing (BLISS), featuring the following: (1) direct labelling of DSBs in fixed cells or tissue sections on a solid surface; (2) low-input requirement by linear amplification of tagged DSBs by in vitro transcription; (3) quantification of DSBs through unique molecular identifiers; and (4) easy scalability and multiplexing. We apply BLISS to profile endogenous and exogenous DSBs in low-input samples of cancer cells, embryonic stem cells and liver tissue. We demonstrate the sensitivity of BLISS by assessing the genome-wide off-target activity of two CRISPR-associated RNA-guided endonucleases, Cas9 and Cpf1, observing that Cpf1 has higher specificity than Cas9. Our results establish BLISS as a versatile, sensitive and efficient method for genome-wide DSB mapping in many applications.


Conflict of interest statement

A patent application has been filed including work described in this publication. F.Z. is a cofounder of Editas Medicine and a scientific advisor for Editas Medicine and Horizon Discovery. The remaining authors declare no competing financial interests.

Figures

Figure 1
Figure 1. Quantitative detection of natural and etoposide-induced DSBs.
(a) Schematic of BLISS. The workflow starts by either fixing cells onto a microscope slide or in a multi-well plate, or by immobilizing already fixed tissue sections onto a slide. DSB ends are then in situ blunted and tagged with dsDNA adapters containing components described in the boxed legend and in Supplementary Data 1. Tagged DSB ends are linearly amplified using in vitro transcription and the resulting RNA is used for Illumina library preparation and sequencing. (b) BLISS reads aligned to an SpCas9 on-target cut site (arrowhead) in the EMX1 gene. Light blue, guide sequence. Orange, PAM sequence. Dark blue, reads mapped to the minus strand. Red, reads mapped to the plus strand. (c) Estimated number of DSBs per cell in three replicates sequenced at increasing sequencing depth. Dashed line, hyperbolic interpolation. (d) Number of DSB locations in etoposide-treated versus control U2OS cells by filtering on the minimum number of UMIs per DSB location. (e) Fraction of DSB locations mapped around the transcription start sites (TSS) in control versus etoposide-treated U2OS cells as a function of the minimum number of UMIs per DSB location. Dashed lines, linear interpolation. Colour shades, 95% confidence intervals. (f) For BLISS on mouse liver, mapping of sequenced DSB ends found in the top 10% (red) and bottom 10% (blue) of expressed genes in the mouse liver. n, number of biological replicates. Dots, mean value. Whiskers, min-max range. Dashed lines, spline interpolation. (g) Percentage of sequenced DSB ends mapped in a ±1 kb interval around the TSS for each inter-decile interval of gene expression in mouse liver. FPKM, fragments per kilobase of transcript per million mapped reads. n, number of biological replicates. Bars, mean value. Whiskers, min–max range. (h) Number of sequenced DSB ends mapped per kilobase inside the gene body of the top 10% and bottom 10% expressed genes in mouse liver. n, number of biological replicates. Whiskers, 2.5–97.5 percentile range. P, Mann–Whitney test.
Figure 2
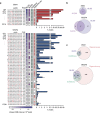
Figure 2. Evaluation of BLISS sensitivity through genome-wide quantification of SpCas9 on- and off-target DSBs.
(a) On- and off-target sites identified by BLISS, BLESS, GUIDEseq and Digenome-seq. BLISS targets were ranked in descending order based on the number of unique DSB ends aligned to the target per 105 unique BLISS reads. Coloured boxes in the BLESS, GUIDEseq and Digenome-seq columns indicate when the BLISS target was previously found by either of these methods. Individual sites were validated by targeted deep sequencing and the percentage of reads containing an insertion or deletion (indel) is shown. (n=3, error bars show s.e.m.). ON, on-target. OT, off-target. (b) Overlap between on- and off-target sites identified by BLISS versus BLESS. (c) Overlap between on- and off-target sites identified by BLISS versus GUIDEseq and Digenome-seq.
Figure 3
Figure 3. Characterization of AsCpf1 and LbCpf1 specificity.
(a) Validated on- and off-target sites for AsCpf1 and LbCpf1 for six separate guide targets as measured by Cpf1-BLISS over two independent biological replicates and validated by targeted NGS (n=3, error bars show s.e.m.). Grey boxes indicate DSB loci not detected within a biological replicate. (b) Evaluating the position-dependent mismatch tolerance of AsCpf1 and LbCpf1 using a repetitive guide with 36,777 predicted genomic loci with single mismatches. (c) A map of mismatch tolerance per position generated by dividing at each base the number of off-targets discovered in BLISS versus the possible single mismatched genomic targets for Cpf1. The grey line plotted on the left y axis is the count of single mismatched targets in the genome for Cpf1 as predicted by Cas OFFinder. (d) Guide designs for investigating the effect of single base pair mismatches in the RNA guide on AsCpf1 and LbCpf1 specificity by measuring the change in their on-target efficiency versus a matched guide. (e) Composite mismatch tolerance model for AsCpf1 and LbCpf1 based on saturated single base pair mismatches for two guides. Cas9 data (green) modelled from existing Cas9 single mismatch data.

References

    1. Madabhushi R. et al.. Activity-induced dna breaks govern the expression of neuronal early-response genes. Cell 161, 1592–1605 (2015). - PMC - PubMed
    1. Schwer B. et al.. Transcription-associated processes cause DNA double-strand breaks and translocations in neural stem/progenitor cells. Proc. Natl Acad. Sci. USA 113, 2258–2263 (2016). - PMC - PubMed
    1. Baudat F., Imai Y. & de Massy B. Meiotic recombination in mammals: localization and regulation. Nat. Rev. Genet. 14, 794–806 (2013). - PubMed
    1. Schatz D. G. & Swanson P. C. V(D)J Recombination: mechanisms of initiation. Annu. Rev. Genet. 45, 167–202 (2011). - PubMed
    1. Negrini S., Gorgoulis V. G. & Halazonetis T. D. Genomic instability--an evolving hallmark of cancer. Nat. Rev. Mol. Cell Biol. 11, 220–228 (2010). - PubMed

Publication types