. 2017 May 12:8:15373.
doi: 10.1038/ncomms15373.

Potent antitumour activity of interleukin-2-Fc fusion proteins requires Fc-mediated depletion of regulatory T-cells

Affiliations

Potent antitumour activity of interleukin-2-Fc fusion proteins requires Fc-mediated depletion of regulatory T-cells

Rodrigo Vazquez-Lombardi et al. Nat Commun. .

Abstract

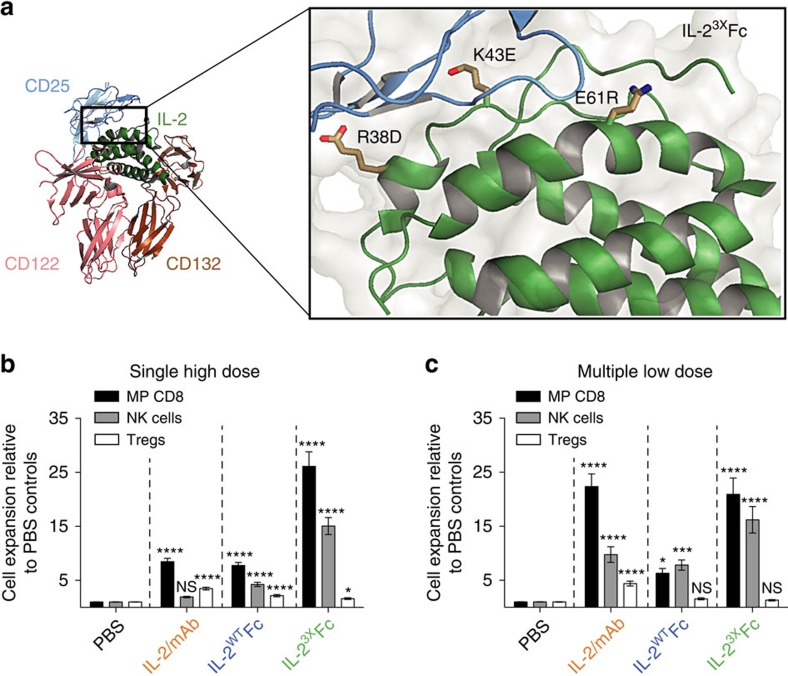
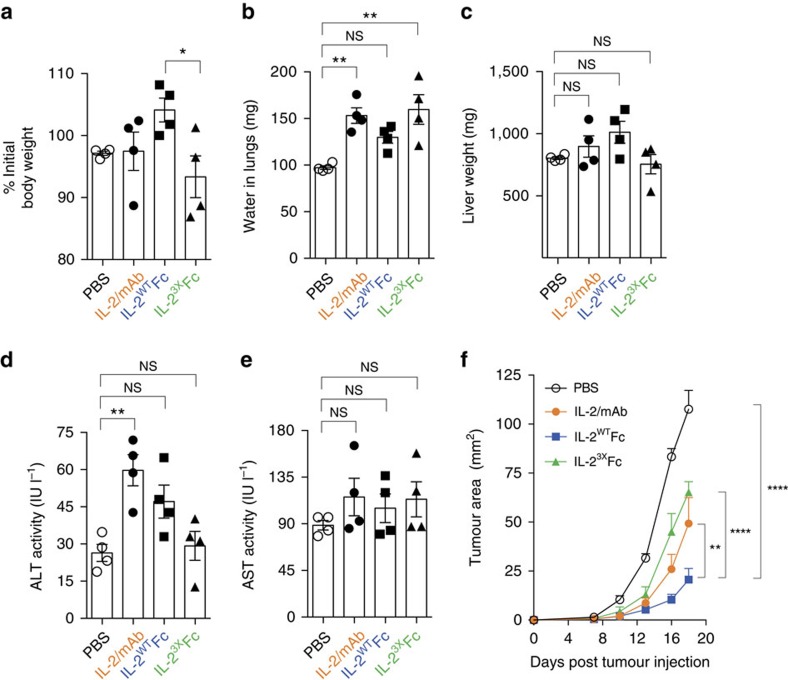
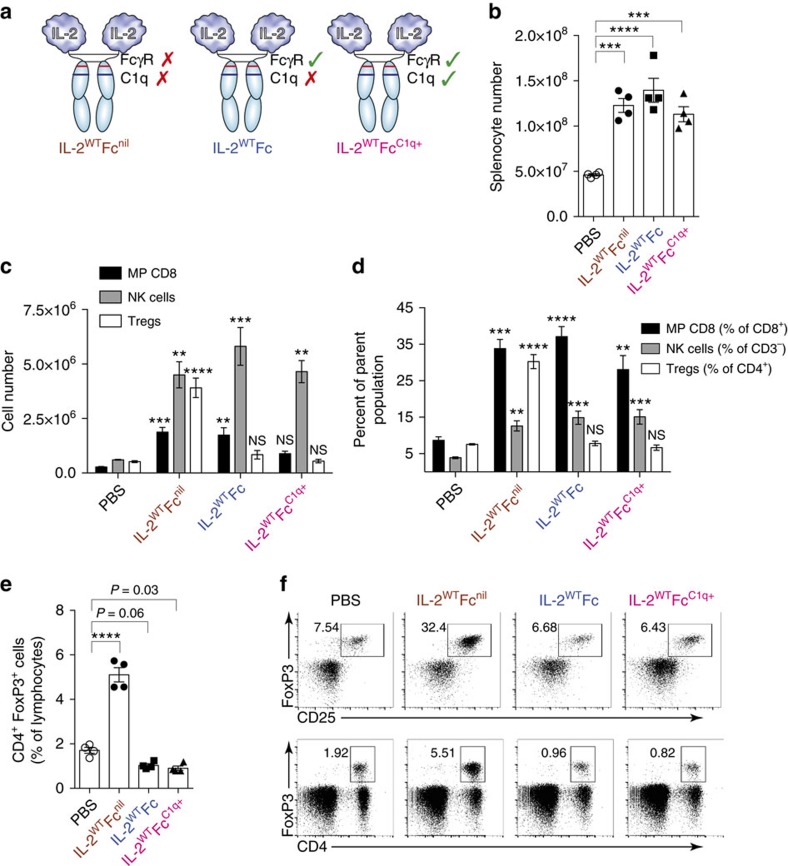
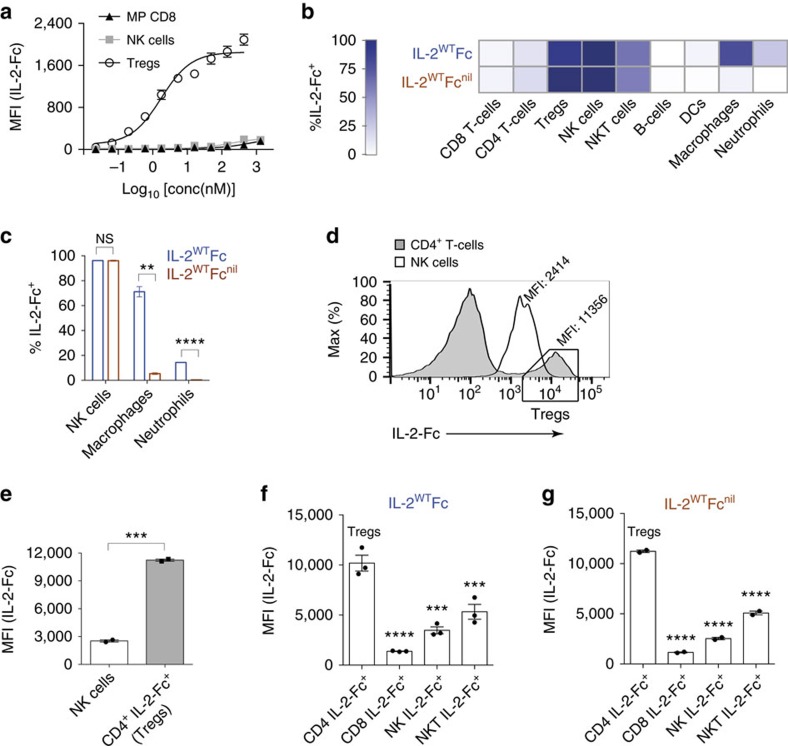
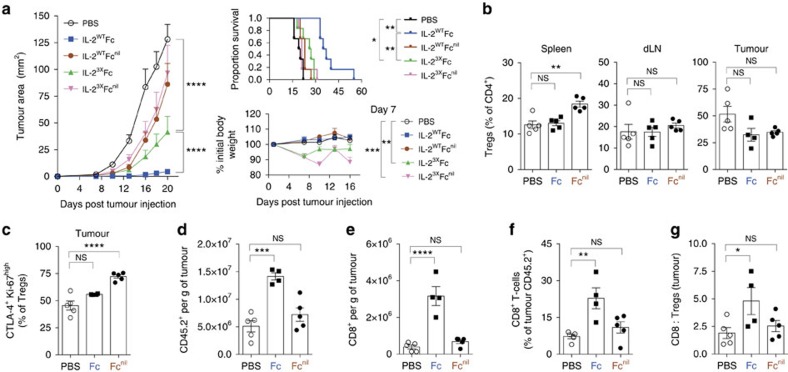
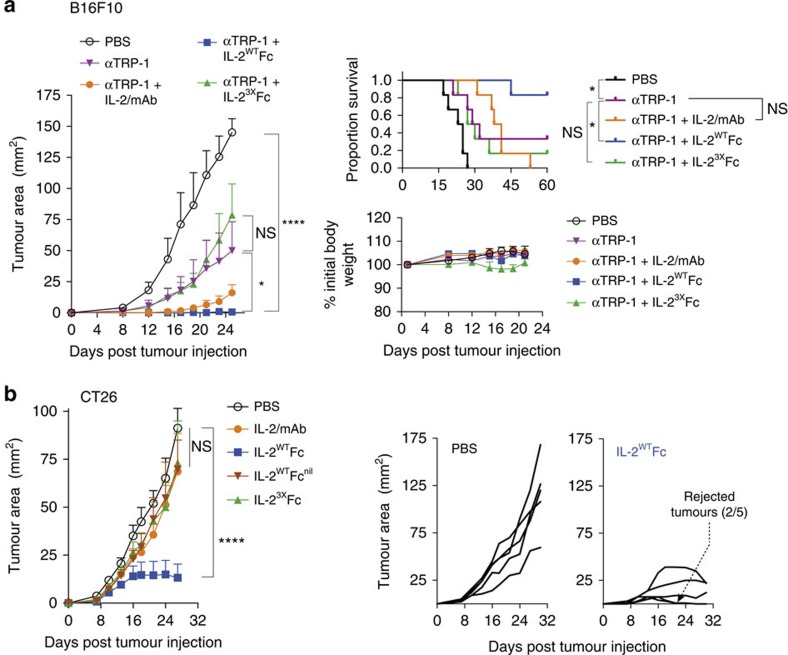
Interleukin-2 (IL-2) is an established therapeutic agent used for cancer immunotherapy. Since treatment efficacy is mediated by CD8+ and NK cell activity at the tumour site, considerable efforts have focused on generating variants that expand these subsets systemically, as exemplified by IL-2/antibody complexes and 'superkines'. Here we describe a novel determinant of antitumour activity using fusion proteins consisting of IL-2 and the antibody fragment crystallizable (Fc) region. Generation of long-lived IL-2-Fc variants in which CD25 binding is abolished through mutation effectively prevents unwanted activation of CD25+ regulatory T-cells (Tregs) and results in strong expansion of CD25- cytotoxic subsets. Surprisingly, however, such variants are less effective than wild-type IL-2-Fc in mediating tumour rejection. Instead, we report that efficacy is crucially dependent on depletion of Tregs through Fc-mediated immune effector functions. Our results underpin an unexpected mechanism of action and provide important guidance for the development of next generation IL-2 therapeutics.


Conflict of interest statement

The authors declare no competing financial interests.

Figures

Figure 1
Figure 1. Abolition of CD25 binding results in potent and selective expansion of cytotoxic lymphocyte subsets.
(a) Selected charge-reversal mutations were introduced into human IL-2 based on inspection of the IL-2/IL-2R co-crystal structure (PDB: 2B51), with the aim of disrupting CD25 binding. Highlighted are the mutations introduced to generate the IL-23XFc triple mutant. R38D and E61R were selected after binding kinetics and cell-based assays (Supplementary Figs 1 and 2), while K43E was incorporated after screening of in vivo activity (Supplementary Fig. 4A–G). (b,c) Lymphocyte expansion profiles in the spleens of C57BL/6 mice receiving IL-2/mAb, IL-2WTFc or IL-23XFc treatment. (b) Fold expansion in the total numbers of memory-phenotype CD8+ T-cells (CD8+ CD44high CD122high), NK cells (CD3 NK1.1+ CD122high) and Tregs (CD4+ FoxP3+ CD25+) after a single IL-2/mAb (3 μg IL-2+15 μg mAb) or IL-2-Fc (16.8 μg) i.p. injection was determined by flow cytometry on day 5. Shown is pooled data from seven independent experiments, each normalized to the average subset numbers of two to three PBS-treated mice (PBS, n=16; treatment groups, n=4–8). (c) Fold expansion in the total numbers of MP CD8, NK cells and Tregs after five IL-2/mAb (1 μg IL-2+5 μg mAb) or IL-2-Fc (5.6 μg) i.p. injections (days 0–4) was determined by flow cytometry on day 5. Shown is pooled data from five independent experiments, each normalized to the average subset numbers of two to three PBS-treated mice (PBS, n=18; treatment groups, n=8). Data are displayed as mean±s.e.m. Asterisks indicate significant differences relative to PBS controls (*P<0.05, ***P<0.001, ****P<0.0001) as determined by one-way analysis of variance with Bonferroni post hoc test for multiple comparisons.
Figure 2
Figure 2. Toxicity profile and antitumour activity of IL-2-Fc variants.
(ae) Symptoms of experimental VLS were assessed in mice receiving five consecutive doses (days 0–4) of IL-2/mAb (1 μg IL-2+5 μg mAb per dose), IL-2WTFc (5.6 μg per dose), IL-23XFc (5.6 μg per dose) or PBS control. Lungs, livers and blood were collected on day 6 for analysis (n=4 mice per group). (a) Body weight on day 6, represented as percentage of initial body weight on day 0. (b) Pulmonary oedema was assessed by measurement of lung water content, with significantly higher accumulation of fluid observed in the IL-2/mAb (P=0.0042) and IL-23XFc (P=0.0018) groups, compared to PBS controls. (ce) Assessment of liver toxicity as measured by total liver weight (c) and serum levels of liver enzymes alanine aminotransferase (ALT, d) and aspartate aminotransferase (AST, e). (f) Tumour growth after subcutaneous inoculation of B16F10 melanoma cells into the flanks of mice treated with five consecutive doses of IL-2/mAb (1 μg IL-2+5 μg mAb per dose), IL-2WTFc (5.6 μg per dose), IL-23XFc (5.6 μg per dose) or PBS control on days 1–5 (n=6). Data are displayed as mean±s.e.m. Asterisks indicate significant differences between specified groups (*P<0.05, **P<0.01, ****P<0.0001) as determined by one-way analysis of variance (ANOVA) (ae) or two-way ANOVA (f) with Bonferroni post hoc test for multiple comparisons.
Figure 3
Figure 3. IL-2WTFc selectively depletes Tregs in a FcγR-dependent manner.
(a) Diagram of produced IL-2-Fc variants showing FcγR and C1q-binding site status. Mutated residues within the Fc region are illustrated in Supplementary Fig. 7A. (bf) Analysis of spleens (day 5) collected from C57BL/6 mice treated with five consecutive 5.6 μg i.p. injections of IL-2WTFcnil, IL-2WTFc, IL-2WTFcC1q+ or PBS control on days 0–4 (n=4). (b) Total live splenocytes counts showing increased lymphoid cellularity after IL-2-Fc treatment. (cf) Flow cytometric analysis of collected splenocytes. (c) Total cell numbers of MP CD8 (CD8+ CD44high CD122high), NK cell (CD3 NK1.1+ CD122high) and Treg (CD4+ FoxP3+ CD25+) cell subsets. (d) Frequencies of MP CD8 (shown as proportion of CD8+), NK cells (proportion of CD3) and Tregs (proportion of CD4+). (e) Frequencies of CD4+ FoxP3+ cells within the lymphocyte compartment showing depletion of this subset after treatment with FcγR-binding IL-2-Fc constructs. (f) Representative flow cytometry dot plots displaying the frequency of regulatory T-cells in treated mice as defined by the co-expression of CD4, FoxP3 and the IL-2-inducible CD25 surface marker (top row, shown as proportion of CD4+) or by expression of CD4 and FoxP3 (bottom row, shown as proportion of total lymphocytes). Data are displayed as mean±s.e.m. Asterisks indicate significant differences relative to PBS controls (c,d) or between specified groups (b,e) as determined by one-way analysis of variance with Bonferroni post hoc test for multiple comparisons (**P<0.01, ***P<0.001, ****P<0.0001).
Figure 4
Figure 4. Depletive IL-2WTFc activity relies on high-affinity targeting of Tregs and interaction with myeloid effector subsets.
(a) Ex vivo flow cytometric detection of labelled IL-2WTFc on the surface of MP CD8, NK cell and Treg subsets after incubation with Fc-blocked FoxP3DTR/GFP splenocytes (n=2 technical replicates). (bg) Cellular biodistribution profiles of fluorescently labelled IL-2WTFc and IL-2WTFcnil in the spleens of treated C56BL/6 mice as determined by flow cytometry 12 h post injection (16.8 μg IL-2-Fc i.p., n=2–3 mice per group). (b) Heat-map representation of the percentages of lymphoid and myeloid subsets bound by IL-2-Fc-fusion proteins (c) Abolition of FcγR binding causes a significant reduction in the percentages of macrophages (P=0.0041) and neutrophils (P<0.0001) bound by fluorescent IL-2-Fc, as determined by two-tailed unpaired Student's t-test. (d) Representative histograms displaying the levels of IL-2WTFcnil present on CD4+ T-cells and NK cells after i.p. injection. Box indicates that the majority of CD4+ IL-2-Fc+ cells are Tregs, as previously shown in Supplementary Fig. 5C. (e) Quantification of d, showing significantly higher IL-2-Fc MFI values in IL-2-Fc+ CD4+ T-cells (boxed cells in d) relative to IL-2-Fc+ NK cells (n=2 mice, two-tailed unpaired Student's t-test, P=0.0004). (f,g) Injected IL-2WTFc (f) and IL-2WTFcnil (g) proteins accumulate to higher levels on the surface of Tregs compared to any other analysed subset. Asterisks indicate significant differences relative to CD4+ IL-2-Fc+ Tregs, as determined by one-way analysis of variance with Bonferroni post hoc test for multiple comparisons (**P<0.01, ***P<0.001, ****P<0.0001). All data are displayed as mean±s.e.m. MFI, mean fluorescence intensity.
Figure 5
Figure 5. Potent antitumour activity of IL-2WTFc is dependent on both FcγR and CD25 binding.
(a) The antitumour activity of IL-2WT and IL-23X fused to either Fc or Fcnil was assessed in the B16F10 melanoma tumour model (n=6). C57BL/6 mice were injected subcutaneously (s.c.) in their left flanks with 1 × 10⁵ B16F10 cells (day 0) and treated with five consecutive doses of IL-2-Fc variants (5.6 μg per dose, i.p.) on days 1–5. Following treatment, mice were monitored for tumour growth (left), survival (top right) and body weight (bottom right). (bg) Flow cytometric analysis of spleens, dLNs (inguinal) and B16F10 tumours collected from mice receiving IL-2WTFc, IL-2WTFcnil or PBS control treatment (n=5). Following s.c. tumour inoculation (day 0), mice received a total of ten doses of IL-2-Fc on days 1–5 and days 14–18 (5.6 μg per dose, i.p.), followed by analysis 48 h after the last dose (day 20). (b) Frequency of FoxP3+ cells (percentage of CD4+) in the spleen, dLNs and tumours. (c) Frequency of CTLA-4+ Ki-67high intratumoural Tregs (percentage of CD4+ FoxP3+ cells). (de) Numbers of infiltrating CD45.2+ leukocytes (d) and CD8+ T-cells (e) per gram of tumour. (f) Frequency of tumour-infiltrating CD8+ T-cells, shown as percentage of CD45.2+ cells. (g) Intratumoural ratio of CD8+ to regulatory T-cells, as calculated from their relative proportions in the CD45.2+ compartment. dLNs, draining lymph nodes; one mouse in the IL-2WTFc group did not develop a tumour. Data are displayed as mean±s.e.m. Asterisks indicate significant differences between specified groups (*P<0.05, **P<0.01, ***P<0.001, ****P<0.0001) as determined by one-way analysis of variance (ANOVA) (bg) or two-way ANOVA (a) with Bonferroni post hoc test for multiple comparisons. Survival (a, top right) is displayed using Kaplan–Meier plots and compared by the Gehan–Breslow–Wilcoxon test.
Figure 6
Figure 6. IL-2WTFc treatment synergizes with targeted antibody therapy and is highly efficacious against murine colorectal carcinoma.
(a) The antitumour activity of IL-2/mAb, IL-2WTFc and IL-23XFc in combination with the anti-TRP-1 tumour-targeting monoclonal antibody was assessed in the B16F10 melanoma tumour model. C57BL/6 mice were injected subcutaneously (s.c.) in their left flanks with 1 × 10⁵ B16F10 cells on day 0 (n=6). Combination therapy consisted of three doses of anti-TRP-1 (200 μg per dose given i.p. on days 3, 6 and 9) plus low-dose IL-2/mAb (0.5 μg IL-2+2.5 μg mAb per dose) or molar IL-2-Fc equivalent (2.8 μg per dose) given i.p. on days 4, 7 and 10. Following treatment, mice were monitored for tumour growth (left), body weight (bottom right) and survival (top right). (b) The antitumour activity of IL-2/mAb, IL-2WTFc, IL-23XFc and IL-2WTFcnil was assessed in the CT26 murine colorectal carcinoma tumour model. Balb/c mice were injected s.c. in their left flanks with 1 × 10⁵ CT26 cells on day 0 (n=5), followed by treatment with a total of nine doses of IL-2/mAb (1 μg IL-2+5 μg mAb per dose), IL-2-Fc molar equivalent (5.6 μg per dose) or PBS control given i.p. on days 1–5 and days 13, 15, 17 and 19. Mean tumour size (left) and tumour growth in individual mice in the PBS and IL-2WTFc groups (right) are shown. Data are displayed as mean±s.e.m. Asterisks indicate significant differences between specified groups (*P<0.05, ****P<0.0001) as determined by two-way analysis of variance with Bonferroni post hoc test for multiple comparisons. Survival (a, top right) is displayed using Kaplan–Meier plots and compared by the Gehan–Breslow–Wilcoxon test.

Similar articles

Cited by

References

    1. Boyman O. & Sprent J. The role of interleukin-2 during homeostasis and activation of the immune system. Nat. Rev. Immunol. 12, 180–190 (2012). - PubMed
    1. Morgan D. A., Ruscetti F. W. & Gallo R. Selective in vitro growth of T-lymphocytes from normal human bone marrows. Science 193, 1007–1008 (1976). - PubMed
    1. Devos R. et al.. Molecular-cloning of human interleukin-2 carrier DNA and its expression in Escherichia coli. Nucleic Acids Res. 11, 4307–4323 (1983). - PMC - PubMed
    1. Taniguchi T. et al.. Structure and expression of a cloned cDNA for human interleukin-2. Nature 302, 305–310 (1983). - PubMed
    1. Lotze M. T. et al.. High-dose recombinant interleukin 2 in the treatment of patients with disseminated cancer: responses, treatment-related morbidity, and histologic findings. JAMA 256, 3117–3124 (1986). - PubMed

Publication types

MeSH terms