. 2017 May 12:8:15233.
doi: 10.1038/ncomms15233.

Phosphorylation induces sequence-specific conformational switches in the RNA polymerase II C-terminal domain

Affiliations

Phosphorylation induces sequence-specific conformational switches in the RNA polymerase II C-terminal domain

Eric B Gibbs et al. Nat Commun. .

Abstract

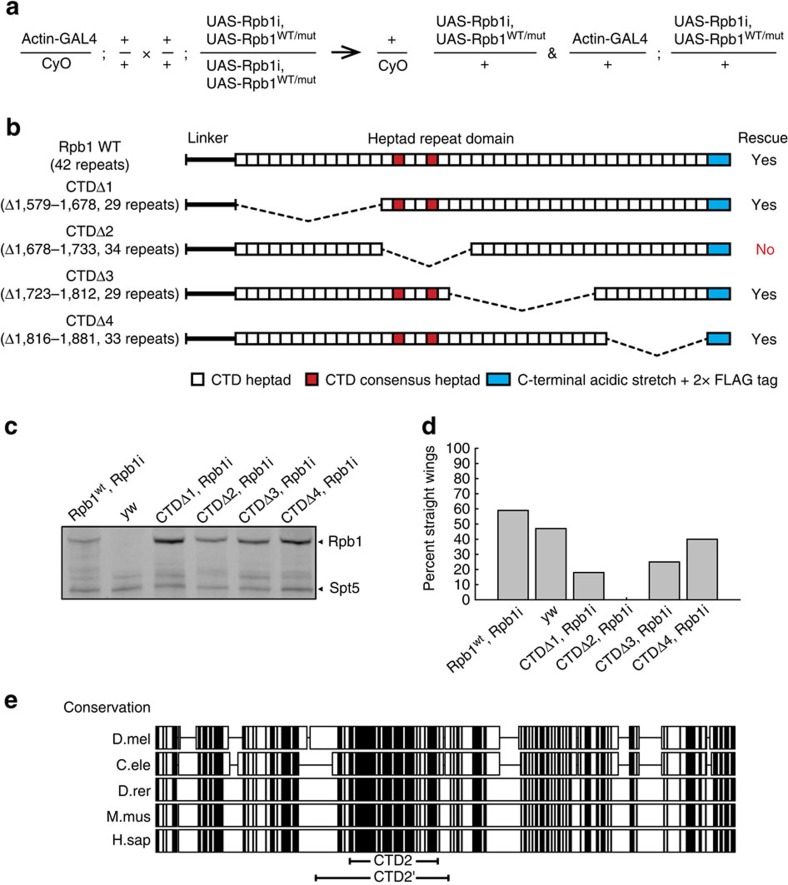
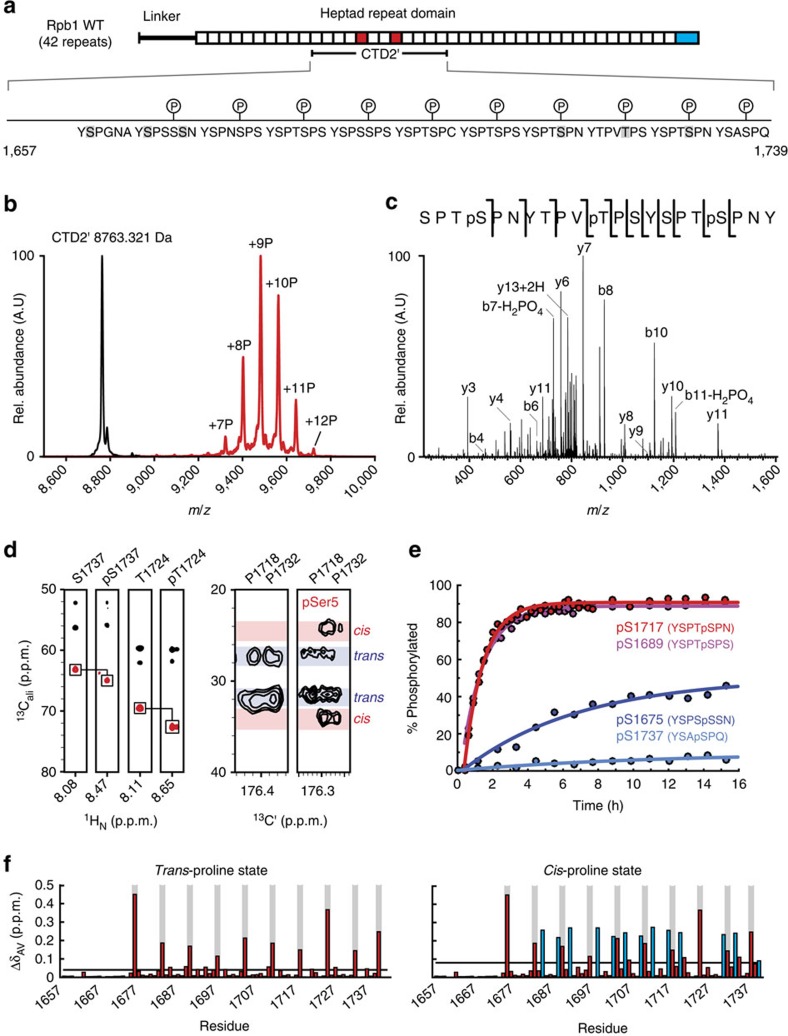
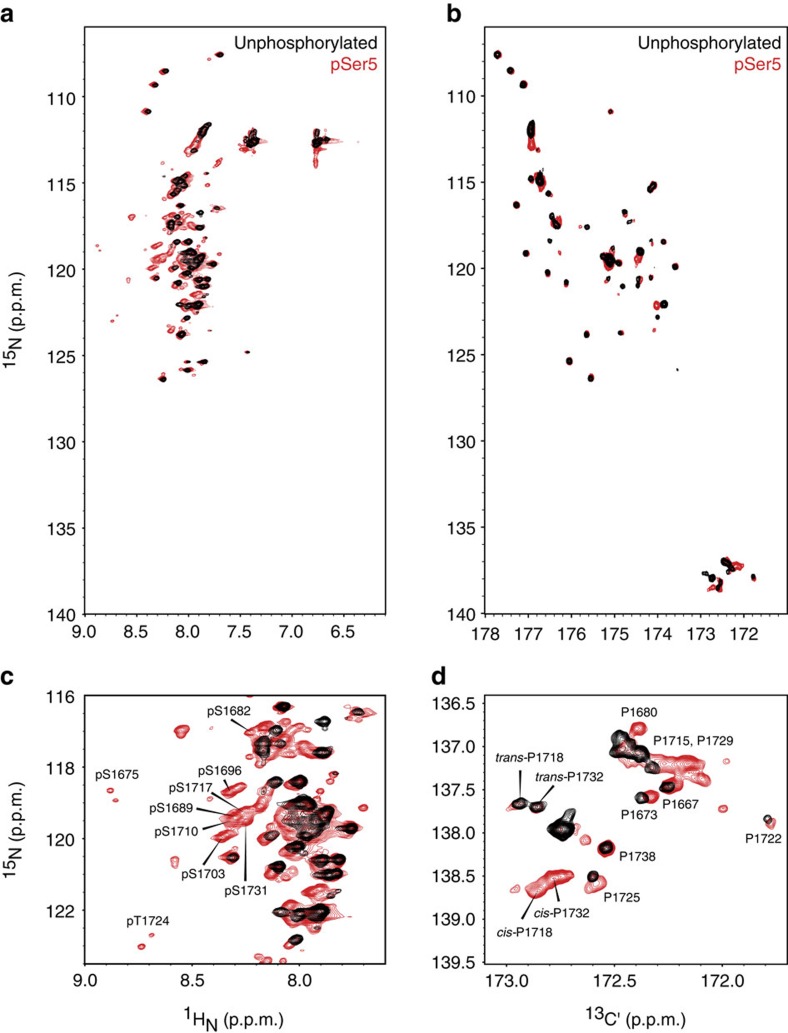
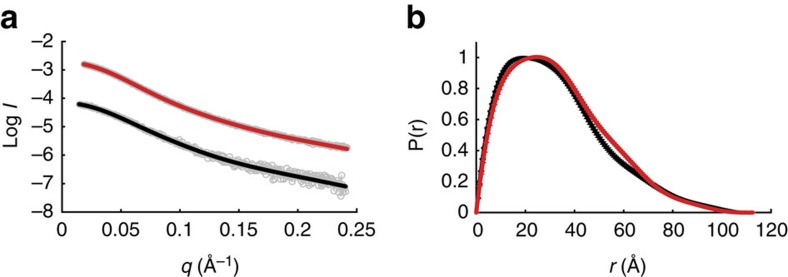
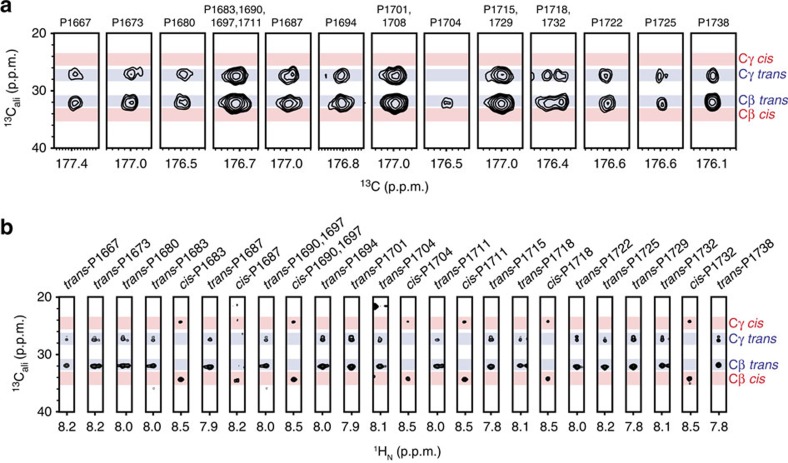
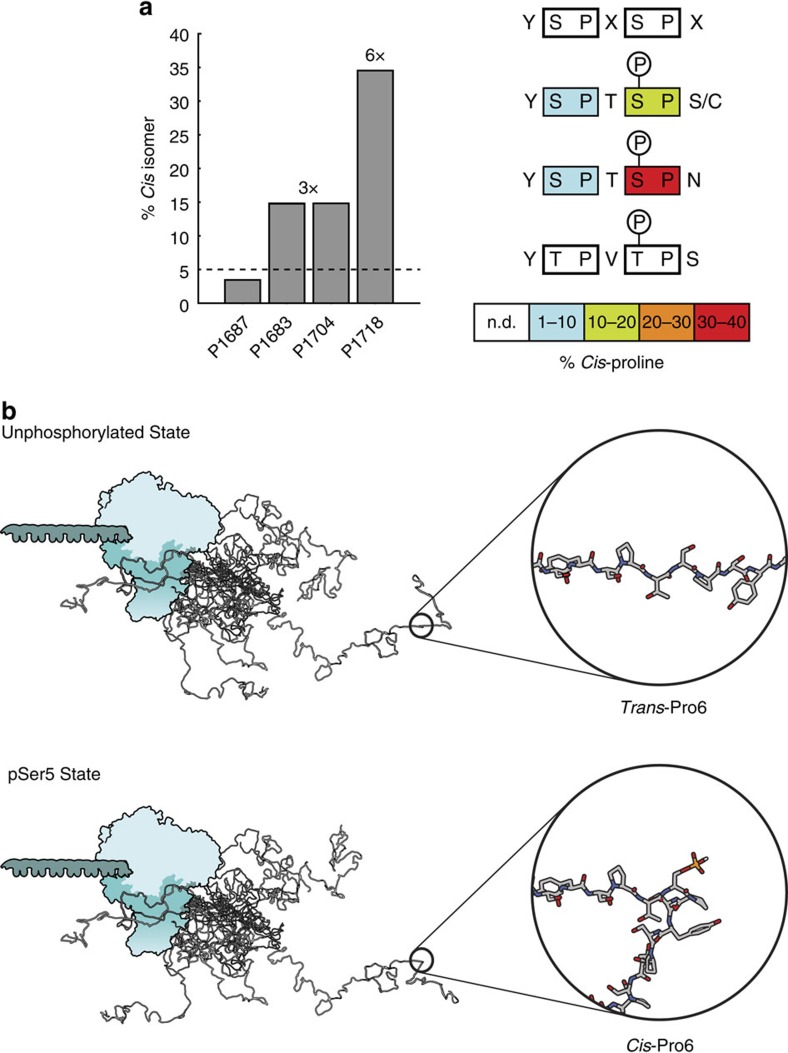
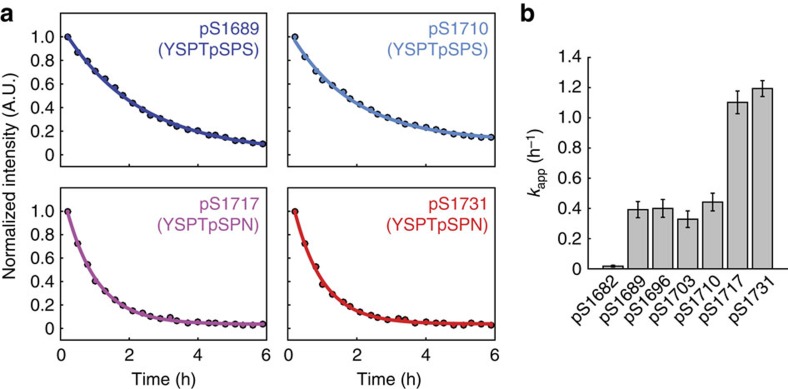
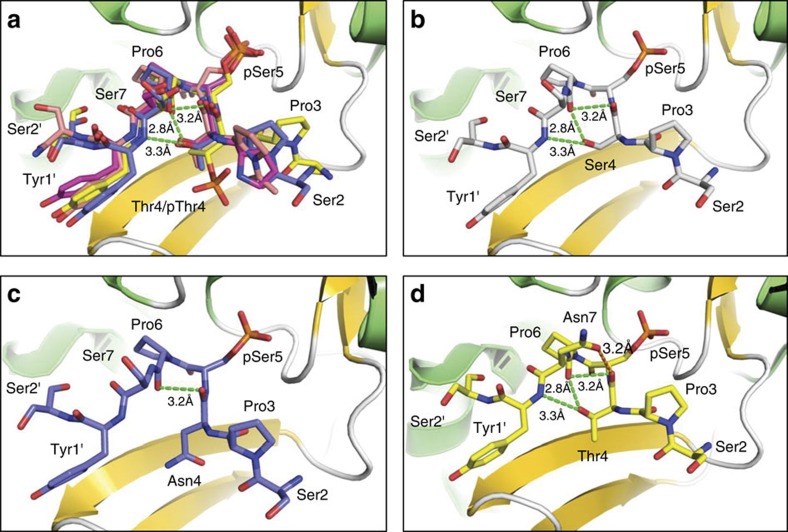
The carboxy-terminal domain (CTD) of the RNA polymerase II (Pol II) large subunit cycles through phosphorylation states that correlate with progression through the transcription cycle and regulate nascent mRNA processing. Structural analyses of yeast and mammalian CTD are hampered by their repetitive sequences. Here we identify a region of the Drosophila melanogaster CTD that is essential for Pol II function in vivo and capitalize on natural sequence variations within it to facilitate structural analysis. Mass spectrometry and NMR spectroscopy reveal that hyper-Ser5 phosphorylation transforms the local structure of this region via proline isomerization. The sequence context of this switch tunes the activity of the phosphatase Ssu72, leading to the preferential de-phosphorylation of specific heptads. Together, context-dependent conformational switches and biased dephosphorylation suggest a mechanism for the selective recruitment of cis-proline-specific regulatory factors and region-specific modulation of the CTD code that may augment gene regulation in developmentally complex organisms.


Conflict of interest statement

The authors declare no competing financial interests.

Figures

Figure 1
Figure 1. A highly conserved region in the Drosophila CTD is essential for viability and is targeted for Ser5 phosphorylation by Dm P-TEFb in vitro.
(a) Schematic of the rescue assay: Ubiquitous expression of shRNA targeting Rpb1 (UAS-Rpb1i) by the Actin-GAL4 transgene is lethal and results in no straight-winged progeny. Rescue as a result of co-expression of an Rpb1 derivative (UAS-Rpb1WT/mut) is indicated by the presence of straight-winged adults among the progeny. (b) Four internal deletion mutants of Rpb1 were expressed under Actin-GAL4 control to test for rescue of lethality caused by ubiquitous depletion of endogenous Rpb1 (Actin-GAL4/+; UAS-Rpb1i/+). Only CTDΔ2 failed to rescue. (c) Western blot analysis of the expression of Rpb1 derivatives: Tissues were collected from late pupae derived from the same genetic cross as described in a. Late pupae were analysed because these were produced by each of the matings, including the one with CTDΔ2. Ectopic Rpb1 expression was detected with FLAG antibody. Detection of Spt5 served as a loading control. (d) Percentages of straight-winged adults from each cross. For numbers of flies examined, see Supplementary Fig. 1c. (e) Evolutionary conservation of the CTD across different species. Identical amino acids are denoted by black bars. The region encompassed by the CTDΔ2 deletion (CTD2) and recombinant protein CTD2′ (black lines, bottom) contain a highly conserved region.
Figure 2
Figure 2. CTD2′ Ser5 phosphorylation probed by MS and NMR spectroscopy.
(a) Amino-acid sequence of CTD2′ displaying 99% confidence phospho-site assignments by MS/MS (grey boxes) and by NMR (P-symbols). MS/MS peptide coverage was complete. (b) Linear positive MALDI TOF MS of unphosphorylated CTD2′ (black) and hyper-pSer5 CTD2′ (red). (c) Representative spectrum from Nano-LC MS/MS analysis of hyper-pSer5 CTD2′. (d) Representative strips from 3D HNCACB spectra of unphosphorylated and hyper-pSer5 CTD2′ showing perturbation upon phosphorylation (left) and strips from 3D CCCON spectra of unphosphorylated and hyper-pSer5 CTD2′ showing pSer5-induced trans-to-cis isomerization of Pro6 (P1718 and P1732; right). (e) Representative kinetic traces for CTD2′ phosphorylation monitored by RT-NMR. (f) Average chemical shift perturbations for CTD2′ upon phosphorylation for the trans-proline-enriched (red) and cis-proline-enriched states (blue). Grey bars indicate pSer/pThr5 residues and the black line denotes the average perturbation.
Figure 3
Figure 3. Phospho-sites and proline isomerization in hyper-pSer5 CTD2′ probed by NMR spectroscopy.
(a) 2D 1H-15N correlation spectra of unphosphorylated (black) and hyper-pSer5 (red) CTD2′. (b) 2D 13C′-15N correlation spectra of unphosphorylated (black) and hyper-pSer5 (red) CTD2′. (c) Annotation of pSer5/pThr5 resonances in the downfield region of the 2D H-N correlation spectrum. (d) Proline region from the 2D C′-N correlation spectrum of unphosphorylated (black) and hyper-pSer5 (red) CTD2′ with some proline resonances annotated.
Figure 4
Figure 4. Small angle X-ray scattering reveals no significant change in pair-wise distances within CTD2′ upon extensive serine 5 phosphorylation.
(a) Raw scattering data for unphosphorylated CTD2′ (grey circles, bottom) and hyper-pSer5 CTD2′ (grey circles, top). Fits for unphosphorylated CTD2′ and hyper-pSer5 CTD2′ are shown superimposed on the raw data (solid black and red lines, respectively). (b) Representative pair-wise distance distributions for unphosphorylated CTD2′ (black) and hyper-pSer5 CTD2′ (red) calculated using the autoGNOM function in Primus qt, where the error bars represent the fit error.
Figure 5
Figure 5. Structural characterization of the unphosphorylated and pSer5 CTD2′ by NMR spectroscopy.
(a) Cβ and Cγ chemical shifts from the 3D CCCON spectrum of unphosphorylated CTD2′ demonstrate that, when resolved, individual proline side chain resonances show a nearly all-trans state. Blue and red bars represent the range of chemical shifts (mean±s.d.) for prolines in the trans and cis conformation, respectively. (b) Cβ and Cγ chemical shifts from the 3D CCCONH spectrum of hyper-pSer5 CTD2′ reveal dramatic trans to cis conformational switches in response to pSer5.
Figure 6
Figure 6. The impact of serine 5 phosphorylation on the structure of the Dm CTD.
(a) Percentage of cis-proline for several proline residues determined from peak intensities in 2D NMR correlation spectra of hyper-pSer5 CTD2′, where the dotted line denotes the average percentage of cis-proline in the unphosphorylated state (left). This is depicted schematically for various heptad sequences in CTD2′ (right). (b) Model for the effect of Ser5 phosphorylation on the structure of the CTD. In the unphosphorylated state, the CTD exists in an ensemble of conformational states that favour prolines in the trans conformation (top). Hyper-pSer5 incorporation causes the CTD heptad repeats bearing the sequence motifs highlighted in a to undergo dramatic structural rearrangement driven by pSer5-dependent proline isomerization.
Figure 7
Figure 7. Structural switches in hyper-pSer5 CTD2′ modulate the apparent Ssu72 activity.
(a) Representative kinetic traces of Ssu72 dephosphorylation of pSer5 in CTD2′ monitored by RT-NMR. (b) Apparent rate constants for pSer5 dephosphorylation reveal heptad-specific Ssu72 activities. The highest apparent Ssu72 activities are observed for pSer5 residues within heptads containing Asn7. Error bars represent the errors from non-linear least squares fitting. All fitting procedures are described in detail in Methods section.
Figure 8
Figure 8. The conserved conformation of CTD peptides recognized by Ssu72.
(a) Ssu72 is shown as a ribbon diagram with α-helices in green and β-strands in gold. CTD peptides are shown as coloured sticks with carbon atoms shown in different colours: PDB code 4IMI (yellow), 4IMJ (blue), 3P9Y (salmon), and 3O2Q (magenta). The intra-molecular hydrogen bonds are shown in green dashed lines. The CTD residues are numbered based on consensus sequence and the following repeat residues are labelled with a prime. (b) The intra-molecular hydrogen bond network can be maintained even when Thr4 is replaced by Ser. (c) The replacement of Thr4 by Asn loses two intra-molecular hydrogen bonds. (d) An additional intra-molecular hydrogen bond can be formed (orange dashed line) when Ser7 is replaced by Asn.

Similar articles

Cited by

References

    1. Eick D. & Geyer M. The RNA polymerase II carboxy-terminal domain (CTD) code. Chem. Rev. 113, 8456–8490 (2013). - PubMed
    1. Buratowski S. The CTD code. Nat. Struct. Biol. 10, 679–680 (2003). - PubMed
    1. Yang C. & Stiller J. W. Evolutionary diversity and taxon-specific modifications of the RNA polymerase II C-terminal domain. Proc. Natl Acad. Sci. USA 111, 5920–5925 (2014). - PMC - PubMed
    1. Simonti C. N. et al.. Evolution of lysine acetylation in the RNA polymerase II C-terminal domain. BMC Evol. Biol. 15, 35 (2015). - PMC - PubMed
    1. Chapman R. D., Conrad M. & Eick D. Role of the mammalian RNA polymerase II C-terminal domain (CTD) nonconsensus repeats in CTD stability and cell proliferation. Mol. Cell Biol. 25, 7665–7674 (2005). - PMC - PubMed

Publication types

MeSH terms

LinkOut - more resources