. 2017 May 12:6:e23471.
doi: 10.7554/eLife.23471.

Modeling Hsp70/Hsp40 interaction by multi-scale molecular simulations and coevolutionary sequence analysis

Affiliations

Modeling Hsp70/Hsp40 interaction by multi-scale molecular simulations and coevolutionary sequence analysis

Duccio Malinverni et al. Elife. .

Abstract

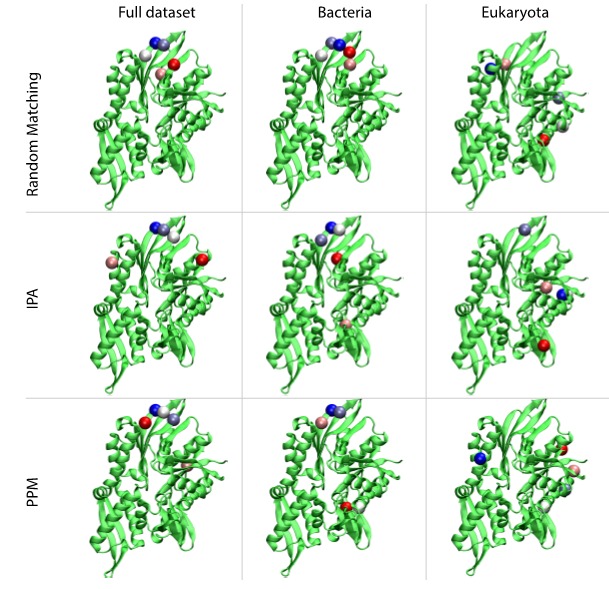
The interaction between the Heat Shock Proteins 70 and 40 is at the core of the ATPase regulation of the chaperone machinery that maintains protein homeostasis. However, the structural details of the interaction remain elusive and contrasting models have been proposed for the transient Hsp70/Hsp40 complexes. Here we combine molecular simulations based on both coarse-grained and atomistic models with coevolutionary sequence analysis to shed light on this problem by focusing on the bacterial DnaK/DnaJ system. The integration of these complementary approaches resulted in a novel structural model that rationalizes previous experimental observations. We identify an evolutionarily conserved interaction surface formed by helix II of the DnaJ J-domain and a structurally contiguous region of DnaK, involving lobe IIA of the nucleotide binding domain, the inter-domain linker, and the β-basket of the substrate binding domain.

Keywords: biophysics; computational biology; heat shock protein; molecular modeling; none; protein coevolution; protein complex; structural biology; systems biology; transient interaction.


Conflict of interest statement

The authors declare that no competing interests exist.

Figures

Figure 1.
Figure 1.. Binding modes of DnaK/DnaJ.
(A) Probabilities of JD residues to be in contact with the DnaK (NBD(ATP) case). Helices I-IV of the JD are highlighted. See (Figure 1—figure supplement 1) for the NBD(ADP) and FL(ATP) cases. (B) Probabilities of DnaK residues to be in contact with the JD (NBD(ATP) case). Blue: low, Red: high, see scalebar. (C,E,G) Orientational free energy as a function of the spherical polar angles (Φcom,Ωcom) of the JD center of mass for (A) NBD(ADP), (C) NBD(ATP), (E) FL(ATP). The origin and the reference axes are defined by NBD center of mass and inertia axes, respectively. (D,F,H) The free energy surface as a function of Euler angles (Ω,Ψ) defining the relative orientation of J-domain w.r.t. the NBD for (B) NBD(ADP), (D) NBD(ATP), (F) FL(ATP). See Materials and methods and Figure 1—figure supplement 4 for details on the angular definitions. Iso-lines are drawn at 1 kBT free-energy intervals. See (Figure 1—figure supplement 2) for the third Euler angle. DOI: http://dx.doi.org/10.7554/eLife.23471.002
Figure 1—figure supplement 1.
Figure 1—figure supplement 1.. Contact frequencies predicted by coarse-grained simulations.
Probabilities of DnaK residues to be in contact with the JD for (A) NBD(ADP), (B) NBD(ATP), (C) FL(ATP). Probabilities of JD residues to be in contact with the DnaK for (D) NBD(ADP), (E) NBD(ATP), (F) FL(ATP).Blue: low probability, Red: high probability, see scale bar. DOI: http://dx.doi.org/10.7554/eLife.23471.003
Figure 1—figure supplement 2.
Figure 1—figure supplement 2.. Free energy surface of bound CG conformations, using the third Euler angle.
Free energy surface as a function of Euler angles (Θ,Ψ) defining the relative orientation of J-domain w.r.t. the DnaK NBD for (A) NBD(ADP), (B) NBD(ATP), (C) FL(ATP). The fixed and rotating coordinate systems are defined by the inertia axes of the NBD and JD, respectively. Iso-value lines are drawn at 1 kBT free-energy intervals. DOI: http://dx.doi.org/10.7554/eLife.23471.004
Figure 1—figure supplement 3.
Figure 1—figure supplement 3.. Ensemble of bound conformations predicted by coarse-grained simulations.
The ensembles of bound JDs are reported for (A) NBD(ADP), (B) NBD(ATP) and (C) FL(ATP). For ease of visualization, one out of five bound conformations is displayed. The JD is in red, the NBD in green, and the SBD and linker in brown. All bound conformations have inter-protein distances of 8 Å or less and total binding energies below −2kBT. DOI: http://dx.doi.org/10.7554/eLife.23471.005
Figure 1—figure supplement 4.
Figure 1—figure supplement 4.. Inertia axes of the NBD and the JD and Euler angle definition.
(A) Inertia axes of the JD. (B) Inertia axes of the DnaK NBD. (C) Vectorial representation of the Euler angles used for defining the free energy surfaces. DOI: http://dx.doi.org/10.7554/eLife.23471.006
Figure 2.
Figure 2.. Conformations of the DnaK:JD complex.
Most representative HPD-OUT/IN conformations for the FL(ATP):JD system (HPD-OUT: (A) and (C), HPD-IN: (B) and (D)). The four lobes forming the sub-structures of the NBD are highlighted. The SBD is in brown. The docked inter-domain linker is in purple. The HPD tripeptide of the J-domain is depicted as magenta spheres. The JD is depicted in blue (HPD-OUT) or red (HPD-IN). See (Figure 2—figure supplement 1) for the NBD(ADP) and NBD(ATP) systems. For readability, the NBD in the rotated panels C) and D) is uniformly colored in green. DOI: http://dx.doi.org/10.7554/eLife.23471.007
Figure 2—figure supplement 1.
Figure 2—figure supplement 1.. HPD-IN/OUT conformations for NBD(ADP) and NBD(ATP).
Most representative HPD-OUT/IN conformations. (A,B) HPD-OUT NBD(ADP), (C,D) HPD-IN NBD(ADP), (E,F) HPD-OUT NBD(ATP), (G,H) HPD-IN NBD(ATP). The four lobes forming the sub-structures of the NBD are highlighted. The HPD tripeptide of the J-domain is depicted as magenta spheres. The JD is depicted in blue (HPD-OUT) or red (HPD-IN). DOI: http://dx.doi.org/10.7554/eLife.23471.008
Figure 3.
Figure 3.. Contacts from coevolutionary analysis.
(A) Frequency of appearance of the coevolutionary inter-protein contacts (see Materials and methods). The three most frequent contacts are highlighted (N187-K23 magenta, D208-K26 orange and T189-R19 blue. Numbering refers to the E. coli DnaK-DnaJ (Uniprot IDs: DnaK P0A6Y8, DnaJ P08622)). (B–C) The same three contacts represented on the HPD-OUT (blue, panel B) and HPD-IN (red, panel C) conformations of the NBD(ATP):JD complex. Coevolving residues are depicted by spheres, following the color scheme of panel A. Gray spheres represent D35 of the 33HPD35 motif on JD and R167 of the NBD. (See Materials and methods and Figure 7 for an extended DCA analysis and validation.) DOI: http://dx.doi.org/10.7554/eLife.23471.009
Figure 3—figure supplement 1.
Figure 3—figure supplement 1.. Frequency of appearance of the coevolutionary inter-protein contacts (see Materials and methods) on separated bacterial and eukaryotic datasets.
(A) Predictions on the bacterial dataset. The three most frequent contacts are the same as the three reported in the complete dataset and follow the same colorscheme (Figure 3.) (B) Predictions on the eukaryotic dataset. Inset: Zoom on the vertical axis between 0% and 5%. DOI: http://dx.doi.org/10.7554/eLife.23471.010
Figure 4.
Figure 4.. All-atom 1μs simulations of FL-ATP.
(A) 10 snapshots of the three long atomistic MD simulations of FL-ATP DnaK bound to the DnaJ JD. Green: NBD, magenta: linker, brown SBD, red/cyan/purple: JD for the three trajectories. For ease of visualization, only helices II and III of the JD are depicted. (B) Distributions of the distances of the three coevolving contacts and the D35-R167 contact. The distance distributions for the three cases follow the color scheme of panel A (red/cyan/purple). Shaded areas are the sum of the distributions for each case. See (Figure 4—figure supplement 4) for traces of the trajectories. DOI: http://dx.doi.org/10.7554/eLife.23471.012
Figure 4—figure supplement 1.
Figure 4—figure supplement 1.. Atomistic stability analysis.
Final frames of the 10 all-atom MD trajectories. (A) HPD-OUT/NBD(ADP), (B) HPD-IN/NBD(ADP), (C) HPD-OUT/NBD(ATP), (D) HPD-IN/NBD(ATP), (E) HPD-OUT/FL(ATP), (F) HPD-IN/FL(ATP). For ease of readability, only helices II and III of the JD are depicted. Rainbow coloring (white to blue for HPD-OUT, white to red for HPD-IN) is used to better differentiate the 10 frames. The DnaK NBD is colored in yellow for NBD(ADP) and in green for NBD(ATP) and FL(ATP). The docked inter-domain linker is colored in magenta in FL(ATP). The SBD is colored brown in FL(ATP). DOI: http://dx.doi.org/10.7554/eLife.23471.013
Figure 4—figure supplement 2.
Figure 4—figure supplement 2.. dRMS of atomistic MD trajectories.
The 10 time series of the dRMS of the JD with respect to the initial JD configuration of each MD trajectory for (A) HPD-OUT NBD(ADP), (B) HPD-IN NBD(ADP), (C) HPD-OUT NBD(ATP), (D) HPD-IN NBD(ATP), (E) HPD-OUT FL(ATP), (F) HPD-IN FL(ATP). DOI: http://dx.doi.org/10.7554/eLife.23471.014
Figure 4—figure supplement 3.
Figure 4—figure supplement 3.. Angular deviation of atomistic MD trajectories w.r.t. the central HPD-IN/OUT CG conformations.
The 10 time series of the angle between the principal axis of the JD in the MD trajectories with respect to the principal axis of the most representative JD configuration in the CG ensemble for (A) HPD-OUT NBD(ADP), (B) HPD-IN NBD(ADP), (C) HPD-OUT NBD(ATP), (D) HPD-IN NBD(ATP), (E) HPD-OUT FL(ATP), (F) HPD-IN FL(ATP). DOI: http://dx.doi.org/10.7554/eLife.23471.015
Figure 4—figure supplement 4.
Figure 4—figure supplement 4.. dRMS and angular deviations of the μs atomistic simulations.
(A–B), (C–D) and (E–F) are the dRMS (resp. Θ) traces of the three 1 μs atomistic simulations. DOI: http://dx.doi.org/10.7554/eLife.23471.016
Figure 5.
Figure 5.. J-domain - SBD interactions.
(A) DnaK per-residue contribution to the binding energy with the J-domain. The NBD, linker, and SBD regions are highlighted in green, pink, and ochre, respectively. The dashed line denotes the threshold for which residues are depicted in panel B (−1kcal/mol). (B) Structural view of the residues most contributing to the binding energy with the J-domain. The subdomains of DnaK (NBD, linker, and SBD) follow the same color scheme as in panel A. Residues significantly contributing to the binding energy (ΔE < −1 kcal/mol) are depicted in blue surface representation. (C) Coevolutionary contacts predicted on the full-length Hsp70 sequences. The three blue contacts are the same as those reported in Figure 3. The two contacts involving the SBD of Hsp70 are shown in yellow. The dotted circle represents residue E75 of the J-domain, absent from the structures used in the simulations (see Materials and methods). The depicted conformation is the final frame of one of the three 1-μs HPD-IN FL-ATP simulations. DOI: http://dx.doi.org/10.7554/eLife.23471.017
Figure 5—figure supplement 1.
Figure 5—figure supplement 1.. J-domain per-residue contribution to the binding energy with DnaK.
(A) Helices I to IV are highlighted in gray, orange, green, and cyan, respectively. The loop connecting helices II and III is depicted in magenta . The dashed line denotes the threshold for which residues are depicted in panel B (−1kcal/mol). (B) Structural view of the residues most contributing to the binding energy with DnaK. The subdomains of the J-domain (helices I to IV and loop) follow the same color scheme as in panel A. Residues significantly contributing to the binding energy (ΔE<-1 kcal/mol) are depicted in blue surface representation. DOI: http://dx.doi.org/10.7554/eLife.23471.018
Figure 5—figure supplement 2.
Figure 5—figure supplement 2.. Frequency of appearance of the coevolutionary inter-protein contacts (see Materials and methods), for the dataset containing full-length Hsp70s.
The six most frequent contacts are highlighted (blue: contacts with NBD, yellow: contacts with SBD). The buried predicted contact with the NBD and the contact not present in the J-domain structure are represented by hollow circles. DOI: http://dx.doi.org/10.7554/eLife.23471.019
Figure 6.
Figure 6.. Distribution of number of paralogs per organism, for Hsp40 and Hsp70.
DOI: http://dx.doi.org/10.7554/eLife.23471.021
Figure 7.
Figure 7.. Extended analysis of coevolutionary predictions and threshold validation.
DCA predicted contacts with threshold selection threshold above 0.2. (A) Frequency of appearance of the coevolutionary inter-protein contacts (see Materials and methods). All nine predicted contacts which appear in more than 20% (dashed red line) of the random matchings are reported. Contacts are colored by their selection frequency (blue: most frequent, white: less frequent). The two contacts containing a buried residue are underlined. (B–C) The seven surface exposed residues among the nine selected, reported on the DnaK NBD. (D–E) The seven surface exposed residues among the nine selected, reported on the JD. Panels B-E follow the same color scheme as panel (A). DOI: http://dx.doi.org/10.7554/eLife.23471.022
Figure 7—figure supplement 1.
Figure 7—figure supplement 1.. Comparison of the five strongest DCA predictions between different methods.
For IPA and PPM, the cases marked Bacteria and Eukaryota denote results obtained on the two restricted subsets. The cases denoted Full were obtained using the complete dataset. Random Matching: Five most frequently selected inter-protein contacts. IPA and PPM: Top five ranked inter-protein. In all cases, the scale goes from blue to red (blue: strongest/most frequent contact, red: weaker/less frequent contact). DOI: http://dx.doi.org/10.7554/eLife.23471.023
Author response image 1.
Author response image 1.. Distribution of number of paralogs per organism for Hsp40 and Hsp70.
DOI: http://dx.doi.org/10.7554/eLife.23471.031
Author response image 2.
Author response image 2.. Frequency of appearance of coevolutionary inter-protein contacts.
Left: Only bacterial sequences. Right: Only eukaryotic sequences. Inset: Zoom on the vertical axis between 0 and 5%. The five most frequent contacts in the bacterial analysis reported in Tab.R3 are highlighted. The colored circles coincide with the three most frequently selected contacts in the full dataset, reported in the main text. DOI: http://dx.doi.org/10.7554/eLife.23471.033
Author response image 3.
Author response image 3.. Random matching results obtained on the HK/RR dataset.
Left: Frequence of appearances of the contacts. The 15 most frequent contacts are highlighted by red circles for visualization. Right: The 10 most frequent contacts plotted onto the contact map of the HK/RR hetero-dimer (PDB:3DGE). Structural contacts from the PDB are defined using a threshold of 8.5Å between heavy atoms of two residues. Green (resp. red) DCA predicted contacts correspond to true (resp. false) predictions with respect the crystal structure. The blue dotted line represents the limit between HK and RR. DOI: http://dx.doi.org/10.7554/eLife.23471.035
Author response image 4.
Author response image 4.. Comparison of inter-protein predictions between the three methods, on the full dataset (left column), bacterial dataset (central column) and eukaryotic dataset (right column).
The residues on the NBD involved in the absolute top five contacts predicted by all methods are reported, without any filtering. The color-code denotes the rank of the predictions, from dark blue (rank=1) to dark red (rank=5). DOI: http://dx.doi.org/10.7554/eLife.23471.037
Author response image 5.
Author response image 5.. Binding energy computed by GBSA.
The blue bars denote the three micro-second runs of the HPD-IN conformations. The red bars denote the two 750 ns runs of the HPD-OUT conformations. DOI: http://dx.doi.org/10.7554/eLife.23471.038

Similar articles

Cited by

References

    1. Abraham MJ, Murtola T, Schulz R, Páll S, Smith JC, Hess B, Lindahl E. GROMACS: high performance molecular simulations through multi-level parallelism from laptops to supercomputers. SoftwareX. 2015;1-2:19–25. doi: 10.1016/j.softx.2015.06.001. - DOI
    1. Ahmad A, Bhattacharya A, McDonald RA, Cordes M, Ellington B, Bertelsen EB, Zuiderweg ER. Heat shock protein 70 kDa chaperone/DnaJ cochaperone complex employs an unusual dynamic interface. PNAS. 2011;108:18966–18971. doi: 10.1073/pnas.1111220108. - DOI - PMC - PubMed
    1. Alderson TR, Kim JH, Cai K, Frederick RO, Tonelli M, Markley JL. The specialized Hsp70 (HscA) interdomain linker binds to its nucleotide-binding domain and stimulates ATP hydrolysis in both Cis and trans configurations. Biochemistry. 2014;53:7148–7159. doi: 10.1021/bi5010552. - DOI - PMC - PubMed
    1. Alderson TR, Kim JH, Markley JL. Dynamical structures of Hsp70 and Hsp70-Hsp40 complexes. Structure. 2016;24:1014–1030. doi: 10.1016/j.str.2016.05.011. - DOI - PMC - PubMed
    1. Bertelsen EB, Chang L, Gestwicki JE, Zuiderweg ER. Solution conformation of wild-type E. coli Hsp70 (DnaK) chaperone complexed with ADP and substrate. PNAS. 2009;106:8471–8476. doi: 10.1073/pnas.0903503106. - DOI - PMC - PubMed

Publication types

MeSH terms

LinkOut - more resources