. 2017 May 12:6:e25932.
doi: 10.7554/eLife.25932.

Intracellular uptake of macromolecules by brain lymphatic endothelial cells during zebrafish embryonic development

Affiliations

Intracellular uptake of macromolecules by brain lymphatic endothelial cells during zebrafish embryonic development

Max van Lessen et al. Elife. .

Abstract

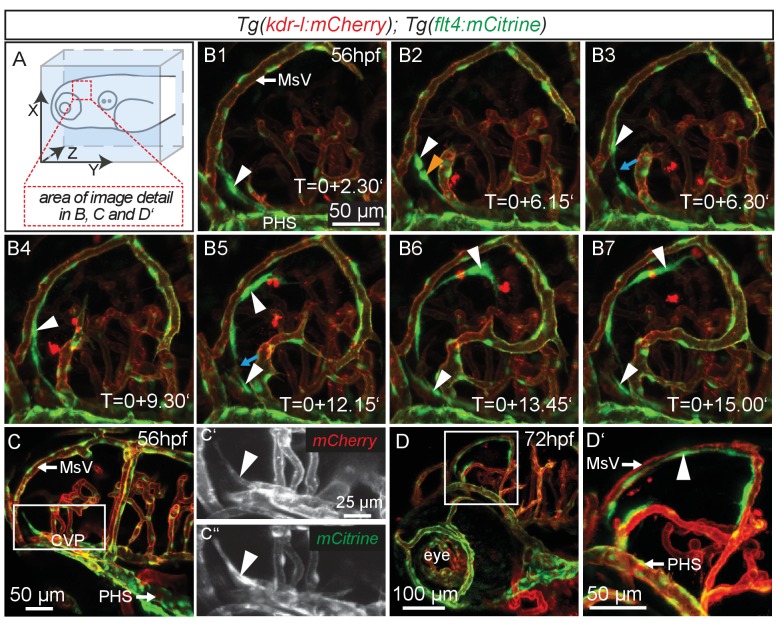
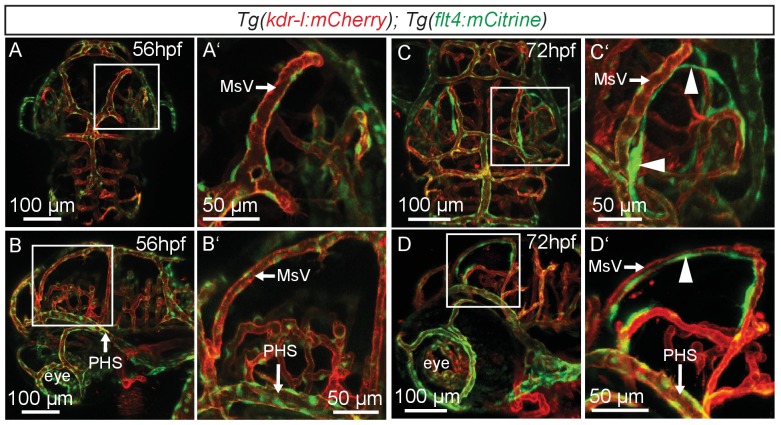
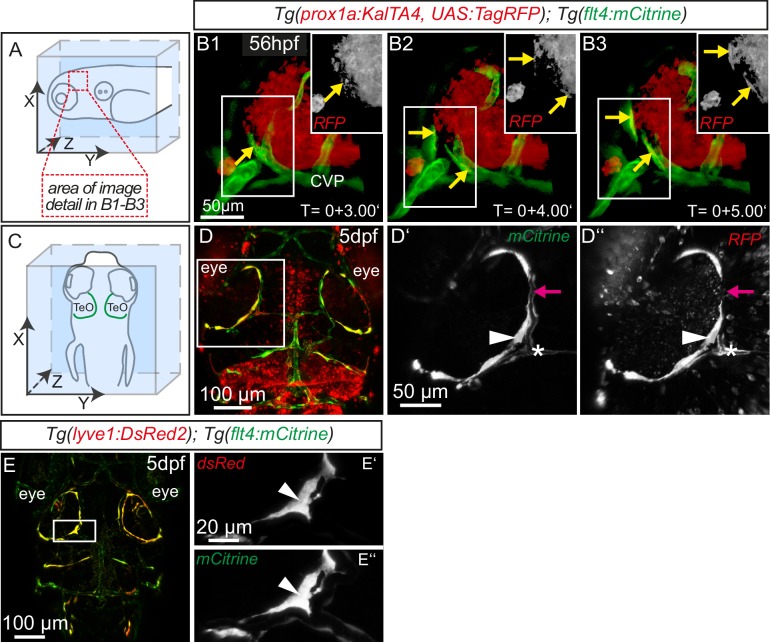
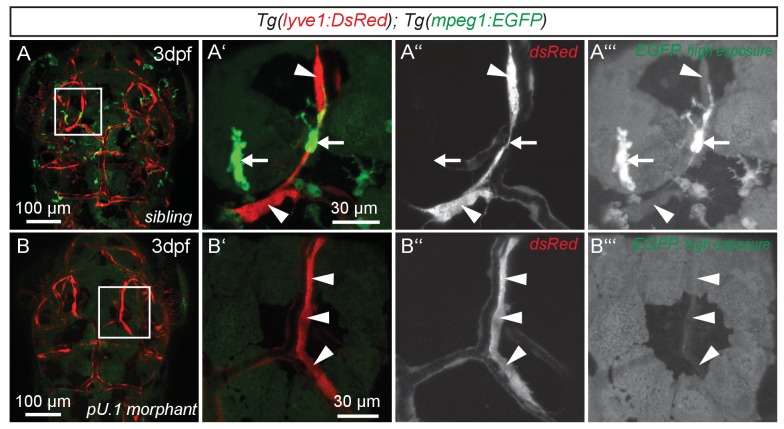
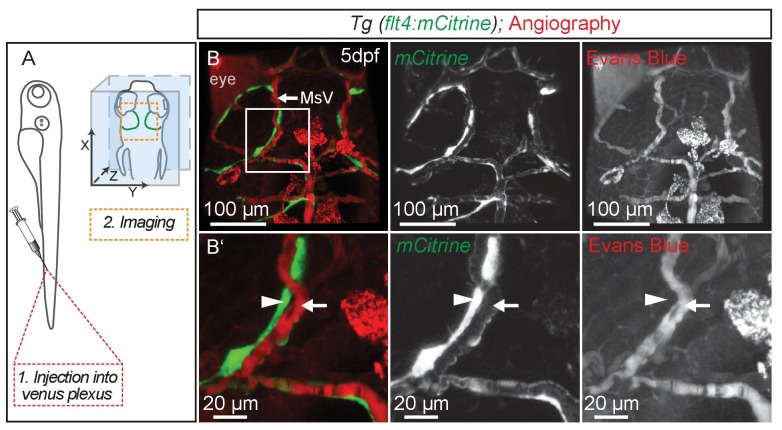
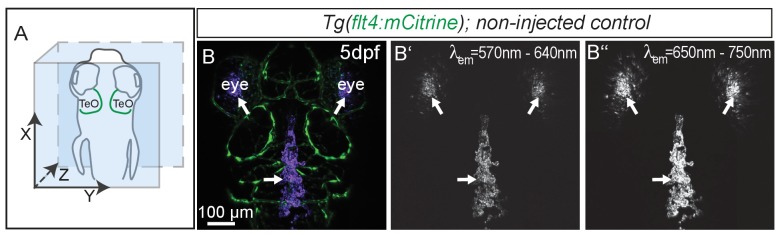
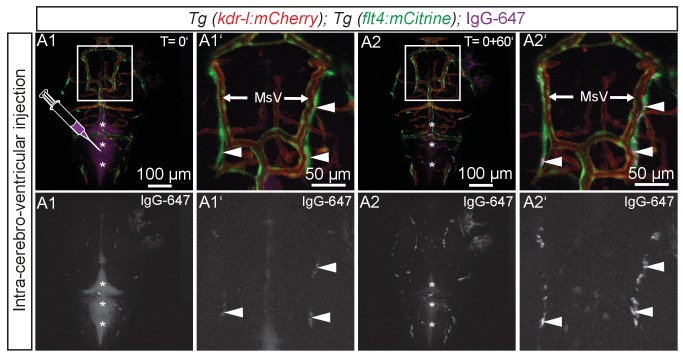
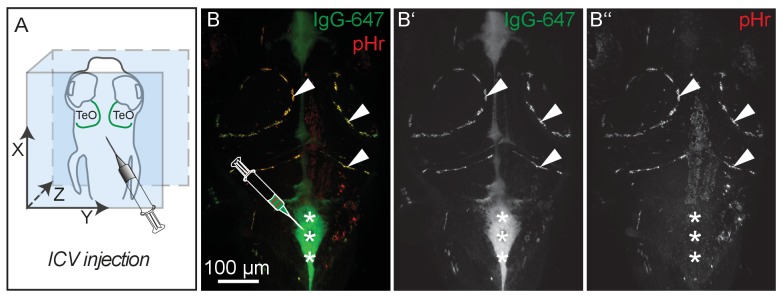
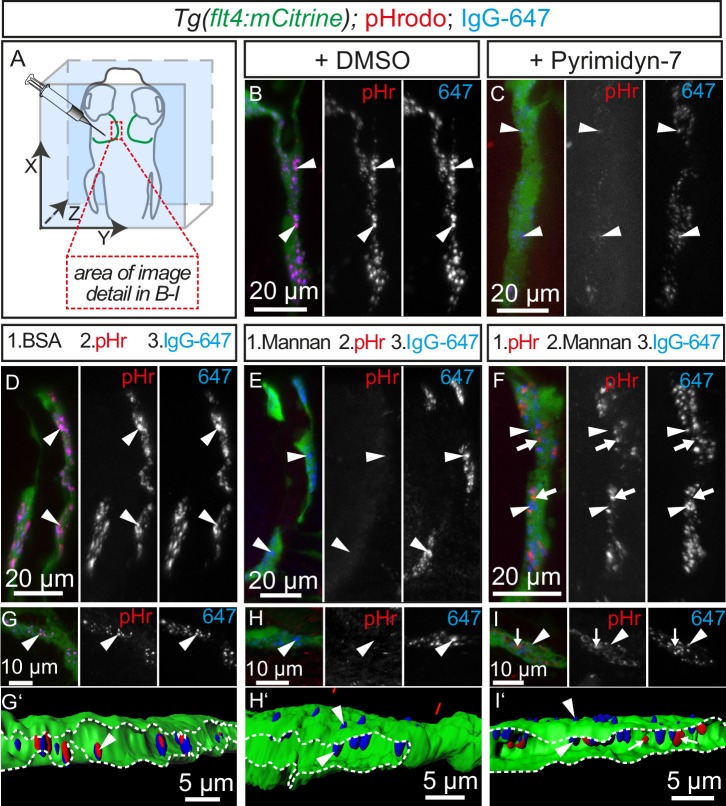
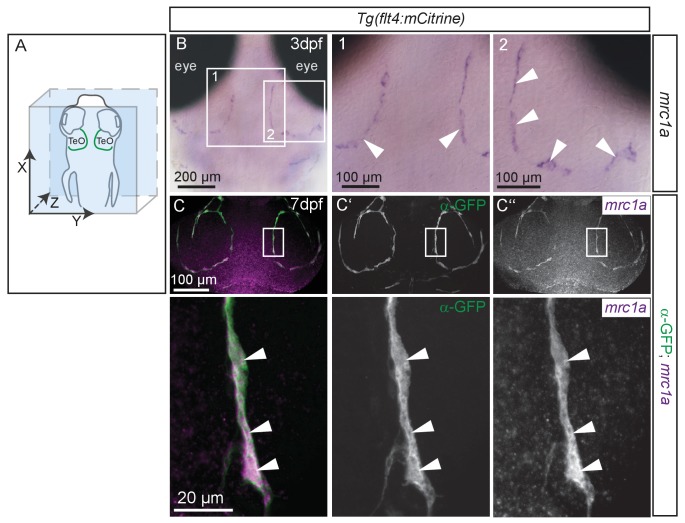
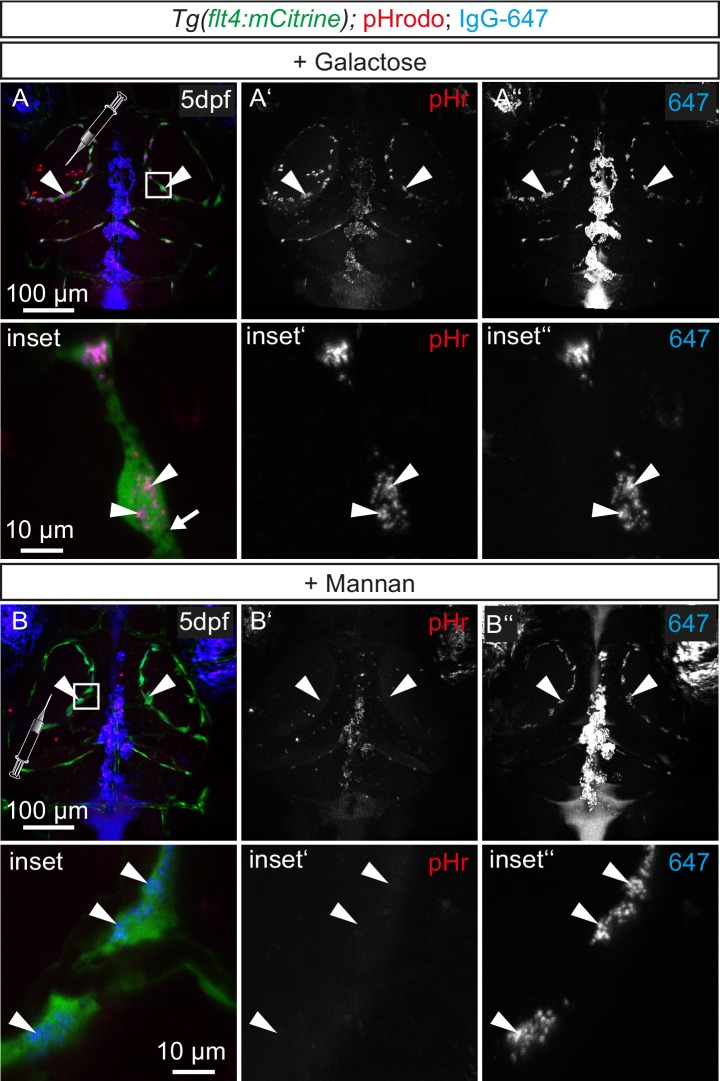
The lymphatic system controls fluid homeostasis and the clearance of macromolecules from interstitial compartments. In mammals brain lymphatics were only recently discovered, with significant implications for physiology and disease. We examined zebrafish for the presence of brain lymphatics and found loosely connected endothelial cells with lymphatic molecular signature covering parts of the brain without forming endothelial tubular structures. These brain lymphatic endothelial cells (BLECs) derive from venous endothelium, are distinct from macrophages, and are sensitive to loss of Vegfc. BLECs endocytose macromolecules in a selective manner, which can be blocked by injection of mannose receptor ligands. This first report on brain lymphatic endothelial cells in a vertebrate embryo identifies cells with unique features, including the uptake of macromolecules at a single cell level. Future studies will address whether this represents an uptake mechanism that is conserved in mammals and how these cells affect functions of the embryonic and adult brain.

Keywords: brain; developmental biology; endothelial cell; lymphatics; stem cells; zebrafish.


Conflict of interest statement

The authors declare that no competing interests exist.

Figures

Figure 1.
Figure 1.. flt4 positive cells sprout from the choroidal vascular plexus and migrate along blood vessels.
In all images blood vessels are highlighted in red (kdr-l:mCherry) and lympho-venous cells in green (flt4:mCitrine). (A) Overview and orientation of zebrafish embryos imaged in B–D. (B1 – B7) Time-lapse still images of lateral confocal projections of the TeO. At 56hpf strong mCitrine positive but low mCherry expressing ECs sprout from a vessel behind the PHS and migrate along the MsV (white arrow). Following initial sprouting the cell divides (B2, white and orange arrowheads). Leading and following cells appear to temporarily lose contact (B3 and B5, blue arrow). After making contact to the MsV the sprout continues migration (B4–B7). (C) Partial projection of the sprouting cells (cropping of the PHS) reveals that the migrating cells originate from the more proximal positioned CVP at around 56hpf. Sprouting cells express low mCherry but high mCitrine levels compared to the CVP (inset C’–C’’). (D) Lateral confocal projection of the head region shows that at 72hpf flt4 positive ECs (white arrowheads) form a loop aligned next to the MsVs (white arrowheads). (D’) Higher magnification of the boxed area in (D). Data are representative of at least five independent experiments. CVP, choroidal vascular plexus; EC, endothelial cell; hpf, hours post fertilization; MsV, mesencephalic vein; PHS, primary head sinus; TeO, Optic Tectum. Apostrophe in B1–B7 denotes hours. DOI: http://dx.doi.org/10.7554/eLife.25932.002
Figure 1—figure supplement 1.
Figure 1—figure supplement 1.. flt4 positive cells develop between 56 and 72hpf.
In all images blood vessels are highlighted in red (kdr-l:mCherry) and lympho-venous cells in green (flt4:mCitrine). (A–D) Representative dorsal and lateral confocal projection of the zebrafish head region. Until 56hpf there are no apparent flt4 positive, kdr-l negative cells visible (dorsal view in A, lateral view in B). In 3dpf embryos, a bilateral loop of loosely connected flt4 positive, kdr-l negative cells has formed next to the MsV (dorsal view in C, lateral view in D, white arrowheads). Data are representative of at least three independent experiments. hpf, hours post fertilization; MsV, mesencephalic vein; PHS, primary head sinus. DOI: http://dx.doi.org/10.7554/eLife.25932.003
Figure 2.
Figure 2.. Sprouting flt4 positive endothelial cells express prox1a and lyve1.
(A) and (C) Overview and orientation of 56hpf and 5dpf zebrafish embryos shown in B1-B3 (A) and DE'' (C). Green lines in C illustrate the position of mCitrine positive ECs. (B1–B3) Time-lapse still images of partial lateral confocal projections of the TeO as depicted in A (red inset). At 56hpf tagRFP indicates prox1a promoter activity in mCitrine positive endothelial sprouts (yellow arrows). Note that the RFP positive red cell mass above the CVP likely reports prox1a expression in cranial ganglia within the TeO. (D) Strong prox1a promoter activity persists in the mCitrine positive loop structure (inset, white arrowhead) but is absent in neighboring MsV (inset, pink arrow) at 5dpf. Note also tagRFP expression around a small part of the MsV (inset, white asterisk). (E) flt4 positive ECs express lyve1 at 5dpf (E’,E’’ inset, white arrowhead). Data are representative of at least three independent experiments. CVP, choroidal vascular plexus; dpf, days post fertilization; hpf, hours post fertilization; MsV, mesencephalic vein; TeO, Optic Tectum. Apostrophe in B1–B3 denotes hours. DOI: http://dx.doi.org/10.7554/eLife.25932.005
Figure 3.
Figure 3.. flt4 positive cells are not of myelopoietic origin.
(A) and (B) Dorsal view of partial confocal projections of 3dpf double transgenic Tg(lyve1:DsRed)nz101; Tg(mpeg1:EGFP)gl22 embryos. Brain resident macrophages strongly express mpeg1:EGFP (A’–A’’’, white arrows) while lyve1 positive LECs are only weakly EGFP positive (A’–A’’’, white arrowheads) in uninjected control embryos. Depletion of the myelopoietic lineage by injection of pU.1 (spi1b) morpholinos ablates all EGFP positive macrophages but does not affect the formation of lyve1 positive LECs (B’–B’’’, white arrowheads). dpf, days post fertilization; LEC, lymphatic endothelial cell. DOI: http://dx.doi.org/10.7554/eLife.25932.006
Figure 4.
Figure 4.. flt4 positive cells are sensitive to ablation of the vegfc/ccbe1 pathway.
(A) and (B) Antibody staining detects Prox1 protein in the GFP positive CVP and sprouting ECs in wild type sibling (A) but not in ccbe1 mutant (B) embryos (A’,A’’ insets, white arrowheads). Note few Prox1 expressing cells remaining in mutants at the site of facial lymphatic sprouting (B, white arrowhead). (C) and (D) Absence of flt4:mCitrine expressing ECs in ccbe1 mutant (D) but not in sibling controls (C, white arrowheads) in 5dpf embryos. Tg(flt1enh:tdTomato) labels arteries. (E) Quantification of results shown in C and D. Data are representative of at least two independent experiments. CVP, choroidal vascular plexus; dpf, days post fertilization; EC, endothelial cell; hpf, hours post fertilization; MsV, mesencephalic vein; +/+, wildtype; +/-, heterozygous; -/-, mutant. DOI: http://dx.doi.org/10.7554/eLife.25932.007
Figure 5.
Figure 5.. Perivascular position of flt4 positive BLECs in larval stages and adult meninges.
(A) Overview and orientation of zebrafish embryos imaged in B–D. (B) Dorsal confocal projections of the head region show that at 5dpf flt4 positive BLECs (white arrowheads) form a bilateral loop in the TeO which aligns next to the MsVs (white arrowheads). (C) and (D) Dorsal confocal projections at 5 mm and 7 mm stages show increasing spreading of flt4 positive ECs, particularly over the TeO. (E) Schematic diagram (dorsal view) of adult brain. Dotted boxes show area of image detail of F–H. (F) The dorsal surface of the Tel displays a distinct absence of flt4:mCitrine positive cells. (G) and (H) A dorsal view of the TeO and Cb, respectively, shows flt4:mCitrine positive BLECs (green) closely associated with surface kdr-l:mCherry positive blood vasculature (red), interacting with vessels and one another via thin processes (white arrowheads). BLECs contain multiple internal compartments (inset, white arrows). BLECs on the cerebellar surface are less dense and are morphologically distinct, exhibiting an elongated shape (inset). (I) Schematic diagram (lateral view) of adult brain. Dotted boxes show area of image detail of J and K, and the dotted line shows the section plane in K. (J) BLECs on the lower half of the lateral telencephalic midline boundary cluster around smaller vessels branching off from the anterior cerebral carotid artery at the lateral midline of the telencephalon (white arrow) with a few cells sending sparse and elongated processes towards the dorsal surface (white arrowheads). (K) Coronal section of the adult brain shows flt4:mCitrine positive BLECs (green) (white arrowheads) closely associated with kdr-l:mCherry positive vasculature (red) exclusively within the meninges (M) but not along the vessels extending ventrally into the tectal neuropil. DAPI nuclear counter stain (blue). Data are representative of at least three independent experiments. BLEC, brain lymphatic endothelial cell; Cb, Cerebellum; dpf, days post fertilization; EC, endothelial cell; Hyp, hypothalamus; M, Meninges; MsV, mesencephalic vein; Tel, Telencephalon; TeO, Optic Tectum. DOI: http://dx.doi.org/10.7554/eLife.25932.009
Figure 6.
Figure 6.. BLEC ultrastructure revealed in TEM of adult brain meninges.
(A) and (B) TEM micrographs of tangential sections of the domed tectal surface revealed cells (BLEC) with large spherical inclusions in proximity to meningeal blood vessels (BV). Higher magnification shows that BLECs are not contained within the basement membrane (A’ and B’, arrowheads) of endothelial cells (E) and are separated from the vessels by other cellular processes (e.g. asterisk in A’). Putative Mato/FGP cells are indicated (FGP?). (C) and (D) Pericytes (P) maintain close contact with endothelial cells (E) and are found under the basement membrane (arrowheads). BLECs are only found in the meninges (C) and are absent near blood vessels in the neuropil (D) of the brain. (E) and (F) T/S sections of tectal (E) and latero-ventral telencephalic (F) meninges showing BLECs are present in the inner layer (IL) of the meningeal covering. BLEC, brain lymphatic endothelial cell; E, endothelial cell; FGP, fluorescent granular perithelial cell; P, pericyte; TJ, tight junction. Nomenclature of meningeal layers according to Momose et al. (1988): OL, outer layer; IML, intermediate layer; IL, inner layer, BL, basal lamina; GL, glia limitans. DOI: http://dx.doi.org/10.7554/eLife.25932.012
Figure 7.
Figure 7.. BLECs dynamically take up macromolecules.
(A) Overview of the zebrafish head region and intratectal injection site of fluorescent dyes into the center of the TeO close to the meninges. Red inset denotes area of image detail in C–J. (B–J) Representative dorsal confocal projection of 5dpf embryos injected with different tracer dyes as indicated. Injected IgG-647, 10kDa-Dx, 500kDa-Dx and 66kDa-pHr specifically localize to vesicles in mCitrine positive BLECs but not to mCherry positive blood vessels (B–E, H, I and J, white arrowheads). BLECs do not accumulate high MW dextran or Evans Blue (F and G, white arrowhead). BLECs strongly label with the pH-sensitive dye pHrodo (pHr) indicating tracer internalization (H, white arrowhead). (I) and (J) Injected KAEDE protein is taken up by BLECs (I and I’, white arrowheads) and can be photoconverted to red by localized UV-exposure to a region of interest (I’’ and I’’’, white arrowheads). 10 min after photoconversion, the amount of converted red KAEDE decreases dramatically (J) and the signal is almost completely lost after 80 min (J’’’, white arrowheads). In the same time course photoconverted BLECs re-accumulate non-converted green KAEDE protein (J’’’, white arrowheads). Scale bar in C–H corresponds to 20 µm. Data are representative of at least two independent experiments. BLEC, brain lymphatic endothelial cell; dpf, days post fertilization; Dx, Dextran; IgG-647, IgG-conjugated Alexa Fluor 674; TeO, Optic Tectum; pHr, pHrodo Red Avidin. Apostrophe in J denotes minutes. DOI: http://dx.doi.org/10.7554/eLife.25932.013
Figure 7—figure supplement 1.
Figure 7—figure supplement 1.. BLECs do not carry blood flow.
(A) Overview of the injection site for angiography into the venus plexus and of the region used for imaging (orange broken box) in the zebrafish head shown in B. (B) Representative dorsal confocal projection of 5dpf embryos with lympho-venous cells in green (flt4:mCitrine). Injected Evans Blue (red fluorescence) is confined to blood vessels (white arrow) and is not taken up by BLECs (white arrowheads). Data are representative of at least two independent experiments. BLEC, brain lymphatic endothelial cell; dpf, days post fertilization; MsV, mesencephalic vein. DOI: http://dx.doi.org/10.7554/eLife.25932.014
Figure 7—figure supplement 2.
Figure 7—figure supplement 2.. Eyes and skin pigmentation is autofluorescent in non-injected embryos.
(A) Orientation of the zebrafish head imaged in B. (B) Representative dorsal confocal projection of non-injected 5dpf Tg(flt4:mCitrine) embryos marking lympho-venous cells in green. Excitation at 568 nm (B’) and 647 nm (B’’) shows auto-fluorescent signal from the eyes and skin pigmentation within the emission spectra of red and near-infrared fluorophores (B’ and B’’, white arrowheads). Data are representative of at least two independent experiments. dpf, days post fertilization; MsV, mesencephalic vein; TeO, Optic Tectum. DOI: http://dx.doi.org/10.7554/eLife.25932.015
Figure 7—figure supplement 3.
Figure 7—figure supplement 3.. BLECs take up tracer from ventricles.
Blood vessels are highlighted in red (kdr-l:mCherry) and lympho-venous cells in green (flt4:mCitrine). IgG-647 is pseudo-colored in purple. (A1–A2) Time-lapse still images of representative dorsal confocal projection of 72hpf embryo injected with IgG-647 into the hindbrain ventricle. Immediately after injection, the tracer dye is confined to the hind- and midbrain ventricle (A1, asterisks) and only very faint signal is detected from flt4 positive kdr-l negative BLECs (A1, inset, white arrowheads). Within 60 min, the tracer cleared from the ventricular space (B1, asterisks) and accumulated at BLECs (A2, inset, white arrowheads). Data are representative of at least two independent experiments. BLEC, brain lymphatic endothelial cell; hpf, hours post fertilization; IgG-647, IgG-conjugated Alexa Fluor 674; MsV, mesencephalic vein. DOI: http://dx.doi.org/10.7554/eLife.25932.016
Figure 7—figure supplement 4.
Figure 7—figure supplement 4.. pH-sensitive pHrodo Red Avidin fluoresces more brightly after uptake into BLECs.
(A) Orientation of the zebrafish head and injection site of fluorescent dyes into the hindbrain ventricle of a 5dpf embryo as shown in B. (B) Representative dorsal confocal projection of 5dpf embryos injected with both IgG-647 and pHr. Injected IgG-647 is clearly visible in both the ventricles (asterisks) and BLECs (arrowheads), while pHr predominantly fluoresces within BLECs, probably reflecting localization to low pH compartments (B–B’’, asterisks and arrowheads). Data are representative of at least five independent experiments. BLEC, brain lymphatic endothelial cell; dpf, days post fertilization; ICV, intra-cerebro-ventricular; IgG-647, IgG-conjugated Alexa Fluor 674; TeO, Optic Tectum; pHr, pHrodo Red Avidin. DOI: http://dx.doi.org/10.7554/eLife.25932.017
Figure 8.
Figure 8.. Tracer uptake by BLECs is inhibited by mannan administration.
(A) Overview of the zebrafish head region depicting intratectal injection of fluorescent dyes into the center of the TeO close to the meninges in 5dpf embryos. Red inset denotes area of image detail for representative dorsal confocal projections in B–I. (B) and (C) In DMSO treated fish co-injection of pHr and IgG-647 reveals high degree co-localization of both tracers in vesicles within mCitrine positive BLECs (B, white arrowheads). Inhibition of dynamin-dependent endocytosis with Pyrimidyn-7 results in reduced signal intensity from IgG-647 positive vesicles and an almost complete block of pHr uptake (C, white arrowheads). (D–F) Separate, consecutive injections of BSA or mannan with pHr and IgG-647. Injection of BSA, pHr and IgG-647 results in co-localization of both tracers in BLECs (D, white arrowheads). In contrast, initial injection of mannan completely blocks the uptake of pHr but not the accumulation of IgG-647 to BLECs (E, white arrowheads). However, initial injection of pHr followed by mannan and IgG-647 results in accumulation of both tracers in BLECs with hardly any co-localization (F, white arrowheads and arrows). (G–I) Same experimental setup as in D–F except the embryos were fixed in PFA five minutes after the last injection to enable higher resolution imaging. Area within the white dotted lines in 3D-reconstructions reveals the lumen of BLECs (G’,H’ and I’). In BSA control injected fish both dyes co-localize in intraluminal vesicles (G and G’, white arrowheads). In mannan injected fish, IgG-647 cannot be internalized completely but remains stuck at the cell surface, (H and H’, white arrowheads). Finally, initial injection of pHr reveals internalized vesicular pHr and membrane associated IgG-647 (I and I’, white arrows and white arrowheads). Data are representative of at least two independent experiments. BLEC, brain lymphatic endothelial cell; BSA, bovine serum albumin; dpf, days post fertilization; IgG-647, IgG-conjugated Alexa Fluor 674; PFA, paraformaldehyde; pHr, pHrodo Red Avidin; TeO, Optic Tectum. DOI: http://dx.doi.org/10.7554/eLife.25932.021
Figure 8—figure supplement 1.
Figure 8—figure supplement 1.. BLECs express mrc1a.
(A) Overview and orientation of zebrafish embryo imaged in B and C, with the arrangement of BLECs over the brain illustrated by the green lines. (B) In situ hybridization in 80hpf zebrafish embryos reveals mrc1a mRNA expression in BLECs (white arrowheads in insets 1 and 2). Note discontinuous staining pattern suggesting labeling of individual, loosely connected cells. (C) Double fluorescent in situ shows mrc1a mRNA (purple) expression persists in 7dpf embryos and specifically localizes to mCitrine expressing BLECs labelled with α-GFP antibody (green) (white arrowheads in insets). Data are representative of three independent experiments. BLEC, brain lymphatic endothelial cell; TeO, Optic Tectum. DOI: http://dx.doi.org/10.7554/eLife.25932.022
Figure 8—figure supplement 2.
Figure 8—figure supplement 2.. Tracer uptake by BLECs is not inhibited by galactose administration.
(A) and (B) Representative dorsal confocal projections of the zebrafish head region depicting intratectal injection of galactose (A) or mannan (B) prior to injection of fluorescent dyes into the center of TeO close to the meninges in 5dpf Tg(flt4:mCitrine) embryos. After injection of the monosaccharide galactose, flt4 positive BLECs still endocytose both pHr and IgG-647 (A, white arrowheads). In contrast, mannan administration blocks dye uptake indicated by the absence pHr positive vesicles in BLECs (B), while 647 can still bind to the PM (B, white arrowheads). BLEC, brain lymphatic endothelial cell; dpf, days post fertilization; IgG-647, IgG-conjugated Alexa Fluor 674; pHr, pHrodo Red Avidin; TeO, Optic Tectum. DOI: http://dx.doi.org/10.7554/eLife.25932.023

References

    1. Ando R, Hama H, Yamamoto-Hino M, Mizuno H, Miyawaki A. An optical marker based on the UV-induced green-to-red photoconversion of a fluorescent protein. PNAS. 2002;99:12651–12656. doi: 10.1073/pnas.202320599. - DOI - PMC - PubMed
    1. Aspelund A, Antila S, Proulx ST, Karlsen TV, Karaman S, Detmar M, Wiig H, Alitalo K. A dural lymphatic vascular system that drains brain interstitial fluid and macromolecules. The Journal of Experimental Medicine. 2015;212:991–999. doi: 10.1084/jem.20142290. - DOI - PMC - PubMed
    1. Aspelund A, Tammela T, Antila S, Nurmi H, Leppänen VM, Zarkada G, Stanczuk L, Francois M, Mäkinen T, Saharinen P, Immonen I, Alitalo K. The Schlemm's canal is a VEGF-C/VEGFR-3-responsive lymphatic-like vessel. Journal of Clinical Investigation. 2014;124:3975–3986. doi: 10.1172/JCI75395. - DOI - PMC - PubMed
    1. Beratis NG, Mavrommatis T, Hatiris I, Kavaliotis J, Tsagaropoulou-Stiga H, Syrogiannopoulos GA. Increased activity of lysosomal acid hydrolases in the cell-free cerebrospinal fluid of bacterial meningitis. Pediatric Research. 1997;41:235–241. doi: 10.1203/00006450-199702000-00014. - DOI - PubMed
    1. Bos FL, Caunt M, Peterson-Maduro J, Planas-Paz L, Kowalski J, Karpanen T, van Impel A, Tong R, Ernst JA, Korving J, van Es JH, Lammert E, Duckers HJ, Schulte-Merker S. CCBE1 is essential for mammalian lymphatic vascular development and enhances the lymphangiogenic effect of vascular endothelial growth factor-C in vivo. Circulation Research. 2011;109:486–491. doi: 10.1161/CIRCRESAHA.111.250738. - DOI - PubMed

Publication types

Substances

LinkOut - more resources