

Heterogeneous extracellular dopamine regulation in the subregions of the olfactory tubercle
- PMID: 28498499
- PMCID: PMC6849378
- DOI: 10.1111/jnc.14069
Heterogeneous extracellular dopamine regulation in the subregions of the olfactory tubercle
Abstract
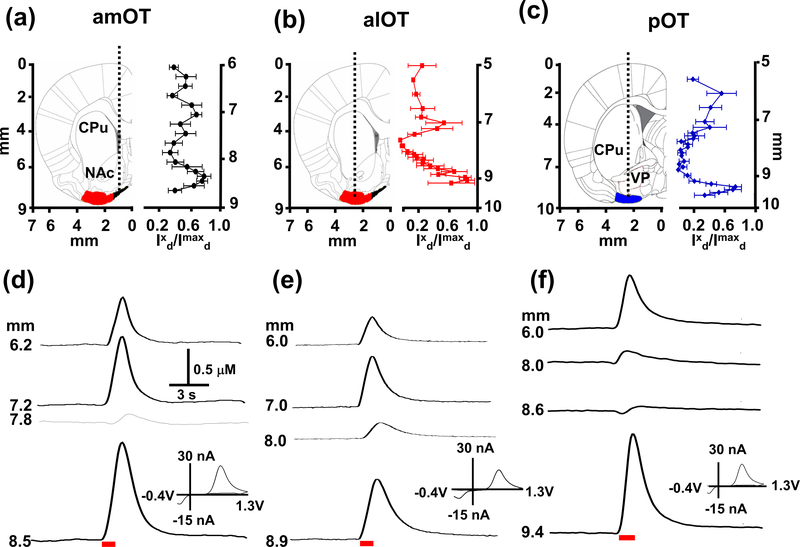
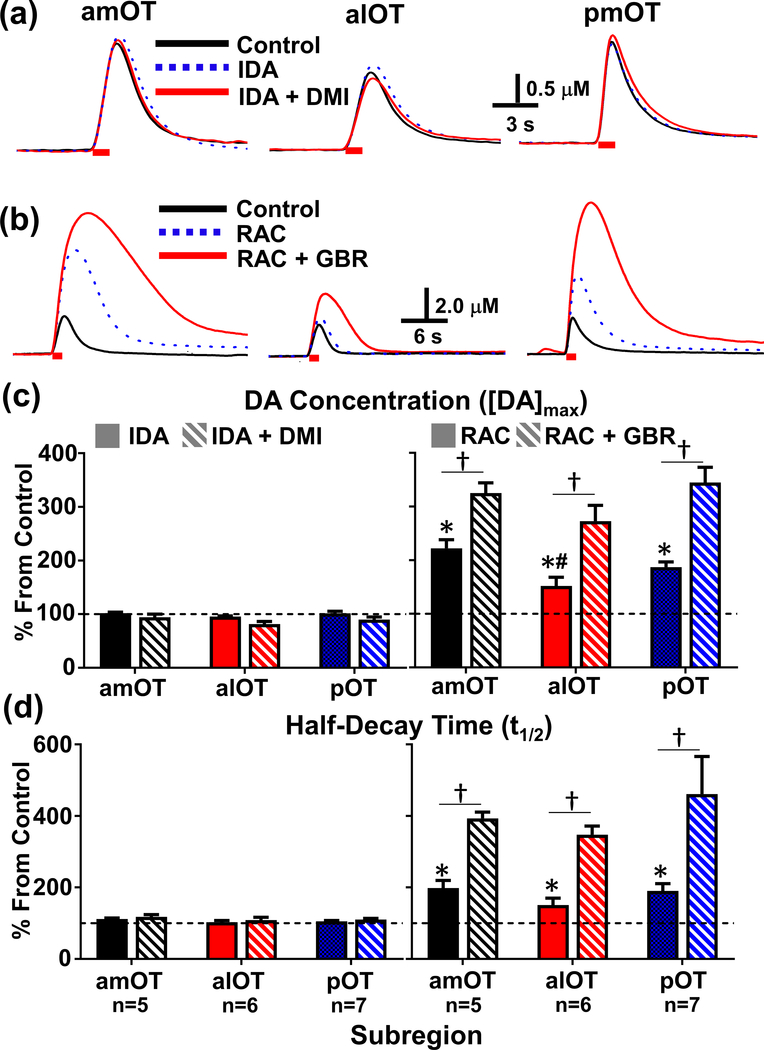
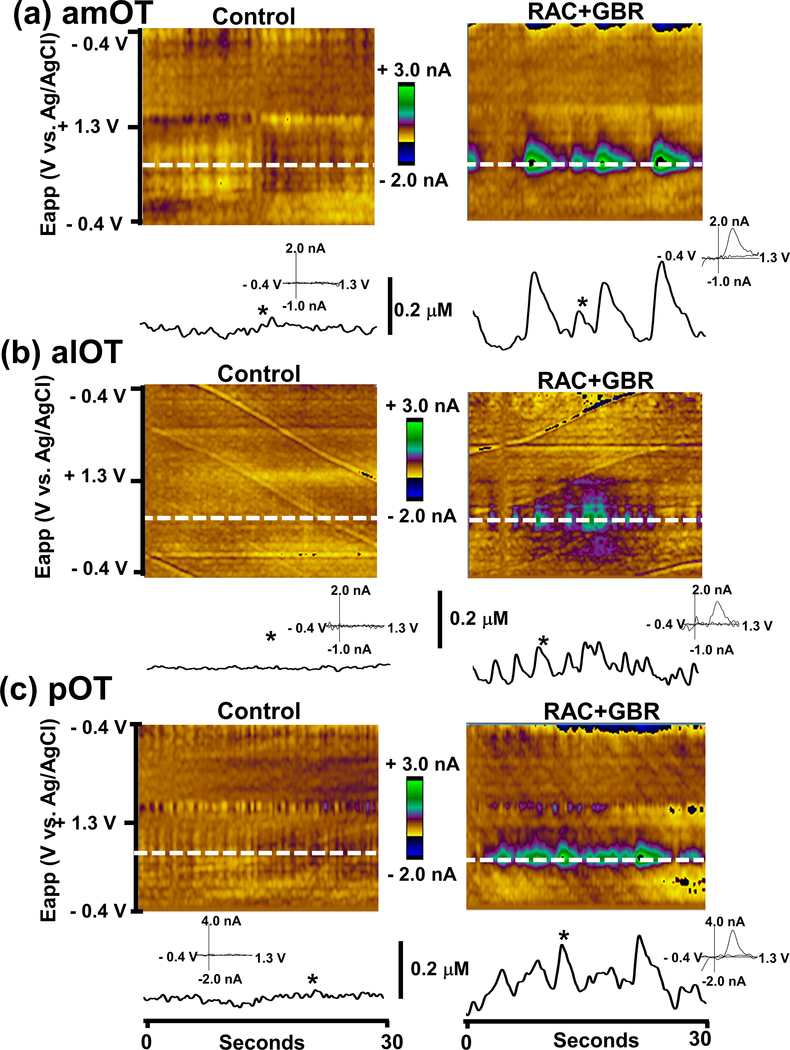
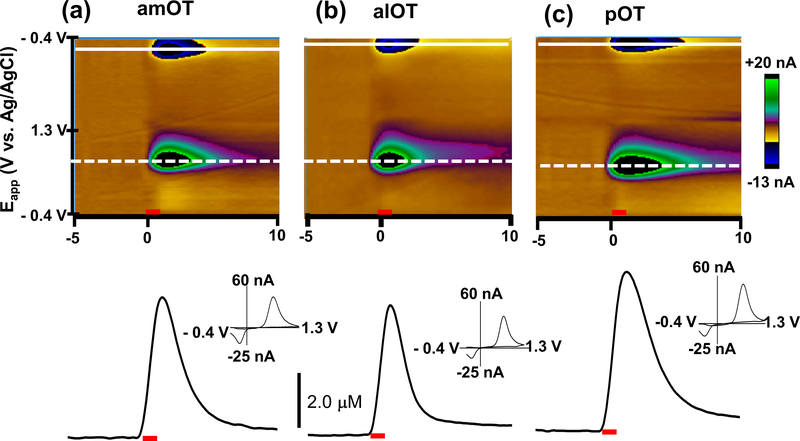
Recent studies show that dense dopamine (DA) innervation from the ventral tegmental area to the olfactory tubercle (OT) may play an important role in processing multisensory information pertaining to arousal and reward, yet little is known about DA regulation in the OT. This is mainly due to the anatomical limitations of conventional methods of determining DA dynamics in small heterogeneous OT subregions located in the ventral most part of the brain. Additionally, there is increasing awareness that anteromedial and anterolateral subregions of the OT have distinct functional roles in natural and psychostimulant drug reinforcement as well as in regulating other types of behavioral responses, such as aversion. Here, we compared extracellular DA regulation (release and clearance) in three subregions (anteromedial, anterolateral, and posterior) of the OT of urethane-anesthetized rats, using in vivo fast-scan cyclic voltammetry following electrical stimulation of ventral tegmental area dopaminergic cell bodies. The neurochemical, anatomical, and pharmacological evidence confirmed that the major electrically evoked catecholamine in the OT was DA across both its anteroposterior and mediolateral extent. While both D2 autoreceptors and DA transporters play important roles in regulating DA evoked in OT subregions, DA in the anterolateral OT was regulated less by the D2 receptors when compared to other OT subregions. Comparing previous data from other DA rich ventral striatum regions, the slow DA clearance across the OT subregions may lead to a high extracellular DA concentration and contribute towards volume transmission. These differences in DA regulation in the terminals of OT subregions and other limbic structures will help us understand the neural regulatory mechanisms of DA in the OT, which may elucidate its distinct functional contribution in the ventral striatum towards mediating aversion, reward and addiction processes.
Keywords: dopamine; dopamine D2 receptors; dopamine transporters; fast-scan cyclic voltammetry; olfactory tubercle; ventral tegmental area.
© 2017 International Society for Neurochemistry.
Figures
Similar articles
-
Distinct limbic dopamine regulation across olfactory-tubercle subregions through integration of in vivo fast-scan cyclic voltammetry and optogenetics.J Neurochem. 2022 Apr;161(1):53-68. doi: 10.1111/jnc.15577. Epub 2022 Feb 5. J Neurochem. 2022. PMID: 35061915 Free PMC article.
-
Application of fast-scan cyclic voltammetry for the in vivo characterization of optically evoked dopamine in the olfactory tubercle of the rat brain.Analyst. 2016 Jun 21;141(12):3746-55. doi: 10.1039/c6an00196c. Epub 2016 Apr 11. Analyst. 2016. PMID: 27063845
-
Noradrenergic Modulation of Dopamine Transmission Evoked by Electrical Stimulation of the Locus Coeruleus in the Rat Brain.ACS Chem Neurosci. 2017 Sep 20;8(9):1913-1924. doi: 10.1021/acschemneuro.7b00078. Epub 2017 Jun 21. ACS Chem Neurosci. 2017. PMID: 28594540
-
Neurobiological model of stimulated dopamine neurotransmission to interpret fast-scan cyclic voltammetry data.Brain Res. 2015 Mar 2;1599:67-84. doi: 10.1016/j.brainres.2014.12.020. Epub 2014 Dec 16. Brain Res. 2015. PMID: 25527399 Review.
-
Alterations in dopamine release but not dopamine autoreceptor function in dopamine D3 receptor mutant mice.J Neurosci. 1998 Mar 15;18(6):2231-8. doi: 10.1523/JNEUROSCI.18-06-02231.1998. J Neurosci. 1998. PMID: 9482807 Free PMC article. Review.
Cited by
-
Distinct limbic dopamine regulation across olfactory-tubercle subregions through integration of in vivo fast-scan cyclic voltammetry and optogenetics.J Neurochem. 2022 Apr;161(1):53-68. doi: 10.1111/jnc.15577. Epub 2022 Feb 5. J Neurochem. 2022. PMID: 35061915 Free PMC article.
-
Cellular Profiles of Prodynorphin and Preproenkephalin mRNA-Expressing Neurons in the Anterior Olfactory Tubercle of Mice.Front Neural Circuits. 2022 Jul 22;16:908964. doi: 10.3389/fncir.2022.908964. eCollection 2022. Front Neural Circuits. 2022. PMID: 35937204 Free PMC article.
-
Neurochemical organization of the ventral striatum's olfactory tubercle.J Neurochem. 2020 Feb;152(4):425-448. doi: 10.1111/jnc.14919. Epub 2020 Jan 7. J Neurochem. 2020. PMID: 31755104 Free PMC article. Review.
-
Distinct dose-dependent effects of methamphetamine on real-time dopamine transmission in the rat nucleus accumbens and behaviors.J Neurochem. 2021 Aug;158(4):865-879. doi: 10.1111/jnc.15470. Epub 2021 Jul 28. J Neurochem. 2021. PMID: 34265079 Free PMC article.
-
Opposing Roles of Dopamine Receptor D1- and D2-Expressing Neurons in the Anteromedial Olfactory Tubercle in Acquisition of Place Preference in Mice.Front Behav Neurosci. 2019 Mar 15;13:50. doi: 10.3389/fnbeh.2019.00050. eCollection 2019. Front Behav Neurosci. 2019. PMID: 30930757 Free PMC article.
References
-
- Agustin-Pavon C, Martinez-Garcia F and Lanuza E (2014) Focal lesions within the ventral striato-pallidum abolish attraction for male chemosignals in female mice. Behav Brain Res, 259, 292–296. - PubMed
-
- Alheid GF and Heimer L (1988) New perspectives in basal forebrain organization of special relevance for neuropsychiatric disorders: the striatopallidal, amygdaloid, and corticopetal components of substantia innominata. Neuroscience, 27, 1–39. - PubMed
-
- Annunziato L, Leblanc P, Kordon C and Weiner RI (1980) Differences in the kinetics of dopamine uptake in synaptosome preparations of the median eminence relative to other dopaminergically inervated brain regions. Neuroendocrinology, 31, 316–320. - PubMed
Publication types
MeSH terms
Substances
Grants and funding
LinkOut - more resources
Full Text Sources
Other Literature Sources
