. 2017 May 12;13(5):e1006793.
doi: 10.1371/journal.pgen.1006793. eCollection 2017 May.

MeCP2 recognizes cytosine methylated tri-nucleotide and di-nucleotide sequences to tune transcription in the mammalian brain

Affiliations

MeCP2 recognizes cytosine methylated tri-nucleotide and di-nucleotide sequences to tune transcription in the mammalian brain

Sabine Lagger et al. PLoS Genet. .

Abstract

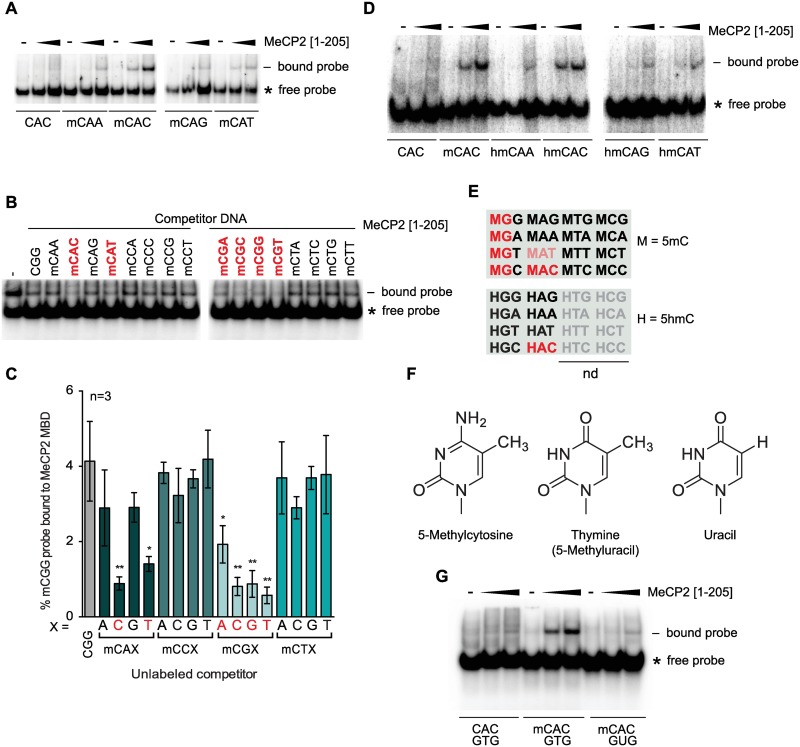
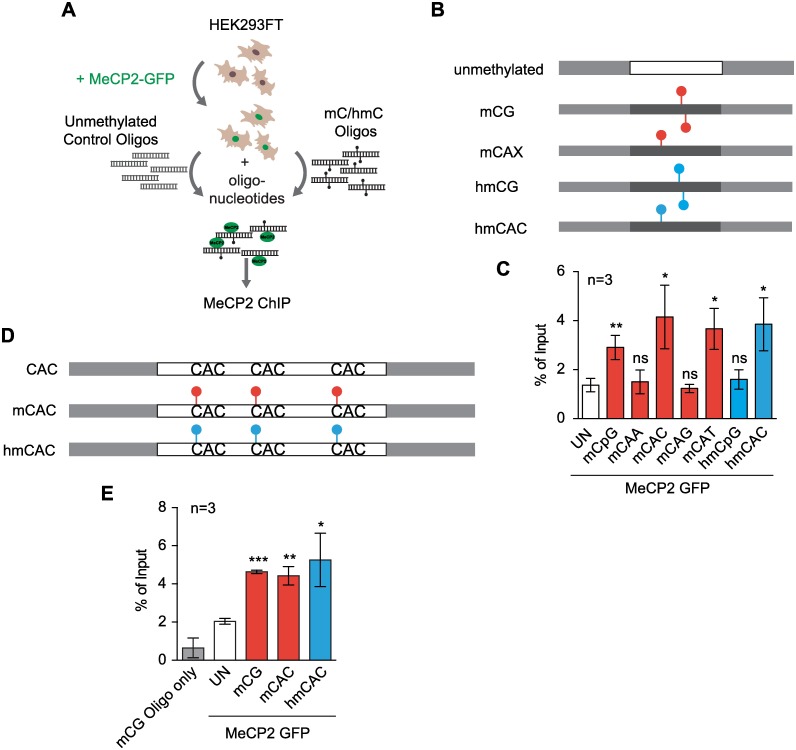
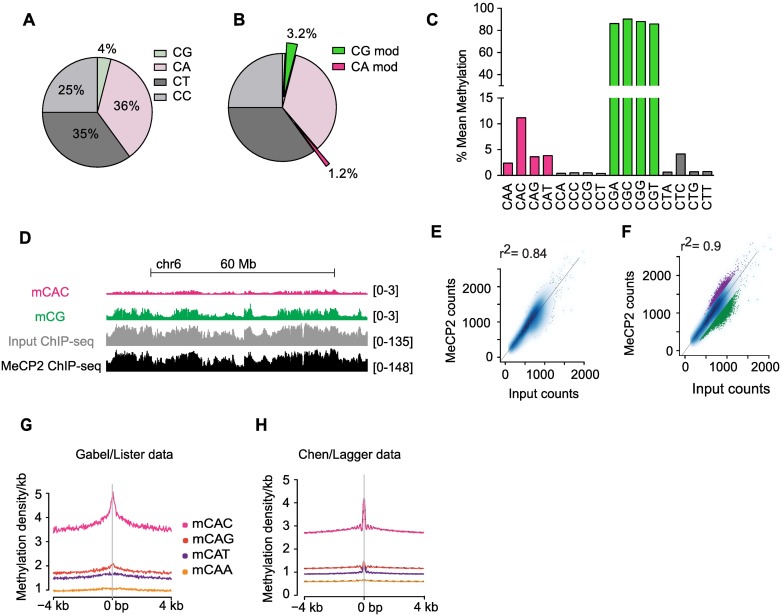
Mutations in the gene encoding the methyl-CG binding protein MeCP2 cause several neurological disorders including Rett syndrome. The di-nucleotide methyl-CG (mCG) is the classical MeCP2 DNA recognition sequence, but additional methylated sequence targets have been reported. Here we show by in vitro and in vivo analyses that MeCP2 binding to non-CG methylated sites in brain is largely confined to the tri-nucleotide sequence mCAC. MeCP2 binding to chromosomal DNA in mouse brain is proportional to mCAC + mCG density and unexpectedly defines large genomic domains within which transcription is sensitive to MeCP2 occupancy. Our results suggest that MeCP2 integrates patterns of mCAC and mCG in the brain to restrain transcription of genes critical for neuronal function.


Conflict of interest statement

The authors have declared that no competing interests exist.

Figures

Fig 1
Fig 1. MeCP2 binds mCAC and hmCAC in vitro.
(A) EMSA using no protein (-) or varying amounts of MeCP2 [1–205] with a probe (S1 Table) containing a centrally methylated C in a CAX context. Gap indicates separate gels. (B) EMSA using MeCP2 [1–205] or no added protein (-) in the presence of excess unlabeled unmethylated competitor DNA (CGG) or methylated competitor DNA (mCXX). Labeled probe contains mCGG. Red denotes strongest competition. (C) Quantification of (B). Three individual experiments were averaged. Red denotes most significant competition. Significance was calculated in relation to unmethylated CGG (grey bar). Error bars represent ± SD. Students unpaired t-test: * p<0.05; ** p<0.01. (D) EMSA using no protein (-) or varying amounts of MeCP2 [1–205] with a probe containing a centrally hydroxymethylated C in a CAX triplet context. (E) Summary of MeCP2 binding motifs in vitro. M = 5-methylcytosine, H = 5-hydroxymethylcytosine. Bright red: strong binding; pale red: weaker binding; grey: not tested. (F) Structure of 5-methylcytosine, thymine and uracil. Note that thymine and uracil are distinguishable by a methyl group on position 5 of the pyrimidine ring. (G) EMSA using no (-) or varying amounts of MeCP2 [1–205] to assess the influence of the methyl group of thymine on binding. *: free probe;—: bound probe.
Fig 2
Fig 2. Full-length MeCP2 binds mCAC and hmCAC in vivo.
(A) Schematic of in vivo transfection assay in HEK293FT cells. (B) Differentially modified oligonucleotide derived from the mouse Bdnf locus. Light grey: T3 and M13-20 adapters; red circles: mC; blue circles: hmC. See also S1 and S2 Tables. (C) Real Time PCR of in vivo transfection assay in triplicate where WT MeCP2-GFP was co-transfected with oligonucleotide as described in (B). (D) Differentially modified oligonucleotide at three CAC sites. See also S1 and S2 Tables. Light grey: T3 and M13-20 adapters; red circles: mC; blue circles: hmC. (E) Real Time PCR of in vivo transfection assay in triplicates where WT MeCP2-GFP was co-transfected with oligonucleotides as described in (D). Real Time PCR results are presented as % of Input (red bars: mC; blue bars: hmC, white bars: unmethylated; grey bar: mCG oligonucleotide transfected without prior transfection of MeCP2-GFP as a background control). Error bars represent ± SD. Significance was calculated in relation to unmethylated oligonucleotide transfections (white bars). Students unpaired t-test: ns p>0.05; * p<0.05; ** p<0.01; *** p<0.001.
Fig 3
Fig 3. DNA methylation and MeCP2 binding in the mouse brain.
(A) Pie chart showing CX frequencies in the mouse genome (dataset WGBS of sorted neurons from this study). (B) Pie chart showing modified (mC and hmC) CX frequencies in brain neuronal nuclei as determined by WGBS (dataset WGBS of sorted neurons from this study). (C) Mean methylation levels (%) of CXX in brain neuronal nuclei based on WGBS of sorted neurons (dataset from this study). (D) IGV browser screenshot of mCAC, mCG, MeCP2 ChIP-seq and corresponding Input DNA based on sequence reads. Data represent a 100 Mb region of chromosome 6 (datasets from [3,27]). (E) Correlation between sequence coverage of MeCP2 ChIP-seq and corresponding Input DNA in 10 kb windows. Fitting a linear model (MeCP2 ~ Input) yields a coefficient of determination of 0.84 (dataset from [27]). (F) As for (E) but highlighting relative depletion (4.1% of windows; green) and relative enrichment (1.7% of windows; purple). When these outliers are excluded, 90% of the variability of the MeCP2 signal in the remaining binned windows is explained by sequence bias (Input coverage) (dataset from [27]). (G-H) Enrichment of mCAC at summits of MeCP2 binding using ChIP-seq and WGBS datasets from matching brain regions ([3,26] (G) and [27] and this study (H)).
Fig 4
Fig 4. MeCP2 binds to mCG and mCAC in large domains extending beyond the gene scale.
(A) Density of mCG/mCAC or unmethylated CG per 1kb as a function of ChIP-seq Input coverage in protein-coding genes. The density of tick marks on the x-axis represents the distribution of genes with respect to Input coverage (datasets from [27] and hypothalamus WGBS from this study). (B) As in (A) but for MeCP2 ChIP-seq read coverage on the x-axis. (C) As in (A and B) but corrected for Input and shown as log2(MeCP2 ChIP/Input) (datasets from [27] and hypothalamus WGBS from this study). (D) As in (C) showing additionally the combined density of mCG + mCAC sites (grey line) (datasets from [27] and hypothalamus WGBS from this study). (E) Relationship between mCG and unmethylated CG density/kb and MeCP2 occupancy corrected for Input in genome-wide 1 kb windows (datasets from [27] and hypothalamus WGBS from this study). (F) Relationship between mCAX and, as a negative control, mCTC density/kb and MeCP2 occupancy corrected for Input in genome-wide 1 kb windows (datasets from [27] and hypothalamus WGBS from this study). (G-H) Domains of MeCP2 enrichment and depletion as determined by MSR (datasets from [27] and hypothalamus WGBS from this study). Grey dotted line indicates zero. (G) Heatmap showing number of segments binned by their scale (x-axis) and MeCP2 enrichment scores (y-axis). X-axis shows the median lengths of segments found with a given scale. Positive scores on the y-axis indicate MeCP2 enrichment; negative scores indicate MeCP2 depletion. The plot is colored according to number of segments. (H) Heatmap showing number of segments binned by scale and scored as in (G). The plot is colored according to combined mCG + mCAC density.
Fig 5
Fig 5. Genes show global down-regulation in KO, but MeCP2 enriched genes are up-regulated upon MeCP2 depletion and down-regulated when MeCP2 is overexpressed.
Datasets [27] and hypothalamus WGBS from this study. (A-B) Aggregate WT MeCP2 occupancy plotted 100 kb up- and down-stream of the transcription start site (TSS) of genes that are up-regulated (purple), down-regulated (green) or unchanged (black) in (A) Mecp2 KO or (B) Mecp2 OE hypothalamus. (C-D) Methylation density per kb of CAC and (E-F) CG plotted 100 kb up- and down-stream of the TSS using the same gene sets as in (A) and (B) respectively. (G) IGV screenshot of chromosome 5 (chr5:95,751,179–110,732,516) showing unpruned MSR regions of scale 30, corresponding to a median segment length of 270 kb and 240 kb for MeCP2 enriched and MeCP2 depleted segments, respectively using datasets from [27] and hypothalamus WGBS from this study. (H) Pie charts showing percentage of up- (left) and down-regulated (right) genes and their overlap with MeCP2 enriched (purple) or depleted (green) domains using dataset [27] and hypothalamus WGBS from this study. (I-J) Transcriptional changes resulting from MeCP2 deficiency as a function of MeCP2 occupancy. Genes that are up-regulated in KO (purple) have high MeCP2 occupancy and show the strongest up-regulation in KO (I) and robust down-regulation in OE (J). FC = fold change. Histogram depicting the correlation between MeCP2 occupancy and % of genes that are up- (purple), down-regulated (green) and unchanged (grey). Dataset [27]. (K-L) MeCP2 occupancy and expression changes are well correlated at genes previously implicated in neurological diseases [42]: Spearman correlation coefficients of 0.67 for KO vs WT (K) and -0.5 for OE vs WT (L) Dataset [27].
Fig 6
Fig 6. Hypothetical modeling of MeCP2 tri-nucleotide recognition suggests that flexibility may depend on the R133 side chain and require the methyl group of thymine.
(A) X-ray structure of MeCP2 [77–167] interaction with the mCG di-nucleotide in double-strand DNA [43]. Critical amino acids R111, R133 and D121 are shown in pink. Green sphere: methyl group; grey sphere: water molecule; green dotted lines (from R111 and D121): favorable interactions; grey dotted lines: hydrogen bonds. (B) Modeling of the MeCP2 [77–167] interaction with double-strand DNA containing mCAC. Key as in (A) and black dotted lines: modeled interactions. See extended legend to S6 Fig for rationale.

References

    1. Li E, Bestor TH, Jaenisch R. Targeted mutation of the DNA methyltransferase gene results in embryonic lethality. Cell. 1992;69: 915–26. Consulté: http://www.ncbi.nlm.nih.gov/pubmed/1606615 - PubMed
    1. Guo JU, Su Y, Shin JH, Shin J, Li H, Xie B, et al. Distribution, recognition and regulation of non-CpG methylation in the adult mammalian brain. Nat Neurosci. 2014;17: 215–22. 10.1038/nn.3607 - DOI - PMC - PubMed
    1. Lister R, Mukamel EA, Nery JR, Urich M, Puddifoot CA, Johnson ND, et al. Global epigenomic reconfiguration during mammalian brain development. Science. 2013;341: 1237905 10.1126/science.1237905 - DOI - PMC - PubMed
    1. Ramsahoye BH, Biniszkiewicz D, Lyko F, Clark V, Bird AP, Jaenisch R. Non-CpG methylation is prevalent in embryonic stem cells and may be mediated by DNA methyltransferase 3a. Proc Natl Acad Sci U S A. 2000;97: 5237–42. Consulté: http://www.pubmedcentral.nih.gov/articlerender.fcgi?artid=25812&tool=pmc... - PMC - PubMed
    1. Aoki A, Suetake I, Miyagawa J, Fujio T, Chijiwa T, Sasaki H, et al. Enzymatic properties of de novo-type mouse DNA (cytosine-5) methyltransferases. Nucleic Acids Res. 2001;29: 3506–12. Consulté: http://www.pubmedcentral.nih.gov/articlerender.fcgi?artid=55888&tool=pmc... - PMC - PubMed