

Overexpression of Rev1 promotes the development of carcinogen-induced intestinal adenomas via accumulation of point mutation and suppression of apoptosis proportionally to the Rev1 expression level
- PMID: 28498946
- PMCID: PMC5872566
- DOI: 10.1093/carcin/bgw208
Overexpression of Rev1 promotes the development of carcinogen-induced intestinal adenomas via accumulation of point mutation and suppression of apoptosis proportionally to the Rev1 expression level
Abstract
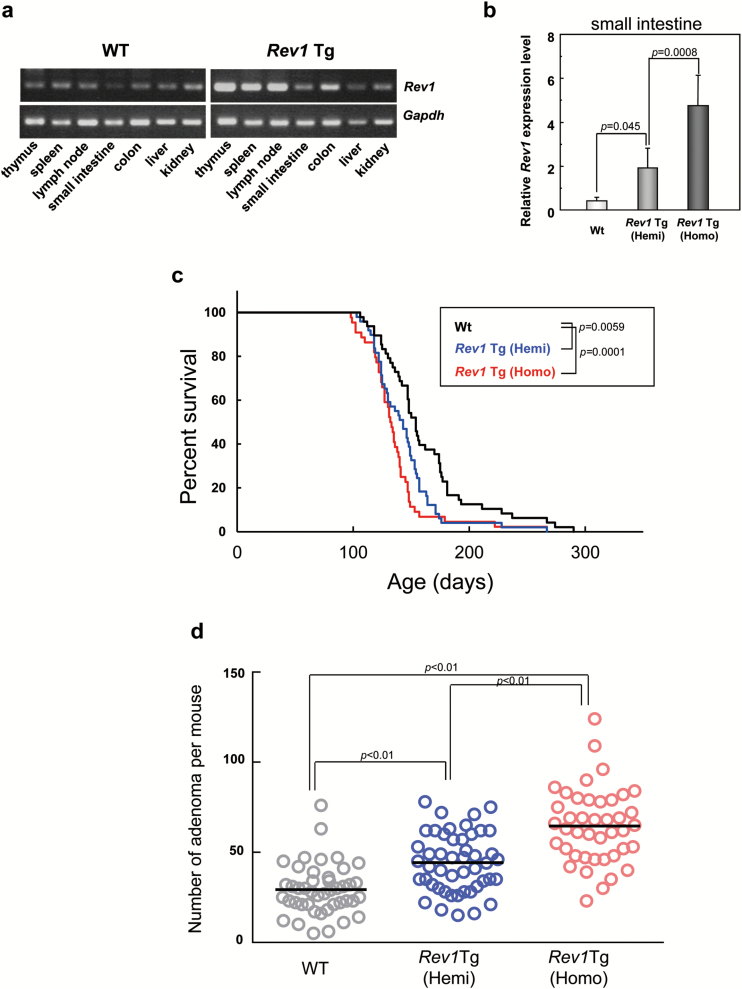
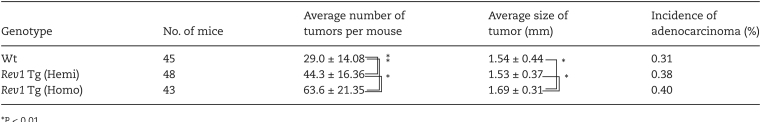
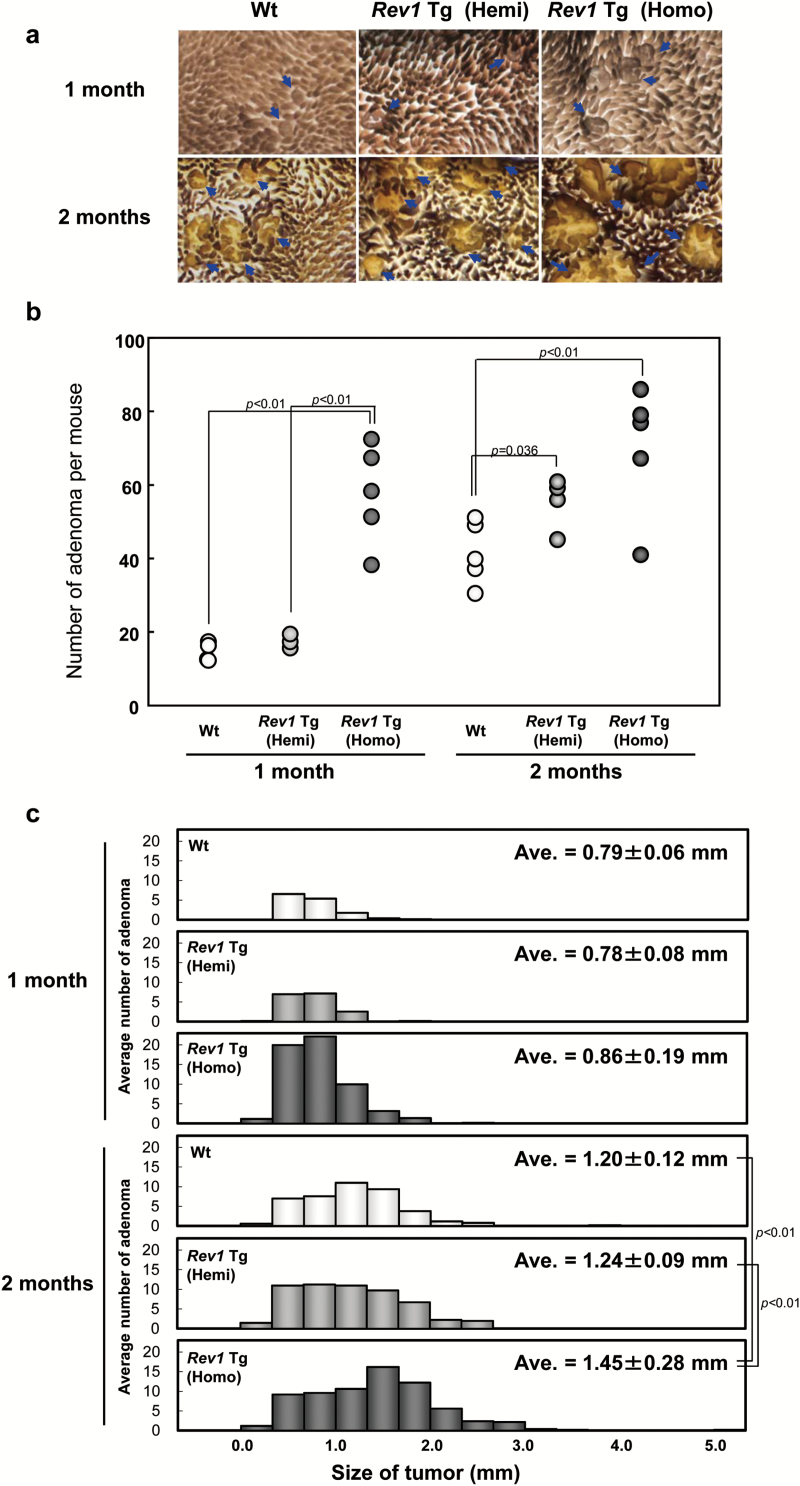
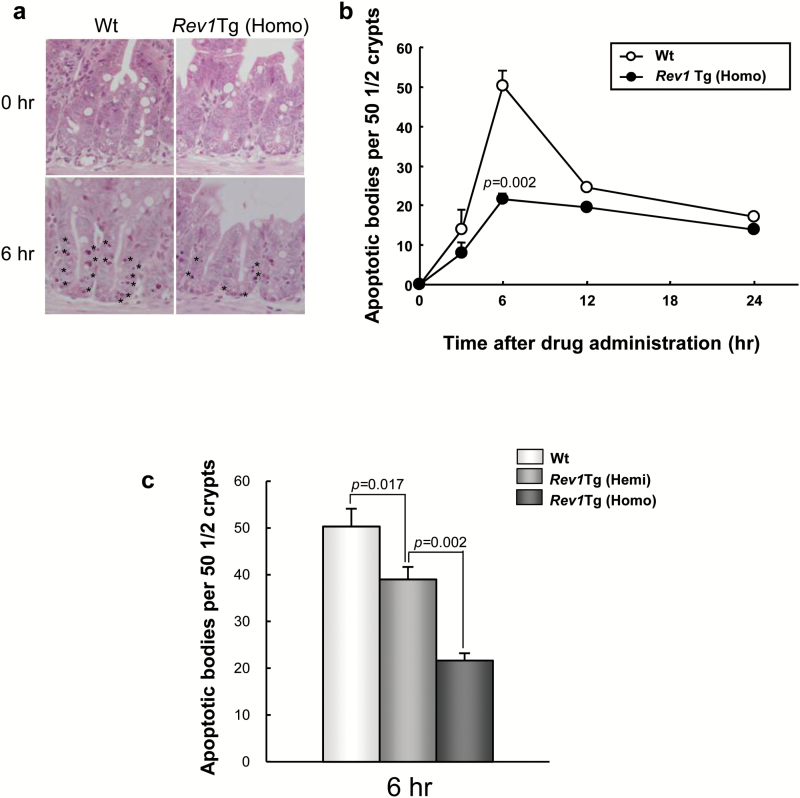
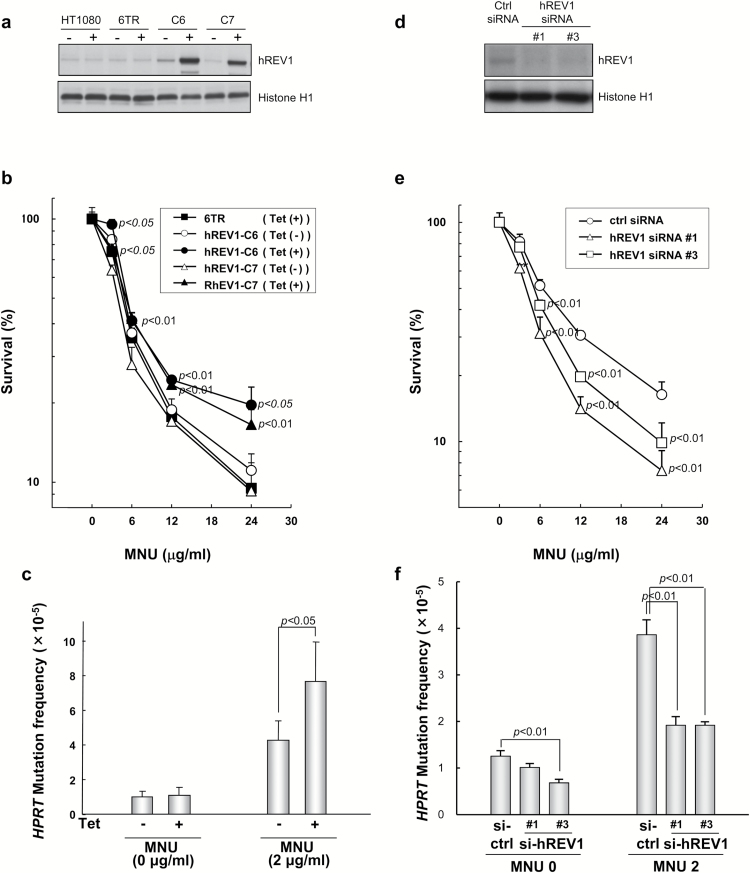
Cancer development often involves mutagenic replication of damaged DNA by the error-prone translesion synthesis (TLS) pathway. Aberrant activation of this pathway plays a role in tumorigenesis by promoting genetic mutations. Rev1 controls the function of the TLS pathway, and Rev1 expression levels are associated with DNA damage induced cytotoxicity and mutagenicity. However, it remains unclear whether deregulated Rev1 expression triggers or promotes tumorigenesis in vivo. In this study, we generated a novel Rev1-overexpressing transgenic (Tg) mouse and characterized its susceptibility to tumorigenesis. Using a small intestinal tumor model induced by N-methyl-N-nitrosourea (MNU), we found that transgenic expression of Rev1 accelerated intestinal adenoma development in proportion to the Rev1 expression level; however, overexpression of Rev1 alone did not cause spontaneous development of intestinal adenomas. In Rev1 Tg mice, MNU-induced mutagenesis was elevated, whereas apoptosis was suppressed. The effects of hREV1 expression levels on the cytotoxicity and mutagenicity of MNU were confirmed in the human cancer cell line HT1080. These data indicate that dysregulation of cellular Rev1 levels leads to the accumulation of mutations and suppression of cell death, which accelerates the tumorigenic activities of DNA-damaging agents.
© The Author 2017. Published by Oxford University Press.
Figures
Similar articles
-
Rev1 overexpression accelerates N-methyl-N-nitrosourea (MNU)-induced thymic lymphoma by increasing mutagenesis.Cancer Sci. 2024 Jun;115(6):1808-1819. doi: 10.1111/cas.16159. Epub 2024 Apr 4. Cancer Sci. 2024. PMID: 38572512 Free PMC article.
-
The in vivo role of Rev1 in mutagenesis and carcinogenesis.Genes Environ. 2020 Feb 28;42:9. doi: 10.1186/s41021-020-0148-1. eCollection 2020. Genes Environ. 2020. PMID: 32161626 Free PMC article. Review.
-
Identification of Small Molecule Translesion Synthesis Inhibitors That Target the Rev1-CT/RIR Protein-Protein Interaction.ACS Chem Biol. 2017 Jul 21;12(7):1903-1912. doi: 10.1021/acschembio.6b01144. Epub 2017 Jun 9. ACS Chem Biol. 2017. PMID: 28541665 Free PMC article.
-
Interaction with DNA polymerase eta is required for nuclear accumulation of REV1 and suppression of spontaneous mutations in human cells.DNA Repair (Amst). 2009 May 1;8(5):585-99. doi: 10.1016/j.dnarep.2008.12.006. Epub 2009 Jan 21. DNA Repair (Amst). 2009. PMID: 19157994
-
Review: Animal models of N-Methyl-N-nitrosourea-induced mammary cancer and retinal degeneration with special emphasis on therapeutic trials.In Vivo. 2011 Jan-Feb;25(1):11-22. In Vivo. 2011. PMID: 21282729 Review.
Cited by
-
REV1 promotes lung tumorigenesis by activating the Rad18/SERTAD2 axis.Cell Death Dis. 2022 Feb 3;13(2):110. doi: 10.1038/s41419-022-04567-5. Cell Death Dis. 2022. PMID: 35115490 Free PMC article.
-
Diverse roles of RAD18 and Y-family DNA polymerases in tumorigenesis.Cell Cycle. 2018;17(7):833-843. doi: 10.1080/15384101.2018.1456296. Epub 2018 May 8. Cell Cycle. 2018. PMID: 29683380 Free PMC article. Review.
-
Structures of REV1 UBM2 Domain Complex with Ubiquitin and with a Small-Molecule that Inhibits the REV1 UBM2-Ubiquitin Interaction.J Mol Biol. 2018 Aug 17;430(17):2857-2872. doi: 10.1016/j.jmb.2018.05.042. Epub 2018 Jun 2. J Mol Biol. 2018. PMID: 29864443 Free PMC article.
-
Unravelling roles of error-prone DNA polymerases in shaping cancer genomes.Oncogene. 2021 Dec;40(48):6549-6565. doi: 10.1038/s41388-021-02032-9. Epub 2021 Oct 18. Oncogene. 2021. PMID: 34663880 Free PMC article. Review.
-
Role of Translesion DNA Synthesis in the Metabolism of Replication-associated Nascent Strand Gaps.J Mol Biol. 2024 Jan 1;436(1):168275. doi: 10.1016/j.jmb.2023.168275. Epub 2023 Sep 13. J Mol Biol. 2024. PMID: 37714300 Free PMC article. Review.
References
-
- Lawrence C.W. (2002) Cellular roles of DNA polymerase zeta and Rev1 protein. DNA Repair (Amst)., 1, 425–435. - PubMed
-
- Lawrence C.W. (2004) Cellular functions of DNA polymerase zeta and Rev1 protein. Adv. Protein Chem., 69, 167–203. - PubMed
-
- Ohmori H., et al. (2001) The Y-family of DNA polymerases. Mol. Cell, 8, 7–8. - PubMed
MeSH terms
Substances
LinkOut - more resources
Full Text Sources
Other Literature Sources
Molecular Biology Databases
Miscellaneous
