. 2017 Jul 1;158(7):2168-2178.
doi: 10.1210/en.2016-1796.

Deletion of RhoA in Progesterone Receptor-Expressing Cells Leads to Luteal Insufficiency and Infertility in Female Mice

Affiliations

Deletion of RhoA in Progesterone Receptor-Expressing Cells Leads to Luteal Insufficiency and Infertility in Female Mice

Ahmed E El Zowalaty et al. Endocrinology. .

Abstract

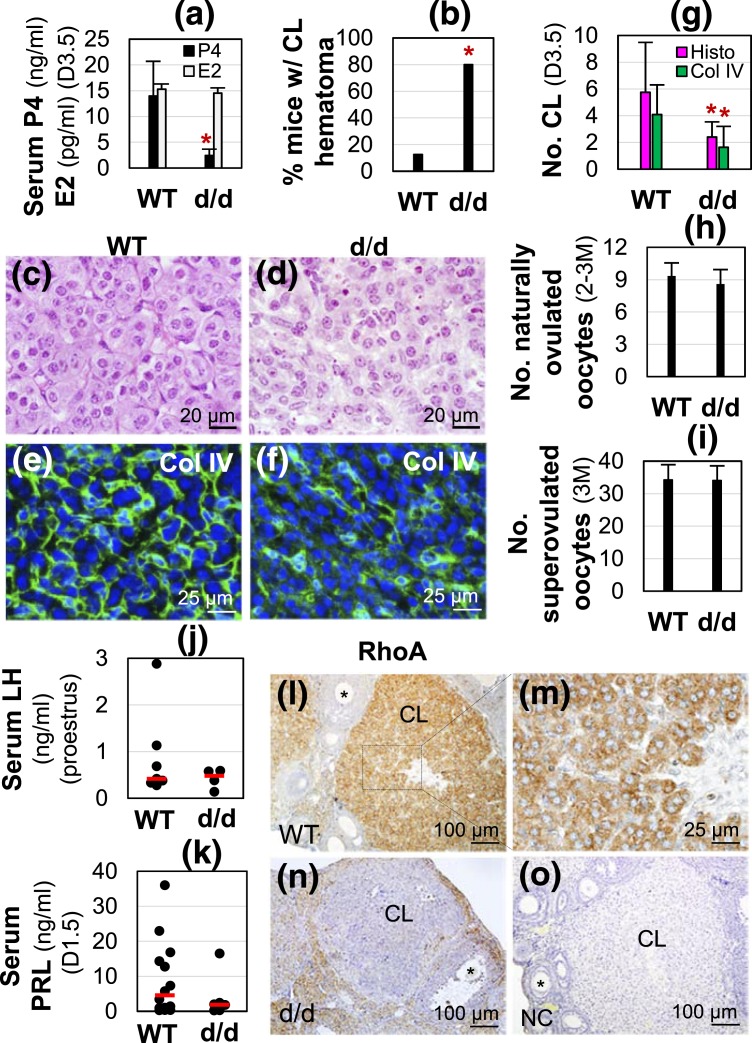
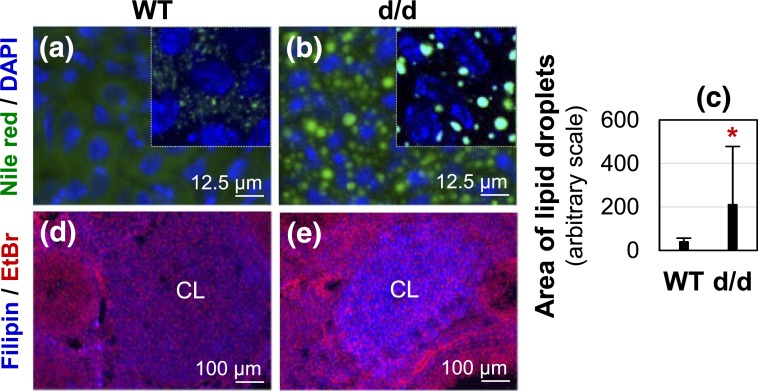
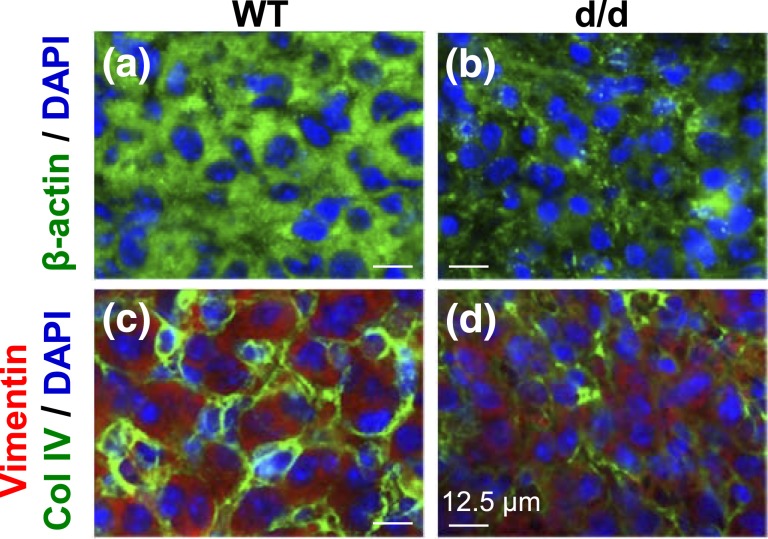
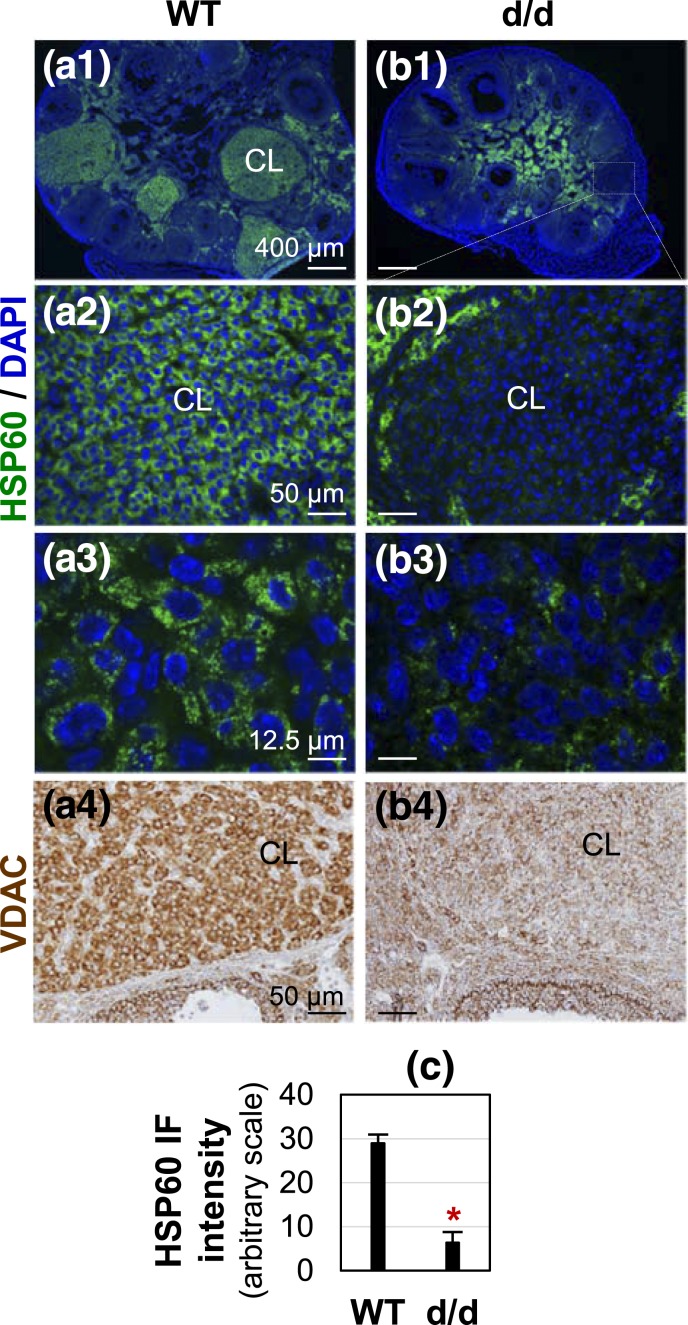
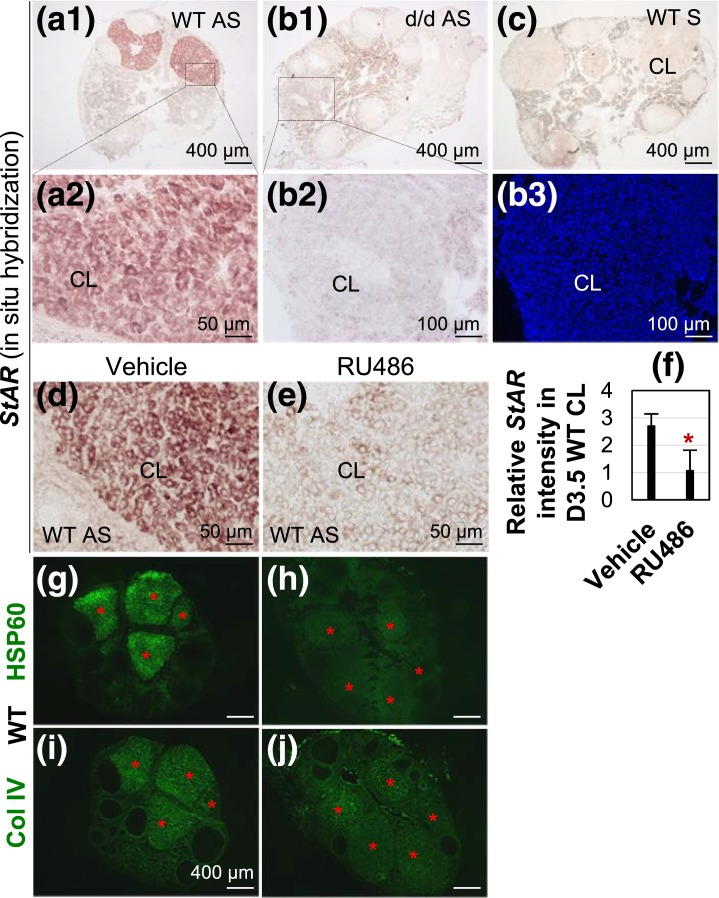
Ras homolog gene family, member A (RhoA) is widely expressed throughout the female reproductive system. To assess its role in progesterone receptor-expressing cells, we generated RhoA conditional knockout mice RhoAd/d (RhoAf/f-Pgr-Cre+/-). RhoAd/d female mice had comparable mating activity, serum luteinizing hormone, prolactin, and estradiol levels and ovulation with control but were infertile with progesterone insufficiency, indicating impaired steroidogenesis in RhoAd/d corpus luteum (CL). RhoA was highly expressed in wild-type luteal cells and conditionally deleted in RhoAd/d CL. Gestation day 3.5 (D3.5) RhoAd/d ovaries had reduced numbers of CL, less defined corpus luteal cord formation, and disorganized CL collagen IV staining. RhoAd/d CL had lipid droplet and free cholesterol accumulation, indicating the availability of cholesterol for steroidogenesis, but disorganized β-actin and vimentin staining, indicating disrupted cytoskeleton integrity. Cytoskeleton is important for cytoplasmic cholesterol movement to mitochondria and for regulating mitochondria. Dramatically reduced expression of mitochondrial markers heat shock protein 60 (HSP60), voltage-dependent anion channel, and StAR was detected in RhoAd/d CL. StAR carries out the rate-limiting step of steroidogenesis. StAR messenger RNA expression was reduced in RU486-treated D3.5 wild-type CL and tended to be induced in progesterone-treated D3.5 RhoAd/d CL, with parallel changes of HSP60 expression. These data demonstrated the in vivo function of RhoA in CL luteal cell cytoskeleton integrity, cholesterol transport, StAR expression, and progesterone synthesis, and a positive feedback on StAR expression in CL by progesterone signaling. These findings provide insights into mechanisms of progesterone insufficiency.


Figures

Figure 1.
Figure 1.
RhoAd/d (d/d) female infertility, hormonal profiles, and RhoA expression in CL. (a) Serum progesterone (P4, ng/mL) and estradiol (E2, pg/mL) levels in D3.5 female mice (n = 9 to 12). *P < 0.05. Error bar indicates standard deviation. (b) Percentage of mice with CL hematoma (n = 5 to 8). (c) WT D3.5 ovary histology. (d) D3.5 RhoAd/d (d/d) ovary histology. (e and f) Collagen IV immunofluorescence in (e) D3.5 WT and (f) RhoAd/d CL. (c–f) Images with lower magnifications are shown in Supplemental Fig. 2. (g) Average total number of CL per ovary in D3.5 ovaries by histology (Histo) and average number of CL per ovary from D3.5 ovary sections by collagen IV (Col IV) staining (n = 5 to 11). (h) Number of naturally ovulated oocytes per mouse from 2- to 3-month-old female mice detected on D0.5 (n = 5 to 9). (i) Number of superovulated oocytes per mouse from 3-month-old (3M) female mice (n = 4 or 5). In (a, g, h and i), *P < 0.05. Error bar indicates standard deviation. (j) Serum LH levels on proestrus stage (n = 4 to 7). (k) Serum prolactin (PRL) levels on D1.5 at 1800 hours (n = 6 to 14). (j and k) Each dot represents one individual mouse (2 to 3 months old); the red line indicates the median in each group. (l–o) RhoA immunohistochemistry. (l) RhoA expression in D3.5 WT ovary. (m) Enlarged from boxed area in (l) showing RhoA expression in luteal cells. (n) RhoA expression in D3.5 RhoAd/d ovary. (o) Negative control (NC) of a D3.5 WT ovarian section.
Figure 2.
Figure 2.
(a–c) Nile red staining of lipid droplets and (d, e) filipin staining of free cholesterol in gestation D3.5 (a and d) WT and (b and e) RhoAd/d ovaries. In (a and b), green indicates Nile red staining, blue indicates DAPI staining nuclei, and inserts are confocal images. (c) Quantification of fluorescent areas of lipid droplets (n = 32 to 41 randomly selected lipid droplets). *P < 0.05. Error bar indicates standard deviation. In (d and e), blue indicates filipin staining, and red indicates EtBr staining nuclei. (a, b, d, and e) Images with lower magnifications are provided in Supplemental Fig. 4.
Figure 3.
Figure 3.
Immunofluorescence detection of (a and b) β-actin and (c and d) vimentin in D3.5 (a and c) WT corpus luteum and (b and d) RhoAd/d corpus luteum. In (a and b), green indicates β-actin, and blue indicates DAPI staining nuclei. In (c and d), green indicates Col IV, red indicates vimentin, and blue indicates DAPI staining nuclei. Scale bar, 12.5 µm. (a–d) Images with lower magnifications are provided in Supplemental Fig. 5.
Figure 4.
Figure 4.
Detection of mitochondrial markers HSP60 and VDAC in D3.5 (a) WT and (b) RhoAd/d corpora lutea. (a1–b3) Detection of HSP60 by immunofluorescence. HSP60 staining is shown in green; DAPI staining is shown in blue. (a3 and b3) Confocal images of CL from sections in (a1) and (b1), respectively. (a4–b4) Detection of VDAC by immunohistochemistry. VDAC staining is in brown. Scale bars, (a1 and b1) 400 µm, (a2 and b2) 50 µm, (a3 and b3) 12.5 µm, and (a4 and b4) 50 µm. (c) Quantification of HSP60 immunofluorescence intensity in D3.5 WT and RhoAd/d CL (n = 3 to 5). *P < 0.05. Error bar indicates standard deviation.
Figure 5.
Figure 5.
Detection of StAR mRNA expression in D3.5 ovaries by in situ hybridization and regulation of StAR mRNA by RU486 AS, StAR antisense probe; S, StAR sense probe for negative control. (a1) StAR expression in D3.5 WT CL. (a2) Enlarged from the boxed area in A1. (b1) StAR expression in D3.5 RhoAd/d CL. (b2) Enlarged from the boxed area in B1. (b3) DAPI staining of the section in B2. (c) Negative control using WT section and StAR sense probe. (d) StAR expression in D3.5 vehicle-treated WT CL. (e) StAR expression in D3.5 RU486-treated WT CL. (f) Relative StAR expression intensity in D3.5 vehicle and RU486-treated RhoAd/d CL (n = 5). *P < 0.05. Error bar indicates standard deviation. (g and h) Expression of HSP60 in D3.5 vehicle- and RU486-treated WT CL. (i and j) Col IV staining of a nearby section each to the sections in (g) and (h), respectively, to confirm the positions of CL. Red star, CL.

Similar articles

Cited by

References

    1. Shimokawa H, Sunamura S, Satoh K. RhoA/Rho-kinase in the cardiovascular system. Circ Res. 2016;118(2):352–366. - PubMed
    1. Zhou X, Zheng Y. Cell type-specific signaling function of RhoA GTPase: lessons from mouse gene targeting. J Biol Chem. 2013;288(51):36179–36188. - PMC - PubMed
    1. Yu OM, Brown JHG. G protein-coupled receptor and RhoA-stimulated transcriptional responses: links to inflammation, differentiation, and cell proliferation. Mol Pharmacol. 2015;88(1):171–180. - PMC - PubMed
    1. Rhee SH, Zhang P, Hunter K, Mama ST, Caraballo R, Holzberg AS, Seftel RH, Seftel AD, Echols KT, DiSanto ME. Pelvic organ prolapse is associated with alteration of sphingosine-1-phosphate/Rho-kinase signalling pathway in human vaginal wall. J Obstet Gynaecol. 2015;35(7):726–732. - PubMed
    1. Xiao S, Diao H, Zhao F, Li R, He N, Ye X. Differential gene expression profiling of mouse uterine luminal epithelium during periimplantation. Reprod Sci. 2014;21(3):351–362. - PMC - PubMed

Publication types