. 2017 Jun 20;45(11):6589-6599.
doi: 10.1093/nar/gkx403.

Strong transcription blockage mediated by R-loop formation within a G-rich homopurine-homopyrimidine sequence localized in the vicinity of the promoter

Affiliations

Strong transcription blockage mediated by R-loop formation within a G-rich homopurine-homopyrimidine sequence localized in the vicinity of the promoter

Boris P Belotserkovskii et al. Nucleic Acids Res. .

Abstract

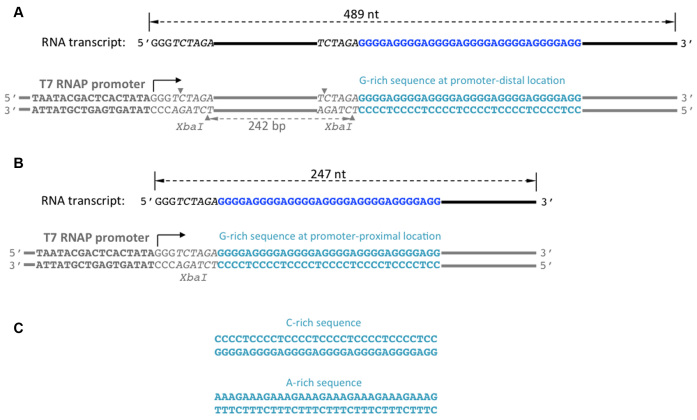
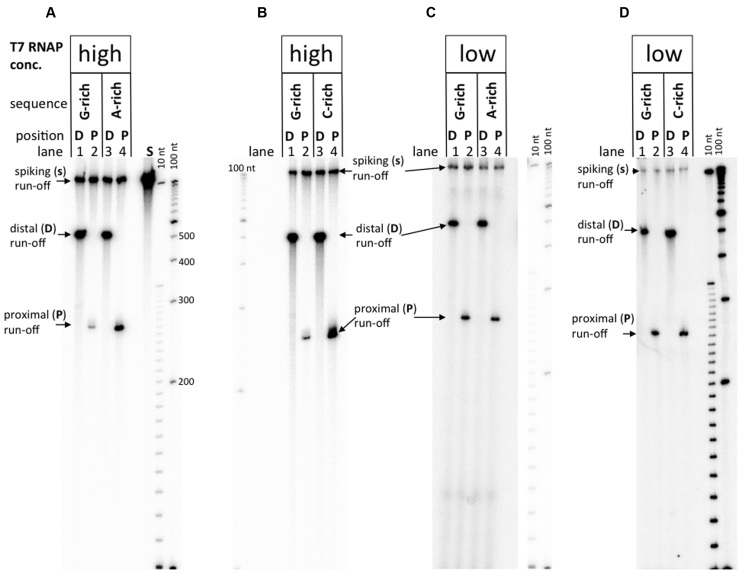
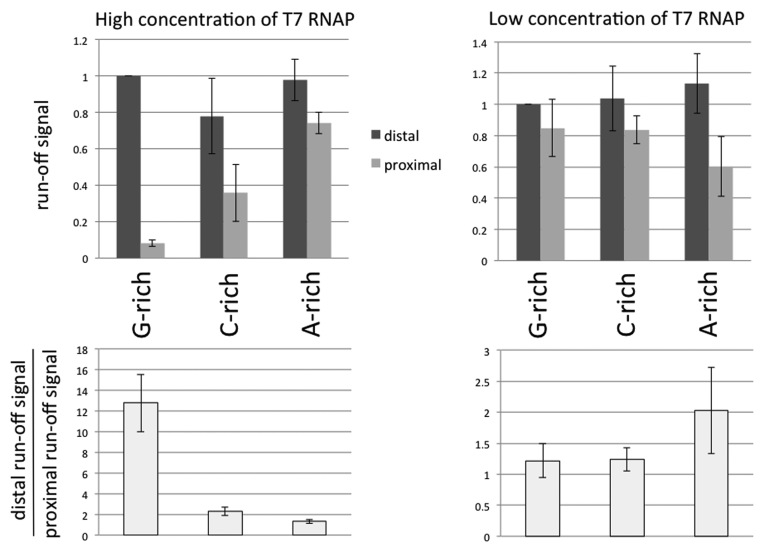
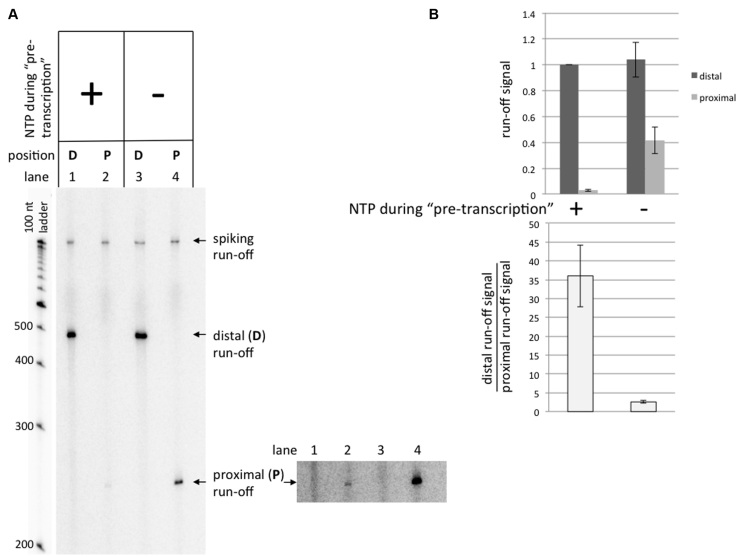
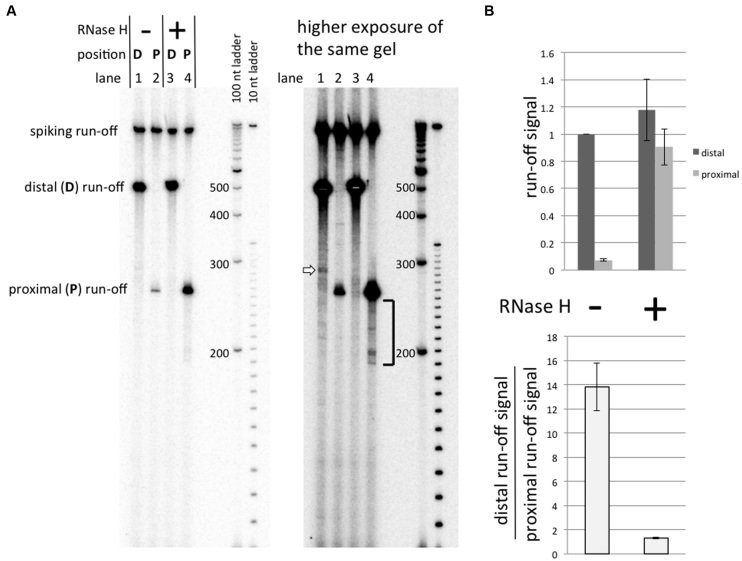
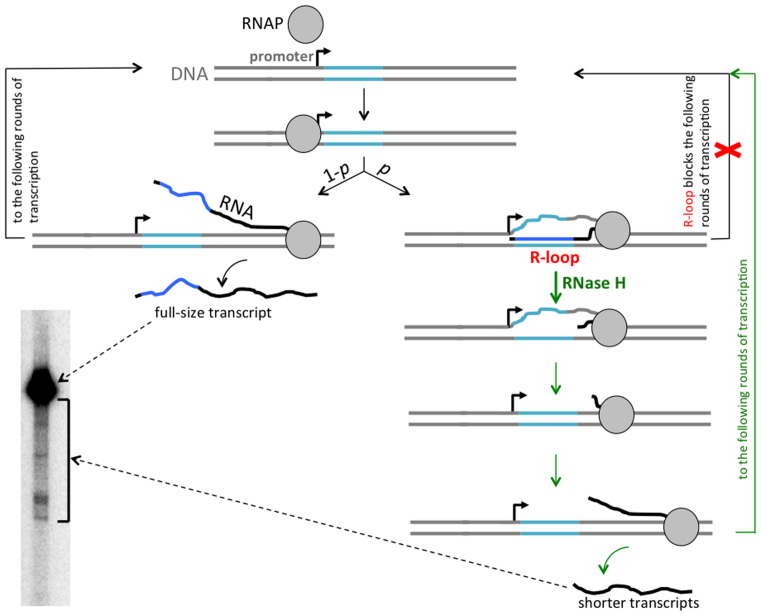
Guanine-rich (G-rich) homopurine-homopyrimidine nucleotide sequences can block transcription with an efficiency that depends upon their orientation, composition and length, as well as the presence of negative supercoiling or breaks in the non-template DNA strand. We report that a G-rich sequence in the non-template strand reduces the yield of T7 RNA polymerase transcription by more than an order of magnitude when positioned close (9 bp) to the promoter, in comparison to that for a distal (∼250 bp) location of the same sequence. This transcription blockage is much less pronounced for a C-rich sequence, and is not significant for an A-rich sequence. Remarkably, the blockage is not pronounced if transcription is performed in the presence of RNase H, which specifically digests the RNA strands within RNA-DNA hybrids. The blockage also becomes less pronounced upon reduced RNA polymerase concentration. Based upon these observations and those from control experiments, we conclude that the blockage is primarily due to the formation of stable RNA-DNA hybrids (R-loops), which inhibit successive rounds of transcription. Our results could be relevant to transcription dynamics in vivo (e.g. transcription 'bursting') and may also have practical implications for the design of expression vectors.


Figures

Figure 1.
Figure 1.
DNA substrates. The designation of homopurine/homopyrimidine sequences (i.e. G-rich, C-rich or A-rich) correspond to the non-template DNA strand. The bottom DNA strand is the template strand (i.e. the one that serves as a template for transcription), the top DNA strand is the non-template strand. DNA is shown in gray, except for the homopurine/homopyrimidine sequence insert shown in turquoise. T7 RNAP promoter is shown in bold, and the transcription start site is designated by a bent arrow. Xba I restriction sites are shown in italic, and the cleavage sites are shown by small gray triangles. DNA substrates are linear, obtained by restriction digestion of the respective supercoiled plasmid (see Materials and Methods). There are no specific transcription termination sites, so unobstructed transcription proceeds to the very end of the DNA template producing full-size (run-off) RNA products. Run-off RNA products are shown above the respective DNA templates in black, except for the homopurine sequence shown in dark-blue. The sizes of run-off transcription products are indicated by black dashed double-arrowed lines. (A) Substrate with promoter–distal location of the homopurine/homopyrimidine sequence (the G-rich sequence is shown). The distance between this sequence and the transcription start site is 252 bp. The substrate contains two Xba I restriction sites, one is localized 3 bp downstream from promoter, and the other is localized immediately upstream from the homopurine/homopyrimidine sequences. (B) Upon deletion of the fragment between these two sites, substrate with promoter–proximal location of the homopurine/homopyrimidine sequence (the G-rich sequence is shown) is obtained. In this substrate, the distance between the homopurine/homopyrimidine sequence and the transcription start site is only 9 bp. (C) C-rich and A-rich sequences.
Figure 2.
Figure 2.
Transcription from DNA substrates with two different T7 RNAP concentrations. ‘High’ concentration of T7 RNAP corresponds to 1.7 units/μl; ‘low’ concentration is 30-fold less. Size standards are denatured radioactive labeled DNA fragment ‘ladders’ with step-sizes 100 nt and 10 nt. Panels A–D are representative gel images for various substrates and RNAP concentrations, as indicated in the lane headings.
Figure 3.
Figure 3.
Comparison of transcriptional yields with two different T7 RNAP concentrations. The intensities of full-size (run-off) products (referred as ‘run-off’ signals) were used as a measure for the transcriptional yields. To obtain the molar amounts of the products, the signals were normalized to the number of radioactive nucleotides within the transcript; and to eliminate the effect of loading errors and losses during purification, each signal was normalized to the intensity of the spiking transcript in the same lane (see Materials and Methods). In addition, all run-off signals were normalized to the signal for substrate with promoter–distal G-rich insert; thus, the height of the column that corresponds to this signal is equivalent to 1, and it doesn't have error bars. All experiments were repeated at least twice.
Figure 4.
Figure 4.
‘Pre-transcription’ experiments. Substrates containing the G-rich sequence were used in these experiments. See Results section for description of the experiment. (A) Gel image. At the bottom-right, a higher exposure for the gel section containing run-offs from promoter–proximal substrate is shown. (B) Quantitation of the results. All run-off signals are normalized to the signal for the promoter–distal substrate pre-transcribed in the presence of NTPs.
Figure 5.
Figure 5.
Effect of RNase H upon transcription. Substrates containing the G-rich sequence were used in these experiments. See the Results section for description of the experiment. (A) Gel image. (B) Quantitation of the results. All run-off signals are normalized to the signal for promoter–distal substrate transcribed without RNase H.
Figure 6.
Figure 6.
Model for transcription blockage by R-loop formation in the vicinity of the promoter. The R-loop-prone (G-rich) DNA sequence is shown in turquoise, the rest of DNA is shown in gray, transcript from the R-loop-prone sequence is shown in dark blue, the rest of RNA is shown in black, a bent arrow indicates the transcription start site. RNA polymerase (RNAP) is shown as a gray circle. During transcription, an R-loop is formed with a certain probability p, while transcription proceeds without R-loop formation with probability 1 – p. R-loop formation could be initiated somewhere within the R-loop-prone sequence, but then the nascent RNA tail is likely to invade the entire R-loop-prone sequence (probably, even further upstream to the very start of transcription) as shown. The RNAP that created the R-loop could continue transcription in the ‘R-loop mode’, and then stall, either within, or at some distance downstream from the R-loop-prone sequence. At least some of the stalled RNAPs may remain bound to the DNA template (as shown), or could dissociate (not shown). In any case, R-loop formation blocks further rounds of transcription (the blockage is symbolized by the red crisscross). Addition of RNase H during transcription (all arrows that symbolize transitions within RNase H-related pathway are shown in green) leads to R-loop removal and, consequently, eliminates the blockage (blockage elimination is symbolized by the green path parallel to the crisscrossed path). The substrate DNA molecules from which R-loop was removed, then become available for further rounds of transcription, and would produce some number of normal full-sized transcripts, before an R-loop would form again. In addition, an RNAP stalled within an R-loop could resume transcription upon R-loop removal, producing a shorter transcript. That accounts for the pattern of transcription products obtained in the presence of RNase H (lane 4 in Figure 5, the relevant part of it is placed in the present figure.).

Similar articles

Cited by

References

    1. Belotserkovskii B.P., Mirkin S.M., Hanawalt P.C.. DNA sequences that interfere with transcription: implications for genome function and stability. Chem. Rev. 2013; 113:8620–8637. - PubMed
    1. Belotserkovskii B.P., Liu R., Tornaletti S., Krasilnikova M.M., Mirkin S.M., Hanawalt P.C.. Mechanisms and implications of transcription blockage by guanine-rich DNA sequences. Proc. Natl. Acad. Sci. U.S.A. 2010; 107:12816–12821. - PMC - PubMed
    1. Belotserkovskii B.P., Neil A.J., Saleh S.S., Shin J.H., Mirkin S.M., Hanawalt P.C.. Transcription blockage by homopurine DNA sequences: role of sequence composition and single-strand breaks. Nucleic Acids Res. 2013; 41:1817–1828. - PMC - PubMed
    1. Aguilera A., Garcia-Muse T.. R loops: from transcription byproducts to threats to genome stability. Mol. Cell. 2012; 46:115–124. - PubMed
    1. Chedin F. Nascent connections: R-loops and chromatin patterning. Trends Genet. 2016; 32:828–838. - PMC - PubMed

LinkOut - more resources