. 2017 Aug 1;26(15):2984-3000.
doi: 10.1093/hmg/ddx189.

Consequences of MEGF10 deficiency on myoblast function and Notch1 interactions

Affiliations

Consequences of MEGF10 deficiency on myoblast function and Notch1 interactions

Madhurima Saha et al. Hum Mol Genet. .

Abstract

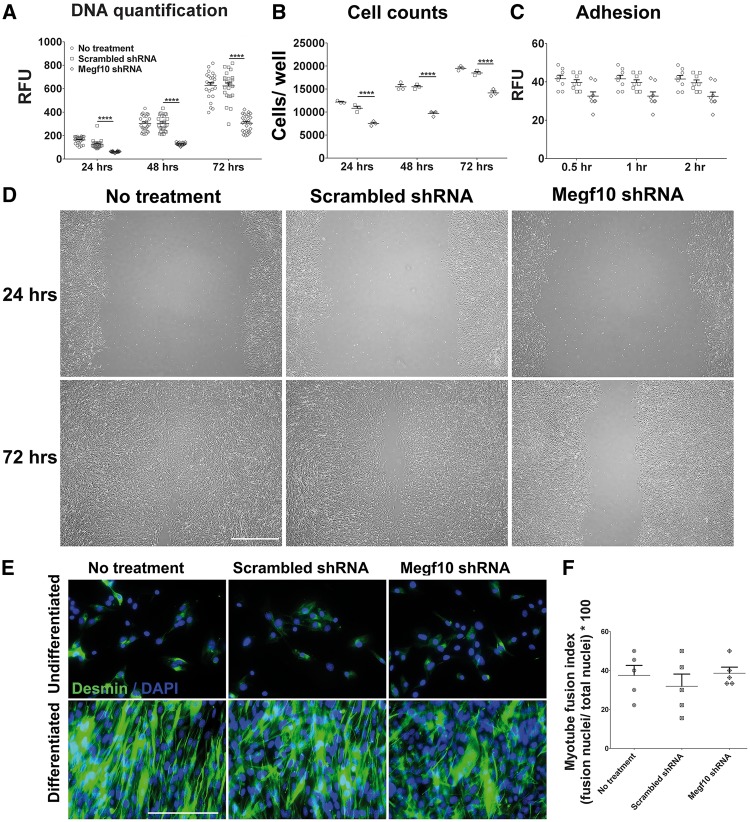
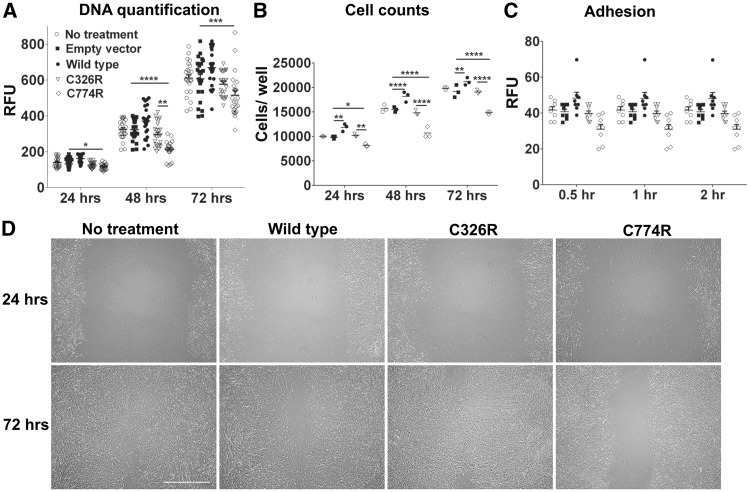
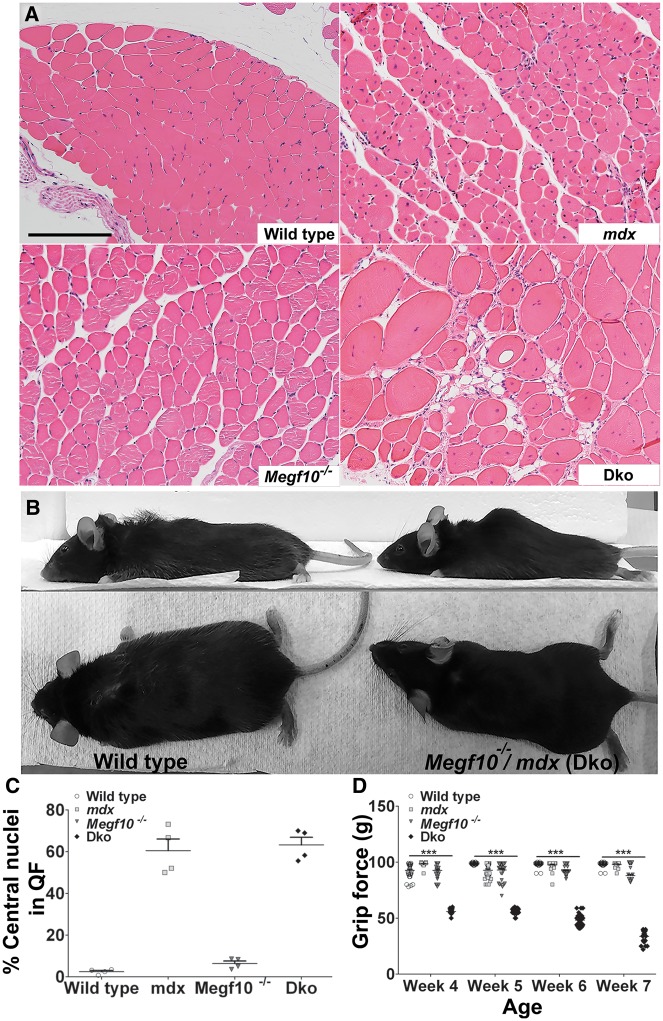
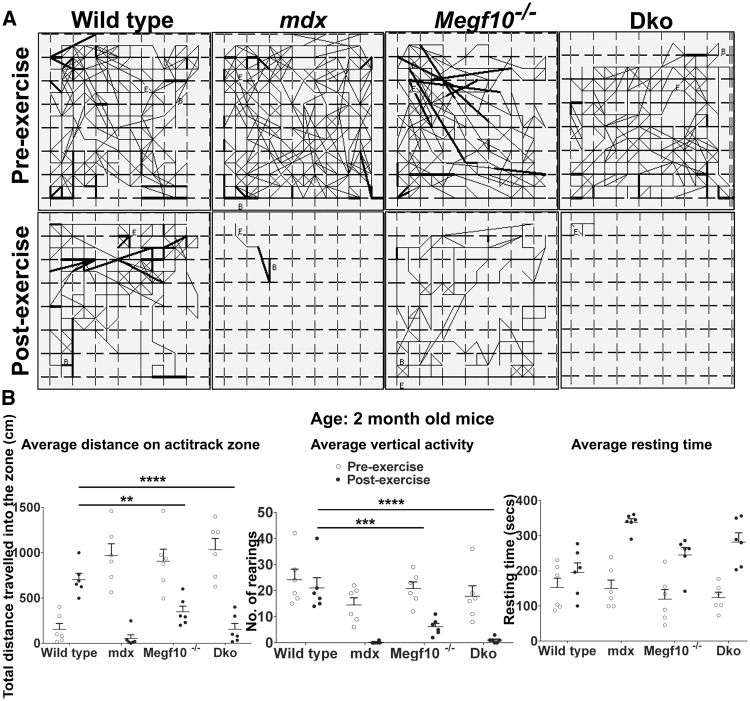
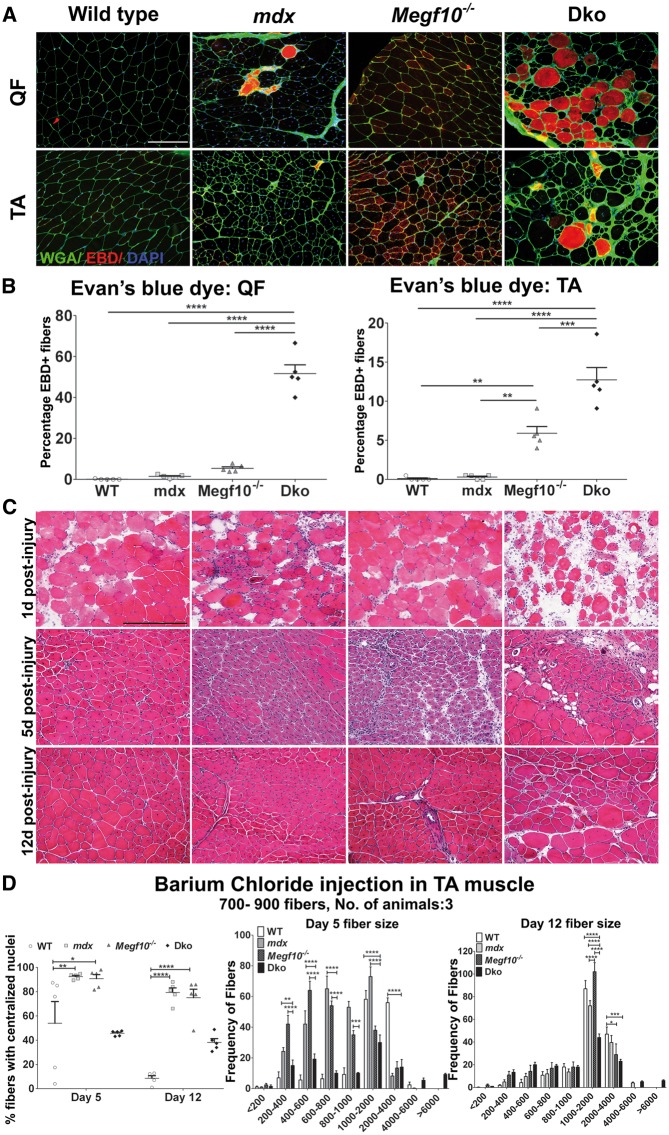
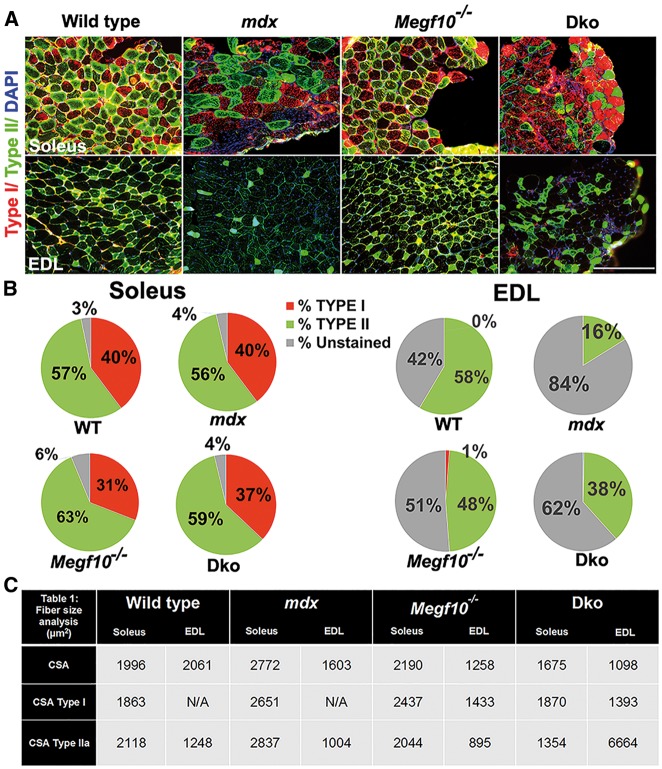
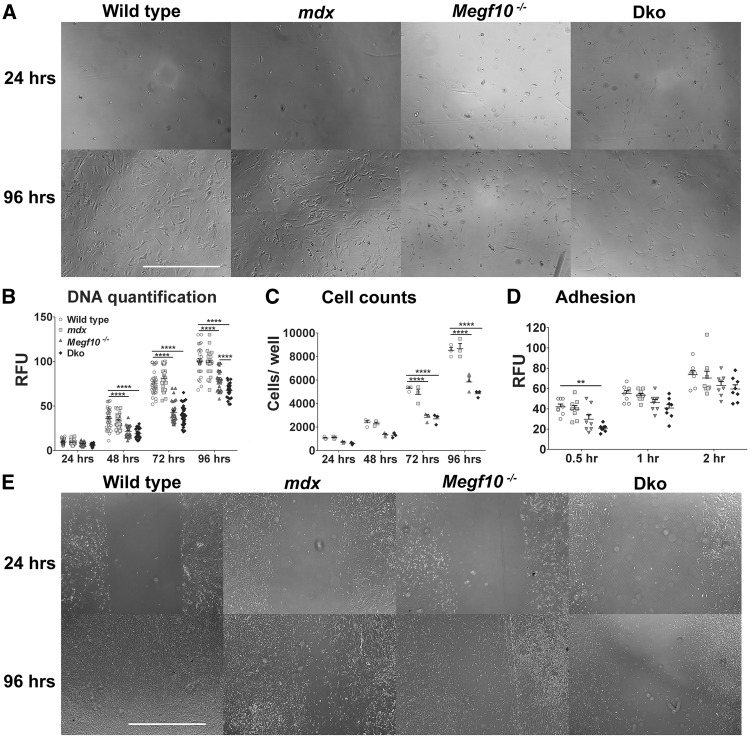
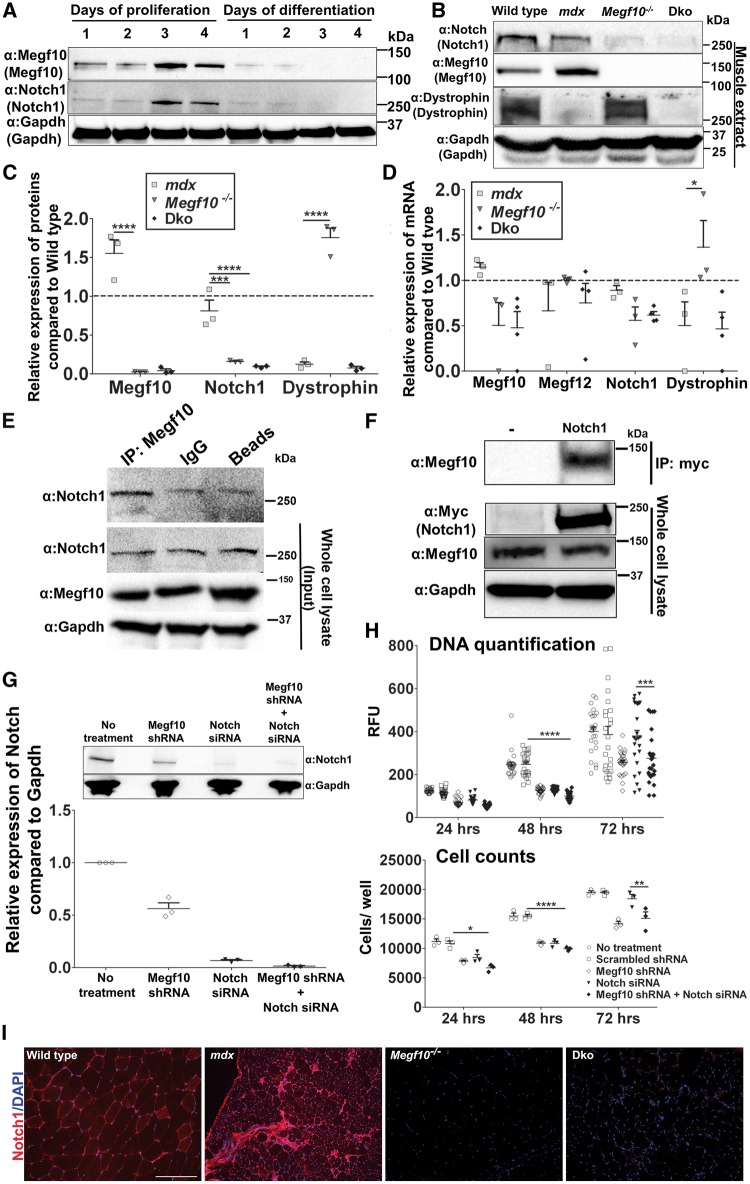
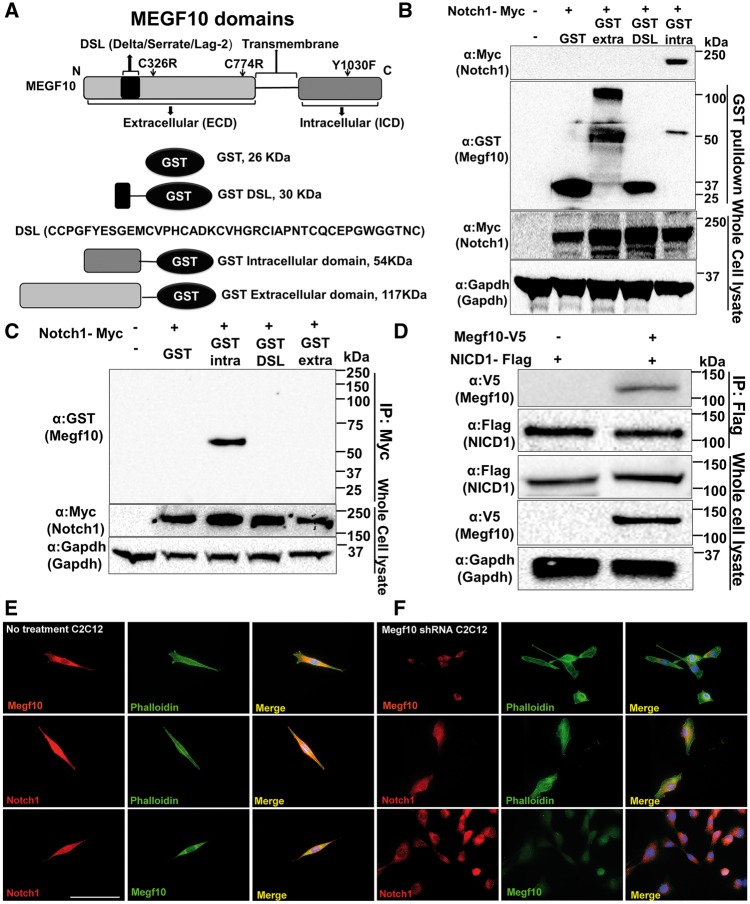
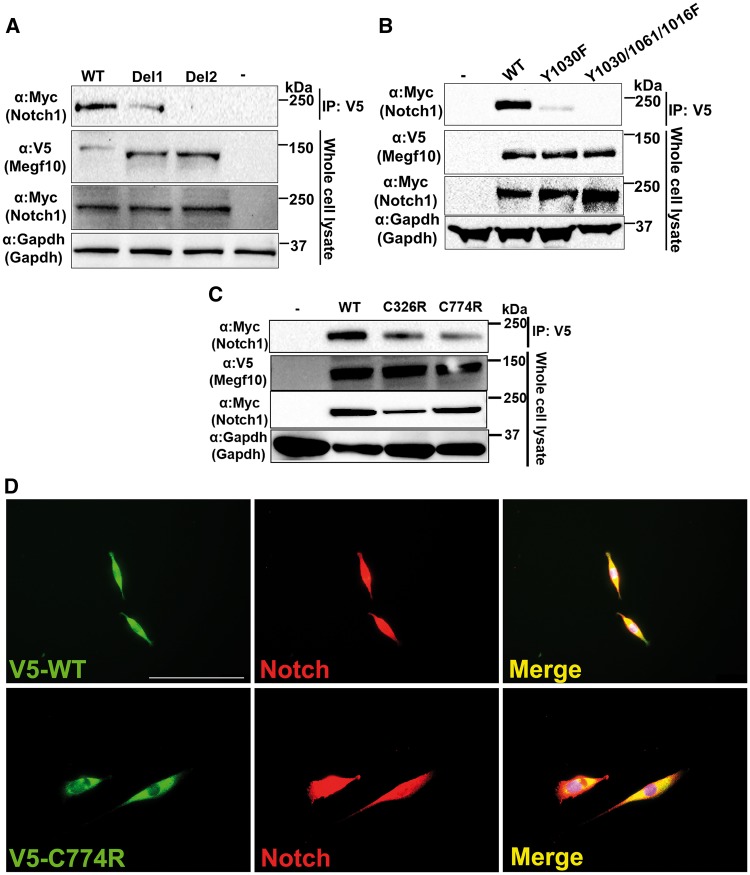
Mutations in MEGF10 cause early onset myopathy, areflexia, respiratory distress, and dysphagia (EMARDD), a rare congenital muscle disease, but the pathogenic mechanisms remain largely unknown. We demonstrate that short hairpin RNA (shRNA)-mediated knockdown of Megf10, as well as overexpression of the pathogenic human p.C774R mutation, leads to impaired proliferation and migration of C2C12 cells. Myoblasts from Megf10-/- mice and Megf10-/-/mdx double knockout (dko) mice also show impaired proliferation and migration compared to myoblasts from wild type and mdx mice, whereas the dko mice show histological abnormalities that are not observed in either single mutant mouse. Cell proliferation and migration are known to be regulated by the Notch receptor, which plays an essential role in myogenesis. Reciprocal co-immunoprecipitation studies show that Megf10 and Notch1 interact via their respective intracellular domains. These interactions are impaired by the pathogenic p.C774R mutation. Megf10 regulation of myoblast function appears to be mediated at least in part via interactions with key components of the Notch signaling pathway, and defects in these interactions may contribute to the pathogenesis of EMARDD.


Figures

Figure 1
Figure 1
Megf10 shRNA treated C2C12 cells show impairments in proliferation and migration. DNA quantification was performed using a CyQUANT kit (A), with scatter plots representing the mean absorbance ± S.E.M. from 24 wells in a 96-well plate; the ANOVA p value is <0.0001. Live cells were counted directly (B); the scatter plots represent the number of cells in each well ± S.E.M. from three independent experiments; the ANOVA p value is < 0.0001. Adhesion was assessed after the addition of calcein. The scrambled shRNA and Megf10 shRNA data for all time points were statistically significant after doing an unpaired student t test (C); scatter plots represent the mean fluorescence intensities of adherent cells ± S.E.M. from two independent experiments, n = 8; the ANOVA p value does not reach statistical significance. Photographs were taken at 24 and 72 h of culture after scratch with a 200 µl pipette tip (D). Ten days after switching to myogenic differentiation medium, a typical microscope field of untreated and shRNA treated C2C12 cells shows the presence of similar multinucleated myotubes for each group, defined by the presence of at least three nuclei within a cell, with positive desmin staining (E). The scatter plots summarize myoblast fusion index calculations from three independent experiments, each of which included the assessment of five distinct microscope fields (F); the ANOVA p value does not reach statistical significance. Post-test comparison results are indicated as follows: **P < 0.01; ***P < 0.001; ****P < 0.0001; RFU, relative fluorescence units; ns, not significant; scale bar, 5 mm.
Figure 2
Figure 2
Overexpression of mutant p.C774R MEGF10 suppresses C2C12 myoblast proliferation and migration compared to p.C326R mutant and control. DNA quantification was performed using a CyQUANT kit (A), with scatter plots representing the mean absorbance ± S.E.M. from 24 wells in a 96-well plate; the ANOVA p value is < 0.0001. Live cells were counted directly; the mean numbers of cells ± S.E.M. from three independent experiments are shown; the ANOVA p value is < 0.0001 (B). Adhesion was assessed after the addition of calcein; each scatter plot represents the mean fluorescence of 8 wells from a 96 well plate ± S.E.M. from two independent experiments; the ANOVA p value is 0.03 (C). Scratch zones were photographed at 24 and 72 h of culture after scratch with a 200 µl pipette tip (D). Post-test comparison results are indicated as follows: *P < 0.05; **P < 0.01; ***P < 0.001; RFU, relative fluorescence units; ns, not significant; scale bar, 5 mm.
Figure 3
Figure 3
Megf10 −/−/mdx double knockout (dko) mice have a myopathic phenotype. Transverse sections of quadriceps femoris from two month old mice representing each genotype were stained with hematoxylin and eosin (A); scale bar, 50 µm. Photographs of representative wild type (left) and dko mice (right) at 2 months of age (B); note the dko mouse’s kyphosis and slack posture. The proportions of centralized nuclei in mdx and dko mouse muscles are similar (C). Maximal forelimb grip strength was measured from wild type, Megf10−/−, mdx, and dko mice; the ANOVA P value is < 0.0001 (D).
Figure 4
Figure 4
Megf10 −/−, mdx, and Megf10−/−/mdx double knockout (dko) mice have decreased motor function. Representative ActiTrack activity plots of the 4 mouse genotype cohorts show activity levels before and after treadmill exercise (n = 5 for each cohort but the graph for one mouse is shown for each genotype). Thin lines represent distance traveled, while darker lines represent instances of vertical activity (rearing) and revisited routes (A). Graphs indicate average distances traveled (the ANOVA P value is 0.0003), average vertical activity (the ANOVA P value is < 0.0001), and average resting time of mice before and after treadmill exercise (the ANOVA P value is 0.0183) during ActiTrack testing (B). Post-test comparison results are indicated as follows: **P < 0.01; ***P < 0.001, ****P < 0.0001.
Figure 5
Figure 5
Megf10 −/−, mdx, and Megf10−/−/ mdx double knockout (dko) mice display increased sarcolemmal permeability, endomysial fibrosis, and delayed regeneration. TA muscle sections representing the four mouse genotypes show Evans blue dye staining (red fluorescence) and wheat germ agglutinin-conjugated Alexa 488 (green fluorescence) to demarcate the myofiber basal lamina (A). Quantification of Evans blue dye positive fibers (B) in quadriceps femoris (left) and tibialis anterior (right) (n = 3 mice); ANOVA P values are <0.0001 for both graphs. Hematoxylin and eosin staining of TA muscles 1, 5, and 12 days after injection with 1.2% barium chloride (C). Analysis of muscle fibers after barium chloride injection (D) indicates quantification of centralized nuclei at day 5 and day 12 after injection in tibialis anterior muscles of three different mice for each genotype (left), along with the distributions of different fiber sizes in tibialis anterior at day 5 (middle) and day 12 (right). A range of 700–900 fibers were measured for each genotype in µm2. The ANOVA P values for days 5 and 12 are each <0.0001. Scale bars, 20 μm. Post-test comparison results are indicated as follows: *P < 0.05; **P < 0.01; ***P < 0.001, ****P < 0.0001.
Figure 6
Figure 6
Megf10 −/− / mdx double knockout (dko) mouse muscles display skewed fiber type proportions. Representative images of myosin heavy chain type I (red), type IIa (green), and nuclei (blue) staining of serial sections in soleus and EDL of wild type, mdx, Megf10−/−, and dko mice (n = 3 mice for each genotype) (A). The pie chart depicts the fiber type analysis of mouse muscles (B). The table shows cross-sectional fiber sizes of soleus and EDL from the four mouse strains (µm2) (C).
Figure 7
Figure 7
Primary myoblasts isolated from Megf10−/− and dko mice have impaired proliferation and migration compared to those from mdx and wild type mice. Photographs of wild type, mdx, Megf10−/−, and dko primary myoblasts were taken 24 and 96 h after plating (A); scale bar, 2 mm. DNA quantification was performed using a CyQUANT kit, with scatter plots representing the mean absorbance ± S.E.M from n = 24 (B); the ANOVA P value is < 0.0001. Live cells were counted directly, with scatterplots representing the mean number of cells per well ± S.E.M from three independent experiments (C); the ANOVA P value is < 0.0001. Adhesion was assessed after the addition of calcein, with scatter plots representing the mean fluorescence ± S.E.M., n = 8 (D); the ANOVA P value was not statistically significant. Scratch zones were photographed at 24 and 96 h of culture after scratch with a 200 µl pipette tip (E). Post-test comparison results are indicated as follows: **P < 0.01; ****P < 0.0001; RFU, relative fluorescence units; ns, not significant; scale bar, 5mm.
Figure 8
Figure 8
Megf10 interacts with Notch1. Megf10 and Notch1 expression levels were quantified in whole cell lysates of C2C12 cells via Western blot at the specified days of proliferation and differentiation after seeding (A). Western blot shows expression of Notch1, Megf10 and Dystrophin in quadriceps femoris muscle extracted from wild type, mdx, Megf10−/− and dko mice (B). The Western blot results were quantified via densitometric analysis, n = 3 (C); scatter plots represent the mean expression ± S.E.M from three independent experiments, with the ANOVA P value < 0.0001. RT-PCR expression analysis was performed on mRNA extracted from quadriceps femoris muscle representing wild type, mdx, Megf10−/− and dko mice. Data represent the mean ± S.E.M from at least three independent experiments, each done in triplicate (D). Expression (2-ΔΔCT) levels are shown relative to an 18S endogenous control; the ANOVA P value is 0.01. Whole cell lysates from C2C12 cells cultured for 72 h were subjected to immunoprecipitation with a Megf10 antibody. The immune complexes and whole cell lysates were then subjected to immunoblotting using a Notch1 antibody, with an IgG precipitation and beads serving as negative controls (E). The trace recovery of Notch1 with IgG precipitation is in line with control findings for other proteins in similarly structured experiments (57,58). Whole cell extracts of C2C12 cells were transfected with Myc-tagged Notch1 (the non-transfection control is indicated by the “-”). The immune complexes and whole cell lysates were subjected to immunoblotting with Megf10 and anti-Myc antibody (F). Simultaneous knockdown of Megf10 and Notch1 was performed in C2C12 myoblasts that was quantified on scatterplot (G) with an ANOVA P value < 0.0001, confirmed on Western blot (top) that was quantified via densitometry analysis from three independent experiments (bottom). C2C12 myoblast proliferation was quantified at 24, 48, and 72 h after simultaneous knockdown of Notch1 and Megf10 (H). DNA quantification was performed using a CyQUANT kit, with scatter plots representing the mean absorbance ± S.E.M from n = 24 (top); the ANOVA P value is < 0.0001. Live cells were also counted directly, with scatter plots representing the mean number of cells per well ± S.E.M from three independent experiments (bottom); the ANOVA P value is < 0.0001. Post-test comparison results are indicated as follows: *P < 0.05; **P < 0.01; ***P < 0.001; RFU, relative fluorescence units; ns, not significant. Gapdh served as the loading control throughout. Representative images of Notch1 (blue) and nuclei (blue) staining of serial sections obtained from quadriceps femoris of wild type, mdx, Megf10−/−, and dko mice (I). Muscle samples from 3 mice were examined for each strain.
Figure 9
Figure 9
The ICD of MEGF10 interacts with Notch1. Diagram of GST-tagged domains of MEGF10 (A) show relevant missense mutations of MEGF10, including C326R, C774R, and Y1030F (the first two have been described in human disease, and the third is a mutation generated in vitro to represent defective tyrosine phosphorylation and has not been described in human disease to date). Glutathione-S-Transferase (GST) pulldown was performed using the extracellular, delta/serrate/LAG-2 (DSL) and intracellular domains of MEGF10 after successful co-transfection of GST-tagged Megf10 domains and Myc-Notch1 into C2C12 myoblasts (B). Reciprocal experiments were performed by immunoprecipitating myc-Notch1 and then immunoblotting with GST antibody (C). V5-tagged wild type MEGF10 and Flag-NICD1 were each co-transfected into C2C12 cells, followed by co-immunoprecipitation of cell lysates with anti-flag antibody, and then immunoblotting with anti V5-antibody, along with appropriate control antibodies (D). Gapdh was used as a loading control for all Western blots. Immunofluorescence of untreated wild type C2C12 cells with antibodies to Megf10, Notch1 and Phalloidin shows that Megf10 and Notch1 mainly co-localize at the cell membrane (E). Notch1 expression is low for Megf10 shRNA treated C2C12 cells (F) visualized at 40X magnification; scale bar, 20μm.
Figure 10
Figure 10
MEGF10 mutations impair interactions with Notch1. V5-tagged human MEGF10 containing two different intracellular deletion mutations (Del1, deletion from Y879 to Y1002 and Del2, deletion from Y1016 to Y1099) were each co-transfected with myc-tagged Notch1 into C2C12 cells (A). V5-tagged MEGF10 containing intracellular point mutations were each co-transfected with myc-tagged Notch1 into C2C12 cells (B). V5-tagged MEGF10 containing extracellular domain disease-causing p.C774R and p.C326R point mutations were each co-transfected with myc-tagged Notch1 into C2C12 cells (C). For each experiment, co-immunoprecipitation was performed on cell lysates with anti-V5 antibody, then the immune complexes were immunoblotted with anti-myc antibody. Gapdh was used as a loading control throughout. Immunofluorescence of V5-tagged WT and p.C774R MEGF10 transfected C2C12 cells with antibodies to V5 and Notch1 show co-localization of Megf10 and Notch1 at the cell membrane, along with localization of Notch1 only at the nucleus (D), as seen in wild type C2C12 cells (Fig. 9E); scale bar, 20 μm.

Similar articles

Cited by

References

    1. Chung W.-S., Clarke L.E., Wang G.X., Stafford B.K., Sher A., Chakraborty C., Joung J., Foo L.C., Thompson A., Chen C.. et al. (2013) Astrocytes mediate synapse elimination through MEGF10 and MERTK pathways. Nature, 504, 394–400. - PMC - PubMed
    1. Holterman C.E., Le Grand F., Kuang S., Seale P., Rudnicki M.A. (2007) Megf10 regulates the progression of the satellite cell myogenic program. J. Cell Biol., 179, 911–922. - PMC - PubMed
    1. Kay J.N., Chu M.W., Sanes J.R. (2012) MEGF10 and MEGF11 mediate homotypic interactions required for mosaic spacing of retinal neurons. Nature, 483, 465–469. - PMC - PubMed
    1. Suzuki E., Nakayama M. (2007) The mammalian Ced-1 ortholog MEGF10/KIAA1780 displays a novel adhesion pattern. Exp. Cell Res., 313, 2451–2464. - PubMed
    1. Ziegenfuss J.S., Biswas R., Avery M.A., Hong K., Sheehan A.E., Yeung Y.-G., Stanley E.R., Freeman M.R. (2008) Draper-dependent glial phagocytic activity is mediated by Src and Syk family kinase signalling. Nature, 453, 935–939. - PMC - PubMed

Publication types