. 2018 Jan;16(1):86-99.
doi: 10.1111/pbi.12751. Epub 2017 Jun 23.

Enhancing auxin accumulation in maize root tips improves root growth and dwarfs plant height

Affiliations

Enhancing auxin accumulation in maize root tips improves root growth and dwarfs plant height

Zhaoxia Li et al. Plant Biotechnol J. 2018 Jan.

Abstract

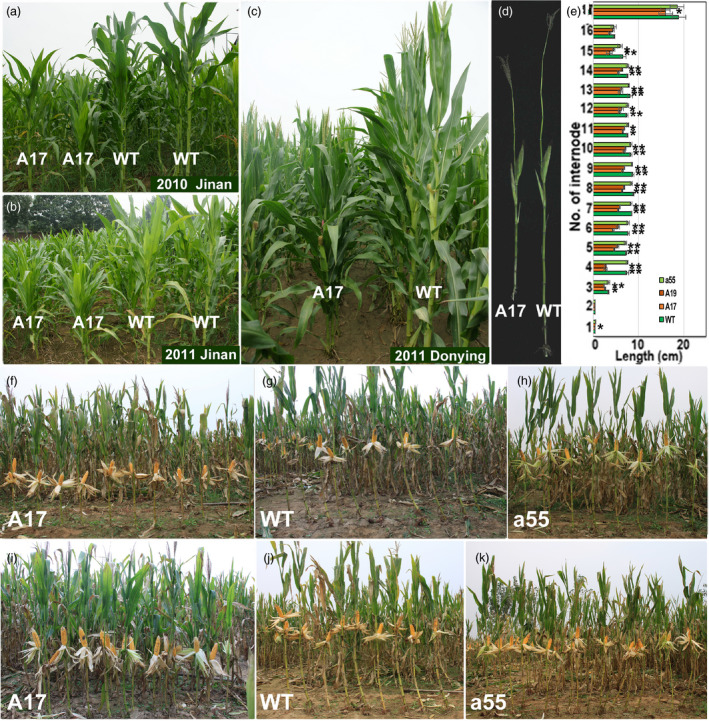
Maize is a globally important food, feed crop and raw material for the food and energy industry. Plant architecture optimization plays important roles in maize yield improvement. PIN-FORMED (PIN) proteins are important for regulating auxin spatiotemporal asymmetric distribution in multiple plant developmental processes. In this study, ZmPIN1a overexpression in maize increased the number of lateral roots and inhibited their elongation, forming a developed root system with longer seminal roots and denser lateral roots. ZmPIN1a overexpression reduced plant height, internode length and ear height. This modification of the maize phenotype increased the yield under high-density cultivation conditions, and the developed root system improved plant resistance to drought, lodging and a low-phosphate environment. IAA concentration, transport capacity determination and application of external IAA indicated that ZmPIN1a overexpression led to increased IAA transport from shoot to root. The increase in auxin in the root enabled the plant to allocate more carbohydrates to the roots, enhanced the growth of the root and improved plant resistance to environmental stress. These findings demonstrate that maize plant architecture can be improved by root breeding to create an ideal phenotype for further yield increases.

Keywords: ideal plant type; maize; root architecture modification; transgenic breeding; yield.


Figures

Figure 1
Figure 1
Expression of ZmPIN s and selection of transgenic lines with real‐time RTPCR and biomass measurements. (a), (b) Expression pattern analysis of PINs in maize. The root and shoot were cut off from seedlings germinated for eight days, and the leaf, LRZ (1.0–1.5 cm segment containing the lateral root primordia) and root tip were from three‐leaf stage plants. Fold changes in RNA transcripts were calculated using the 2−ΔΔCt method with maize Actin1 as an internal control: the ∆ values of the target gene and reference gene (maize Actin1) were calculated in the samples, and the values of 1/10 maize Actin1 in the roots were used as the standard to calculate the relative expression levels of the PIN genes. (c) Expression analysis of ZmPIN1a, ZmPIN1b and ZmPIN1c subjected to low‐phosphate starvation (LP). Fold changes in RNA transcripts were calculated using the 2−ΔΔCt method with maize Actin1 as an internal control, and the values of gene expression levels cultured in normal nutrient solution (SP) were taken as onefold. (d) and (e) Screening ZmPIN1a and ZmPIN1b transgenic lines for real‐time RTPCR. (f) and (g) Biomass determination of ZmPIN1a and ZmPIN1b transgenic lines cultured in vermiculite at the five‐leaf stage. The prefix ‘A’ or ‘B’ in a name denotes the ZmPIN1a or ZmPIN1b sense line, and an ‘a’ or ‘b’ in a name denotes the ZmPIN1a or ZmPIN1b antisense line. WT denotes the wild‐type control DH4866. The roots and shoots of eight‐day germinated seedlings were used. The expression levels of genes were analysed using real‐time RTPCR, and fold changes in RNA transcripts were calculated using the 2−ΔΔCt method with maize Actin1 as an internal control. The values of the target gene from the roots of the WT line were taken as onefold. The expression levels are expressed as the mean of the relative fold changes from triplicate biological replicates, and the vertical bars represent the standard deviation (n = 3). For biomass analysis, the plants in vermiculite were harvested at the five‐leaf stage. DW denotes dry weight. The values are means ± SD (n = 10). The asterisks indicate significant differences between transgenic and WT lines at the *0.05 or **0.01 level using the t‐test.
Figure 2
Figure 2
T‐DNA region and molecular identification of transgenic plants. (a) and (b) T‐DNA region of the plasmid pCAMBIA1300‐Ppht1::ZmPIN1a (±)‐P35S:: EPSP and pCAMBIA1300‐Ppht1::ZmPIN1b(±)‐P35S:: EPSP . The sense or antisense coding sequence of the ZmPIN1a or ZmPIN1b gene was inserted into the XbalI site of the mini‐Ti plasmid. Ppht1, barley Pht1 promoter (Schunmann et al., 2004); Tnos, a nos terminator; P35S and T35S, CaMV35S promoter and CaMV35S terminator; and EPSP, 5‐enolpyruvylshikimate‐3‐phosphate (EPSP) synthase; ZmPIN1a (+) or (−), ZmPIN1b (+) or (−) full cDNA in sense or antisense orientation. (c) PCR assay of T3 transgenic maize plants. Lane M, DNA marker DL2000; (+) was the PCR result of plasmid pCAMBIA1300‐Ppht1::ZmPIN1a (±)‐P35S:: EPSP and pCAMBIA1300‐Ppht1::ZmPIN1b (±)‐P35S:: EPSP ; (−) was the PCR result of H2O; the lines used are those described in Figure 1. (d) and (e) Southern blotting analysis using a probe for EPSP (d) or ZmPIN1a (e) indicated that exogenous ZmPIN1a integrated in the maize genome. In all cases, genomic DNA (40 μg) of transgenic and WT plants was extracted and digested with BglII or Eco RV, which had one cut site in the T‐DNA region for Southern blotting hybridization. M presents the λDNA/EcoT14 molecular weight marker, (+) presents the positive control using mixture of plasmid DNA and the digested plasmid DNA (Hind III+Sac II, can release a 6.8‐kb fragment including T‐DNA and part of the plasmid, and the lines used are described in Figure 1. The blue asterisk indicates the exogenous band. (f) Dot blot hybridization with AtPIN1 antibody. (g) Western blot of plasma membrane protein hybridization with AtPIN1 antibody. The plasma membrane (PM), mitochondria (Mt, the precipitate after the 21 000  g centrifugation) and soluble protein of maize root segment (1 cm form root tip of the seminal roots) were segregated by centrifugation according to the method of Abas and Luschnig (Abas and Luschnig, 2010). (h) ZmPIN1a transient expression assays using onion epidermal cells to show subcellular localization on the plasma membrane.
Figure 3
Figure 3
Phenotype of ZmPIN1a and ZmPIN1b transgenic lines. (a) and (b), (c) ZmPIN1a transgenic and WT lines cultured in nutrient solution for 3 and 12 days. (d) and (e) Plants, tassels and ears of ZmPIN1a transgenic and WT lines grown in large pots. (f) and (g) ZmPIN1b transgenic and WT lines cultured in nutrient solution for 12 days. The lines used are described in Figure 1.
Figure 4
Figure 4
Yield performances of ZmPIN1a transgenic and WT lines under different density conditions. (a)‐(c) ZmPIN1a transgenic and WT lines were planted in different years and sites to demonstrate hereditary stability. (d) Stems of lines A17 (sense line) and WT. (e) Internode length of ZmPIN1a transgenic lines and WT plants. Values are the means ± SD. The asterisks indicate significant differences between the transgenic and WT lines at the *0.05 or **0.01 level using the t‐test (n = 5). (f)‐(h) Lines under moderate‐density culture. (i)‐(k) Lines under high‐density culture. The lines used are described in Figure 1.
Figure 5
Figure 5
Improved tolerances for drought and low‐phosphate levels in ZmPIN1a transgenic lines. (a)–(c) ZmPIN1a transgenic lines and WT plants grown in soil pots for 2 days (a) or 5 days (b) without water and rewatered for 2 days (c). (d) and (e) Ears and yield of ZmPIN1a transgenic and WT lines suffering from drought stress in the field. Values are the means ± SD. The asterisks indicate significant differences between the transgenic and WT lines at the **0.01 level using the t‐test (= 8). (f) and (g) ZmPIN1a transgenic and WT lines grown in LP solution. (h) Biomass analysis of ZmPIN1a transgenic and WT lines plants grown in SP and LP solutions. Values are means ± SD. An ‘a’ indicates a significant difference between transgenic and WT lines in the same nutrient solution, and ‘b’ indicates a significant difference in genotype under SP versus LP conditions at the 0.05 level using the t‐test (= 10). The lines used are those described in Figure 1.
Figure 6
Figure 6
Variations in IAA concentrations and transport capacity in ZmPIN1a transgenic plants. (a) Morphological changes of WT plants after treatment with IAA, NAA, NPA and control treatment as presented in Figure S3 for 3 days. (b) The morphological changes of transgenic lines, transgene pyramid lines and WT plants after IAA, NAA, NPA and control treatment as presented in Figure S3 for 3 days. (c) Auxin concentration of the leaf, coleoptilar node, LRZ (the 1.0–1.5 cm segment with lateral root outgrowth) and root tips of ZmPIN1a transgenic and WT lines cultured in nutrient solution for eight days. The boxes showed the regions for auxin determination. (d) Relative auxin concentration in different parts of maize seedlings. The value of WT leaves was set as 1, and all data were compared to WT leaves. The values are means ± SD. The asterisks indicate significant differences between transgenic and WT lines at the *0.05 or **0.01 level using the t‐test (n = 5). (e) IAA transport capacity determination of ZmPIN1a transgenic and WT lines by distribution changes of 3H‐IAA. Relative IAA concentrations of coleoptilar nodes, root base, LRZ and root tips from ZmPIN1a transgenic, transgene pyramid lines and WT lines were calculated. Values are the average of three independent biological repeats as raw data and presented in Table S7.
Figure 7
Figure 7
ZmPIN1a regulated auxin, ethylene biosynthesis and signalling and model summarizing effect of ZmPIN1a on root morphology in maize. (a) Genes involved in auxin signalling differentially expressed between the ZmPIN1a overexpression A17 and WT lines. (b) Genes involved in ethylene biosynthesis and signalling differentially expressed between the ZmPIN1a overexpression A17 and WT lines. The numerical values are the log2 ratios (A17/WT) of the DGEs, and the background colour showed the gene relative expression levels compared with the WT line (red represents up‐regulated, green is down‐regulated, and yellow is no significant change). Bold type means the difference meets the criterion for the log2 ratio (A17/WT) <‐1 or ratio >1 and P < 0.001. (c) Model summarizing the main results regarding ZmPIN1a overexpression on root morphology changes in maize.

Similar articles

Cited by

References

    1. Abas, L. and Luschnig, C. (2010) Maximum yields of microsomal‐type membranes from small amounts of plant material without requiring ultracentrifugation. Anal. Biochem. 401, 217–227. - PMC - PubMed
    1. Alarcon, M.V. , Lloret, P.G. and Salguero, J. (2014) Synergistic action of auxin and ethylene on root elongation inhibition is caused by a reduction of epidermal cell length. Plant Signal. Behavior, 9, e28361. - PMC - PubMed
    1. Araus, J.L. , Slafer, G.A. , Royo, C. and Serret, M.D. (2008) Breeding for yield potential and stress adaptation in cereals. Crit. Rev. Plant Sci. 27, 377–412.
    1. Benkova, E. , Michniewicz, M. , Sauer, M. , Teichmann, T. , Seifertova, D. , Jurgens, G. and Friml, J. (2003) Local, efflux‐dependent auxin gradients as a common module for plant organ formation. Cell, 115, 591–602. - PubMed
    1. Carraro, N. , Forestan, C. , Canova, S. , Traas, J. and Varotto, S. (2006) ZmPIN1a and ZmPIN1b encode two novel putative candidates for polar auxin transport and plant architecture determination of maize. Plant Physiol. 142, 254–264. - PMC - PubMed

Publication types

MeSH terms

LinkOut - more resources