EpiTEome: Simultaneous detection of transposable element insertion sites and their DNA methylation levels
- PMID: 28499400
- PMCID: PMC5429532
- DOI: 10.1186/s13059-017-1232-0
EpiTEome: Simultaneous detection of transposable element insertion sites and their DNA methylation levels
Abstract
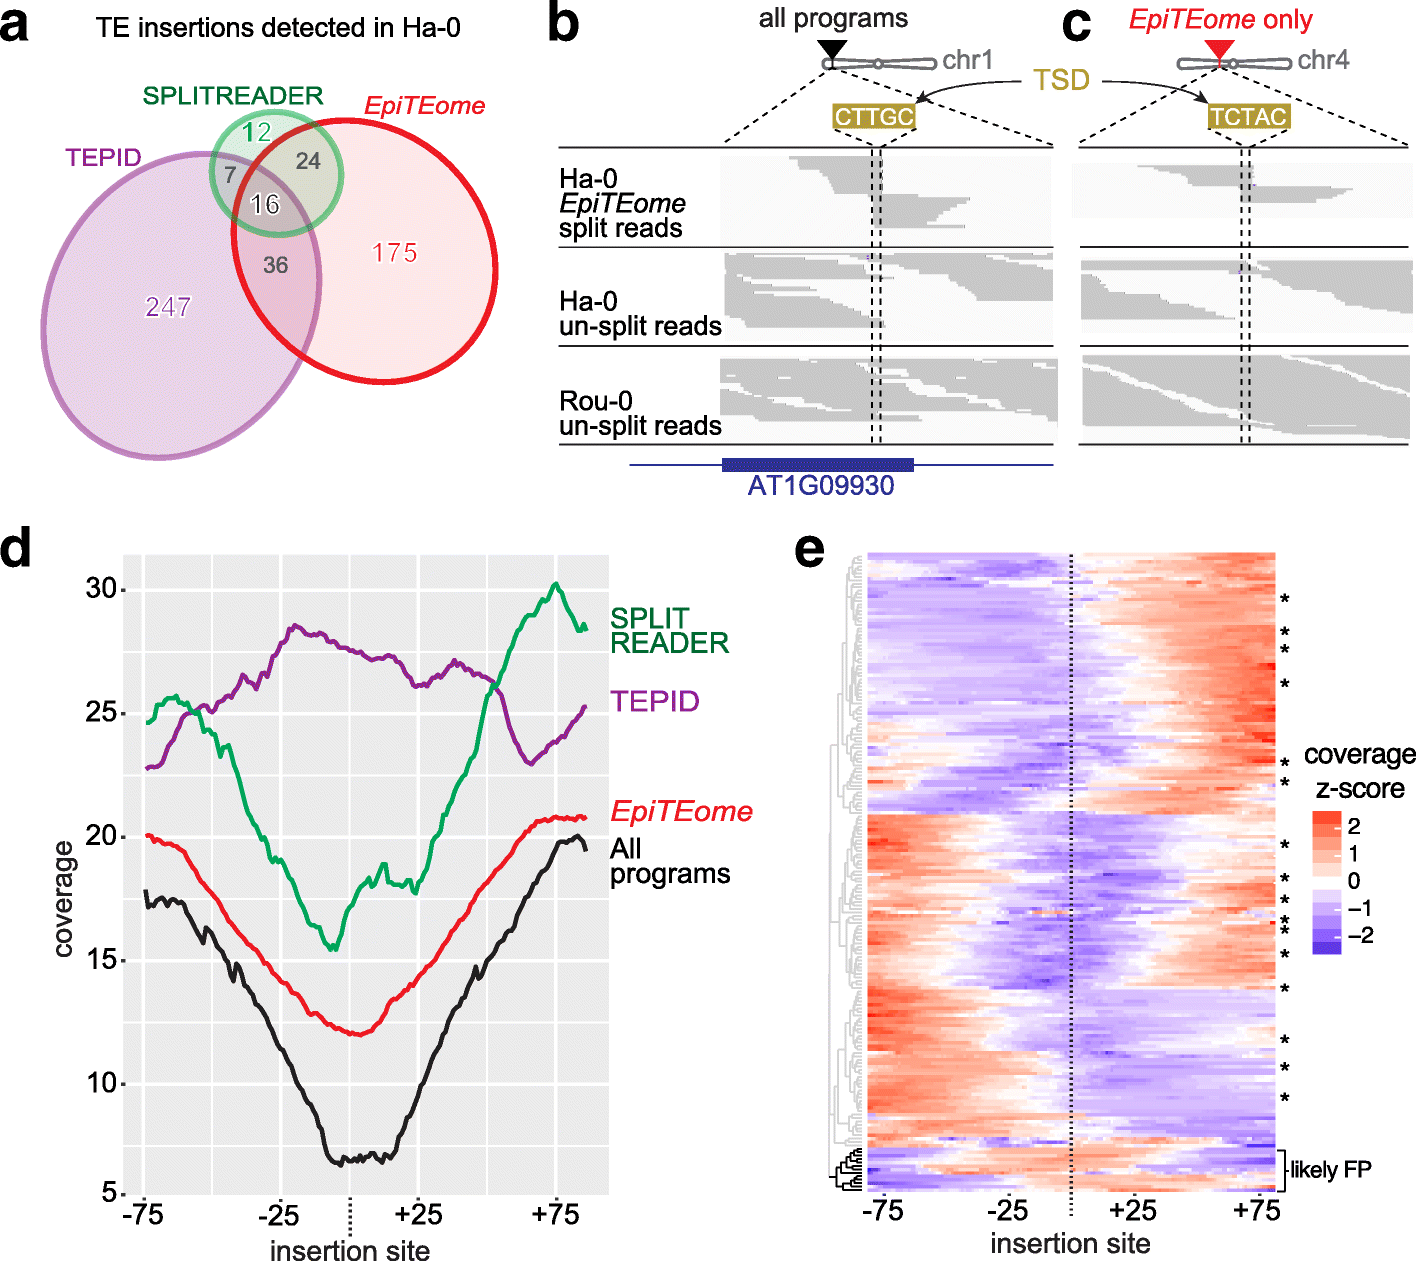
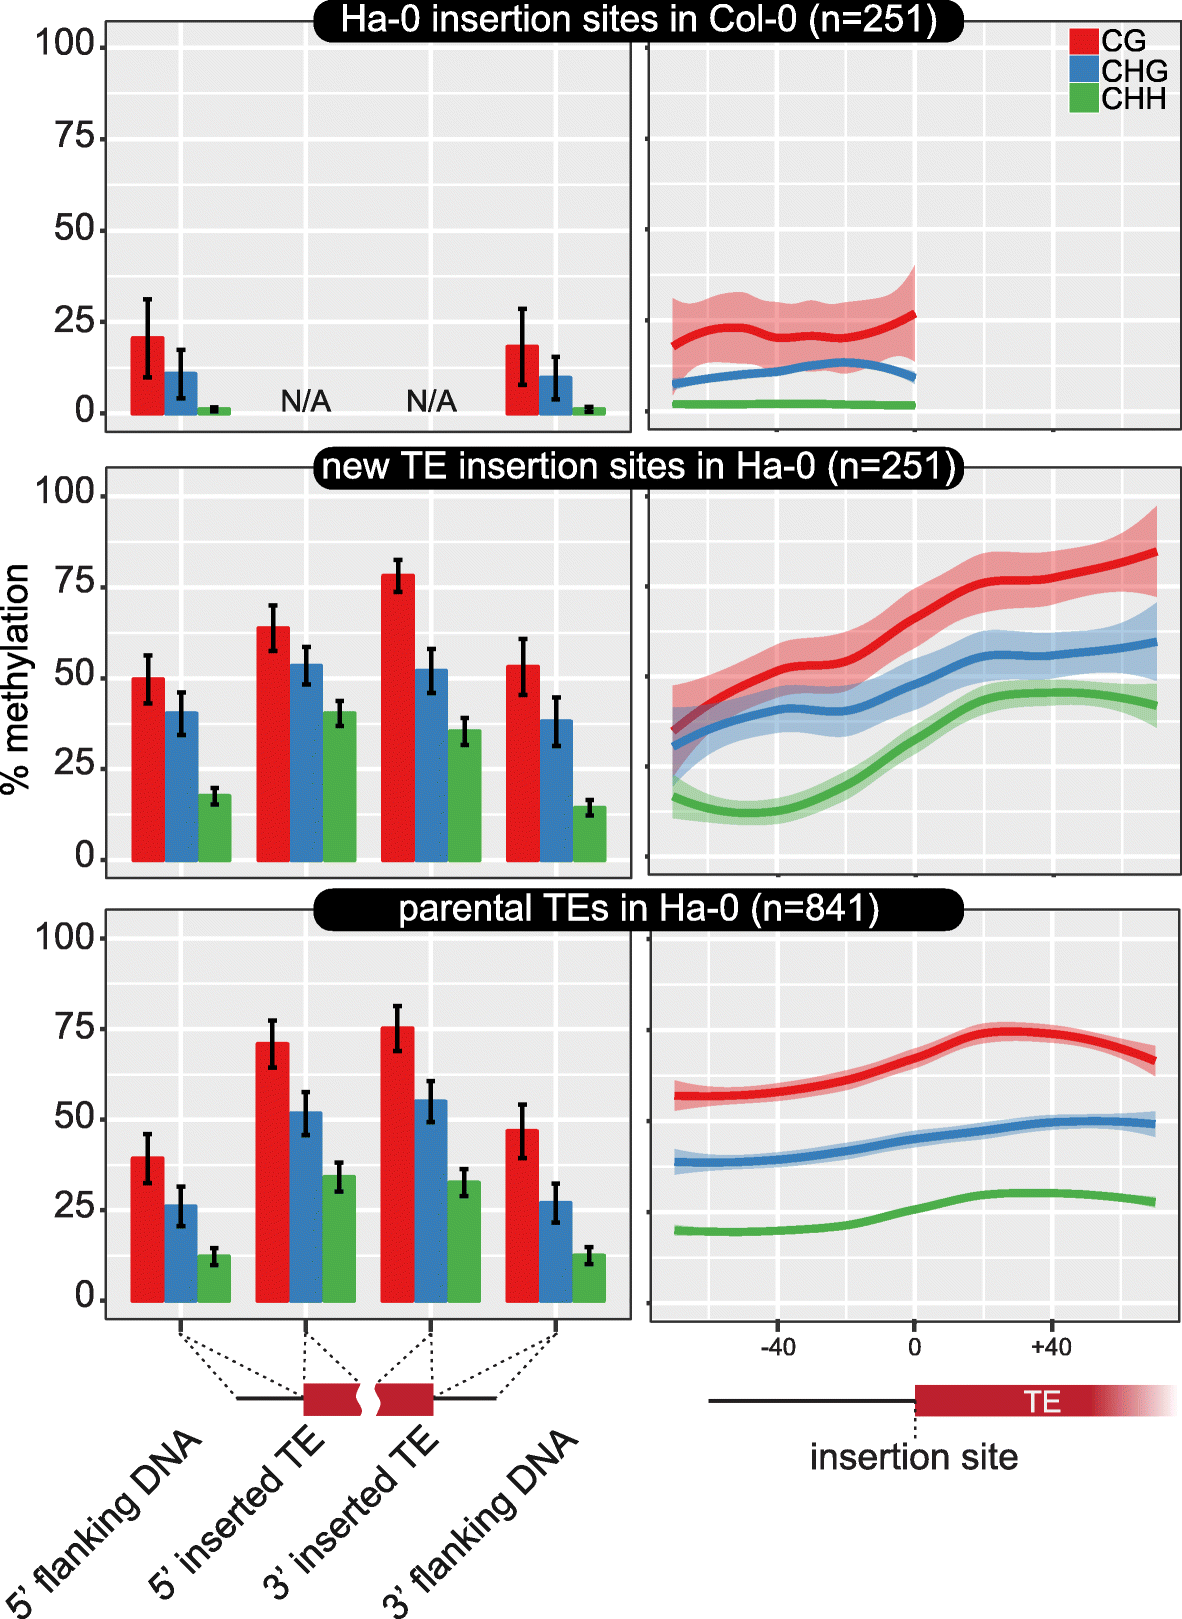
The genome-wide investigation of DNA methylation levels has been limited to reference transposable element positions. The methylation analysis of non-reference and mobile transposable elements has only recently been performed, but required both genome resequencing and MethylC-seq datasets. We have created epiTEome, a program that detects both new transposable element insertion sites and their methylation states from a single MethylC-seq dataset. EpiTEome outperforms other split-read insertion site detection programs, even while functioning on bisulfite-converted reads. EpiTEome characterizes the previously discarded fraction of DNA methylation at sites of new insertions, enabling future investigation into the epigenetic regulation of non-reference and transposed elements.
Keywords: Bioinformatics; Bisulfite; Insertion site; MethylC-seq; Methylome; Split reads; Transposable elements.
Figures


Similar articles
-
Full-length autonomous transposable elements are preferentially targeted by expression-dependent forms of RNA-directed DNA methylation.Genome Biol. 2016 Aug 9;17(1):170. doi: 10.1186/s13059-016-1032-y. Genome Biol. 2016. PMID: 27506905 Free PMC article.
-
Mu transposon insertion sites and meiotic recombination events co-localize with epigenetic marks for open chromatin across the maize genome.PLoS Genet. 2009 Nov;5(11):e1000733. doi: 10.1371/journal.pgen.1000733. Epub 2009 Nov 20. PLoS Genet. 2009. PMID: 19936291 Free PMC article.
-
A novel class of Helitron-related transposable elements in maize contain portions of multiple pseudogenes.Plant Mol Biol. 2005 Jan;57(1):115-27. doi: 10.1007/s11103-004-6636-z. Plant Mol Biol. 2005. PMID: 15821872
-
Epigenetic Control of Gene Expression in Maize.Int Rev Cell Mol Biol. 2017;328:25-48. doi: 10.1016/bs.ircmb.2016.08.002. Epub 2016 Sep 28. Int Rev Cell Mol Biol. 2017. PMID: 28069135 Review.
-
Shedding light on DNA methylation and its clinical implications: the impact of long-read-based nanopore technology.Epigenetics Chromatin. 2024 Dec 30;17(1):39. doi: 10.1186/s13072-024-00558-2. Epigenetics Chromatin. 2024. PMID: 39734197 Free PMC article. Review.
Cited by
-
Genome-Wide Reinforcement of DNA Methylation Occurs during Somatic Embryogenesis in Soybean.Plant Cell. 2019 Oct;31(10):2315-2331. doi: 10.1105/tpc.19.00255. Epub 2019 Aug 22. Plant Cell. 2019. PMID: 31439802 Free PMC article.
-
Expanded methylome and quantitative trait loci detection by long-read profiling of personal DNA.Genome Res. 2025 Apr 14;35(4):644-652. doi: 10.1101/gr.279240.124. Genome Res. 2025. PMID: 40113263
-
A comprehensive atlas of full-length Arabidopsis eccDNA populations identifies their genomic origins and epigenetic regulation.PLoS Biol. 2025 Jul 15;23(7):e3003275. doi: 10.1371/journal.pbio.3003275. eCollection 2025 Jul. PLoS Biol. 2025. PMID: 40663590 Free PMC article.
-
On the Importance to Acknowledge Transposable Elements in Epigenomic Analyses.Genes (Basel). 2019 Mar 31;10(4):258. doi: 10.3390/genes10040258. Genes (Basel). 2019. PMID: 30935103 Free PMC article. Review.
-
Somatic Mobilization: High Somatic Insertion Rate of mariner Transposable Element in Drosophila simulans.Insects. 2022 May 12;13(5):454. doi: 10.3390/insects13050454. Insects. 2022. PMID: 35621789 Free PMC article.
References
Publication types
MeSH terms
Substances
LinkOut - more resources
Full Text Sources
Other Literature Sources

