

Ranking metrics in gene set enrichment analysis: do they matter?
- PMID: 28499413
- PMCID: PMC5427619
- DOI: 10.1186/s12859-017-1674-0
Ranking metrics in gene set enrichment analysis: do they matter?
Abstract
Background: There exist many methods for describing the complex relation between changes of gene expression in molecular pathways or gene ontologies under different experimental conditions. Among them, Gene Set Enrichment Analysis seems to be one of the most commonly used (over 10,000 citations). An important parameter, which could affect the final result, is the choice of a metric for the ranking of genes. Applying a default ranking metric may lead to poor results.
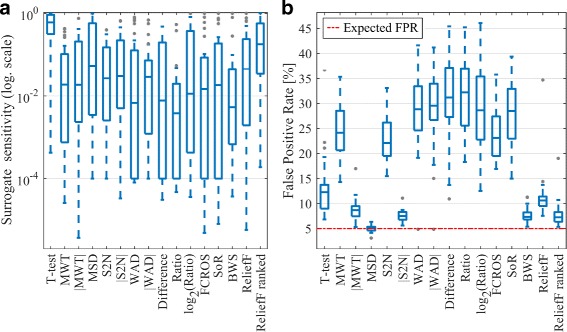
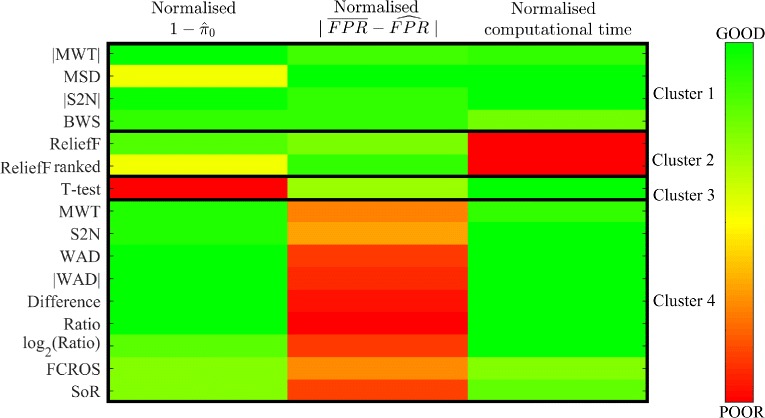
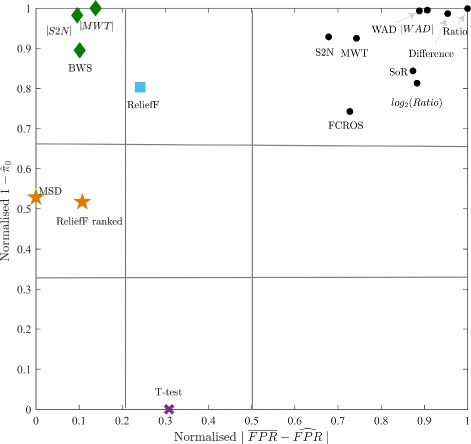
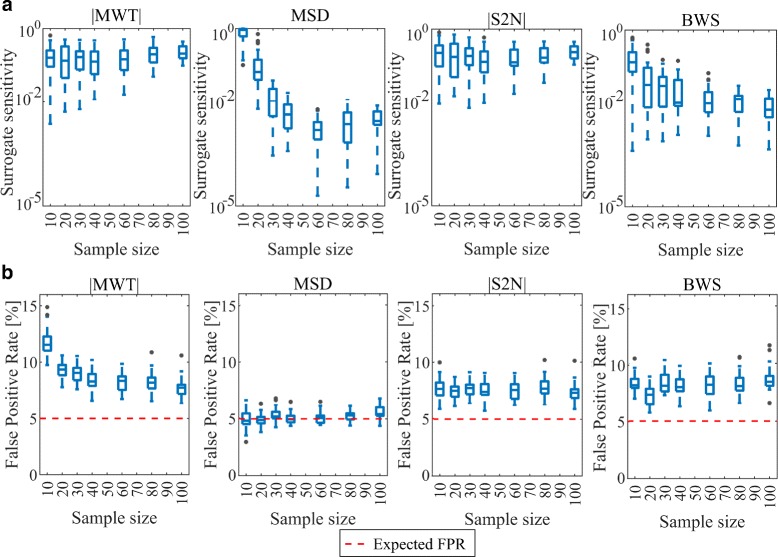
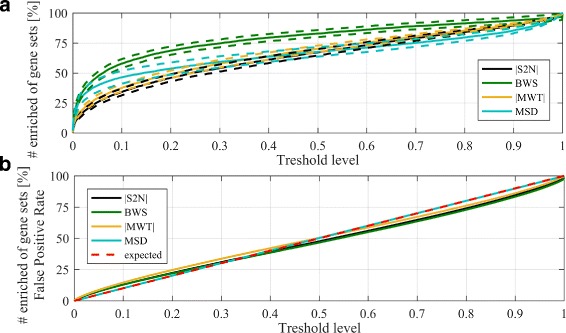
Methods and results: In this work 28 benchmark data sets were used to evaluate the sensitivity and false positive rate of gene set analysis for 16 different ranking metrics including new proposals. Furthermore, the robustness of the chosen methods to sample size was tested. Using k-means clustering algorithm a group of four metrics with the highest performance in terms of overall sensitivity, overall false positive rate and computational load was established i.e. absolute value of Moderated Welch Test statistic, Minimum Significant Difference, absolute value of Signal-To-Noise ratio and Baumgartner-Weiss-Schindler test statistic. In case of false positive rate estimation, all selected ranking metrics were robust with respect to sample size. In case of sensitivity, the absolute value of Moderated Welch Test statistic and absolute value of Signal-To-Noise ratio gave stable results, while Baumgartner-Weiss-Schindler and Minimum Significant Difference showed better results for larger sample size. Finally, the Gene Set Enrichment Analysis method with all tested ranking metrics was parallelised and implemented in MATLAB, and is available at https://github.com/ZAEDPolSl/MrGSEA .
Conclusions: Choosing a ranking metric in Gene Set Enrichment Analysis has critical impact on results of pathway enrichment analysis. The absolute value of Moderated Welch Test has the best overall sensitivity and Minimum Significant Difference has the best overall specificity of gene set analysis. When the number of non-normally distributed genes is high, using Baumgartner-Weiss-Schindler test statistic gives better outcomes. Also, it finds more enriched pathways than other tested metrics, which may induce new biological discoveries.
Keywords: Functional genomics; GSEA; Pathway analysis; Ranking metrics.
Figures
References
-
- Huang DW, Sherman BT, Tan Q, Kir J, Liu D, Bryant D, Guo Y, Stephens R, Baseler MW, Lane HC, et al. DAVID bioinformatics resources: expanded annotation database and novel algorithms to better extract biology from large gene lists. Nucleic Acids Res. 2007;35(suppl 2):169–75. doi: 10.1093/nar/gkm415. - DOI - PMC - PubMed
-
- Mootha VK, Lindgren CM, Eriksson KF, Subramanian A, Sihag S, Lehar J, Puigserver P, Carlsson E, Ridderstråle M, Laurila E, et al. PGC-1 α-responsive genes involved in oxidative phosphorylation are coordinately downregulated in human diabetes. Nat Genet. 2003;34(3):267–73. doi: 10.1038/ng1180. - DOI - PubMed
MeSH terms
LinkOut - more resources
Full Text Sources
Other Literature Sources
