

ServAR: An augmented reality tool to guide the serving of food
- PMID: 28499433
- PMCID: PMC5429537
- DOI: 10.1186/s12966-017-0516-9
ServAR: An augmented reality tool to guide the serving of food
Abstract
Background: Accurate estimation of food portion size is a difficult task. Visual cues are important mediators of portion size and therefore technology-based aids may assist consumers when serving and estimating food portions. The current study evaluated the usability and impact on estimation error of standard food servings of a novel augmented reality food serving aid, ServAR.
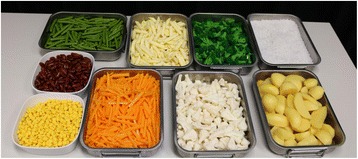
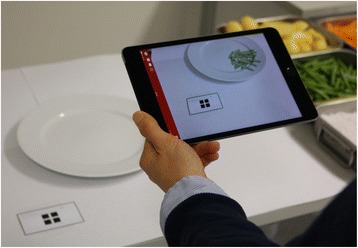
Methods: Participants were randomised into one of three groups: 1) no information/aid (control); 2) verbal information on standard serving sizes; or 3) ServAR, an aid which overlayed virtual food servings over a plate using a tablet computer. Participants were asked to estimate the standard serving sizes of nine foods (broccoli, carrots, cauliflower, green beans, kidney beans, potato, pasta, rice, and sweetcorn) using validated food replicas. Wilcoxon signed-rank tests compared median served weights of each food to reference standard serving size weights. Percentage error was used to compare the estimation of serving size accuracy between the three groups. All participants also performed a usability test using the ServAR tool to guide the serving of one randomly selected food.
Results: Ninety adults (78.9% female; a mean (95%CI) age 25.8 (24.9-26.7) years; BMI 24.2 (23.2-25.2) kg/m2) completed the study. The median servings were significantly different to the reference portions for five foods in the ServAR group, compared to eight foods in the information only group and seven foods for the control group. The cumulative proportion of total estimations per group within ±10%, ±25% and ±50% of the reference portion was greater for those using ServAR (30.7, 65.2 and 90.7%; respectively), compared to the information only group (19.6, 47.4 and 77.4%) and control group (10.0, 33.7 and 68.9%). Participants generally found the ServAR tool easy to use and agreed that it showed potential to support optimal portion size selection. However, some refinements to the ServAR tool are required to improve the user experience.
Conclusions: Use of the augmented reality tool improved accuracy and consistency of estimating standard serve sizes compared to the information only and control conditions. ServAR demonstrates potential as a practical tool to guide the serving of food. Further evaluation across a broad range of foods, portion sizes and settings is warranted.
Keywords: Augmented reality; Estimation error; Nutrition; Portion control; mHealth.
Figures
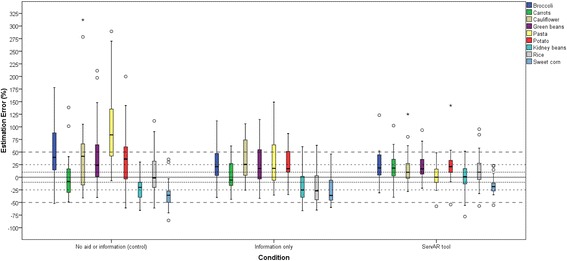
 ), ±25% (
 ), and ±50% (
 )
)References
Publication types
MeSH terms
LinkOut - more resources
Full Text Sources
Other Literature Sources
