. 2017 Jun 15;6(6):891-896.
doi: 10.1242/bio.025809.

Senescence gives insights into the morphogenetic evolution of anamniotes

Affiliations

Senescence gives insights into the morphogenetic evolution of anamniotes

Éric Villiard et al. Biol Open. .

Abstract

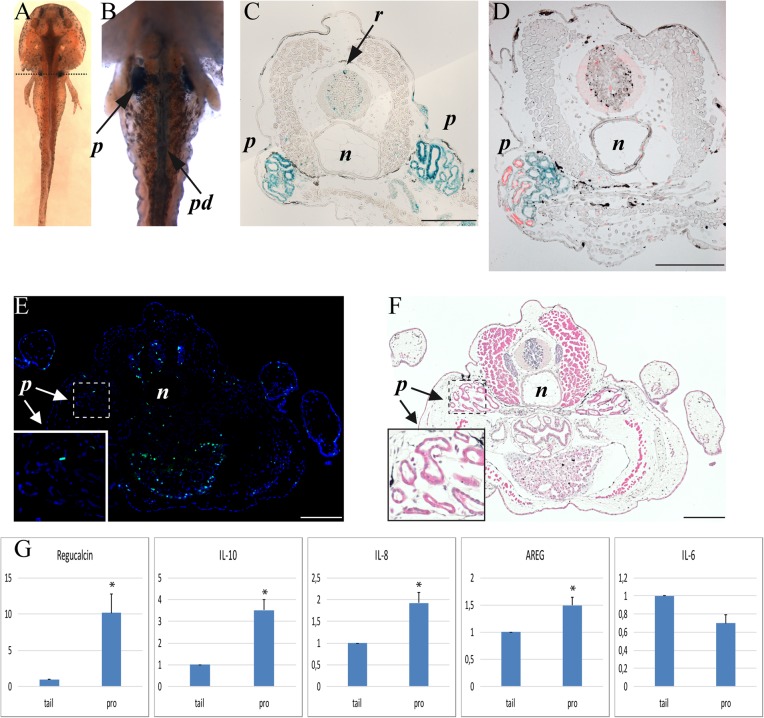
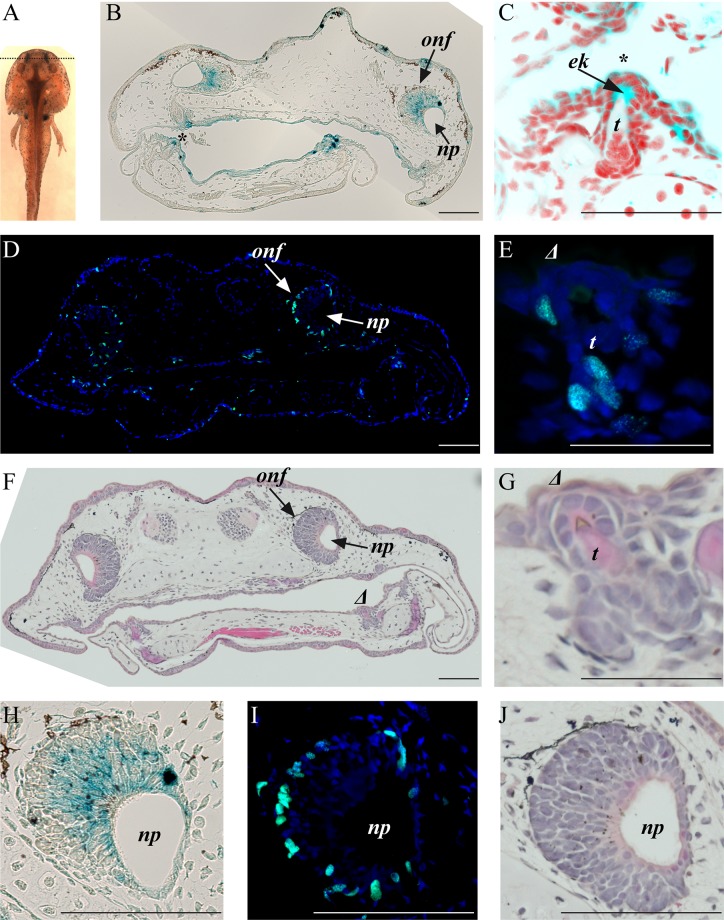
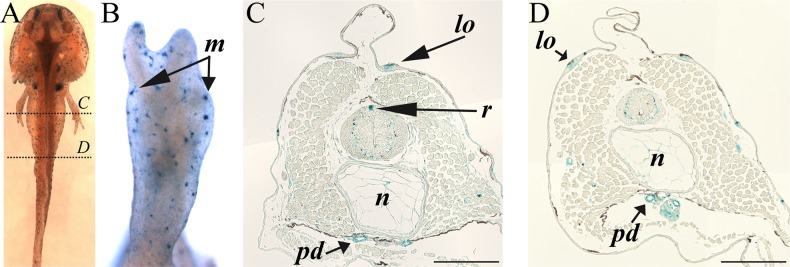
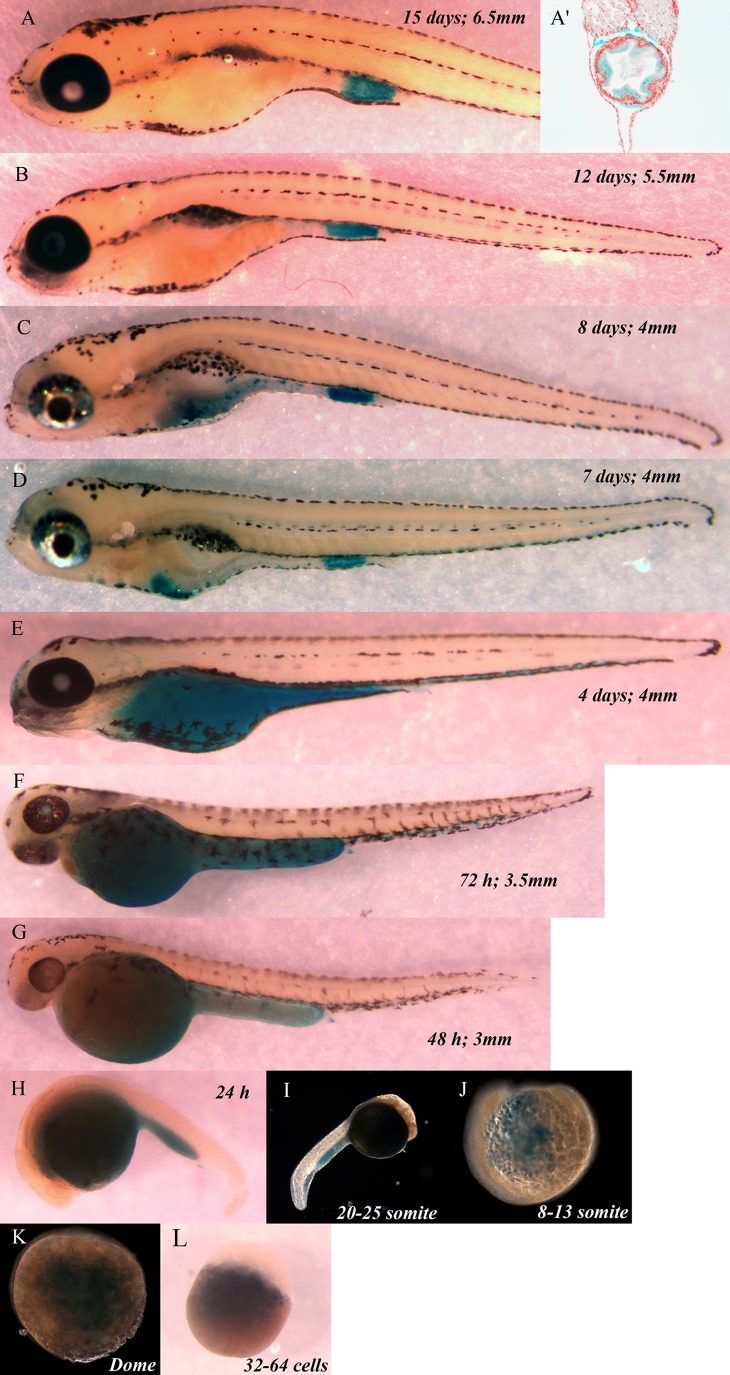
Senescence represents a mechanism to avoid undesired cell proliferation that plays a role in tumor suppression, wound healing and embryonic development. In order to gain insight on the evolution of senescence, we looked at its presence in developing axolotls (urodele amphibians) and in zebrafish (teleost fish), which are both anamniotes. Our data indicate that cellular senescence is present in various developing structures in axolotls (pronephros, olfactory epithelium of nerve fascicles, lateral organs, gums) and in zebrafish (epithelium of the yolk sac and in the lower part of the gut). Senescence was particularly associated with transient structures (pronephros in axolotls and yolk sac in zebrafish) suggesting that it may play a role in the elimination of these tissues. Our data supports the notion that cellular senescence evolved early in vertebrate evolution to influence embryonic development.

Keywords: Axolotl; Evolution; Morphogenesis; Pronephros; Senescence; Zebrafish.


Conflict of interest statement

Competing interestsThe authors declare no competing or financial interests.

Figures

Fig. 1.
Fig. 1.
Axolotl stage 50, pronephric area. (A) Dorsal view of wholemount SaβG staining (dotted line showing transversal section level). (B) Ventral view of wholemount SaβG staining. (C-F) Transversal section of pronephric area. (C) SaβG staining. (D) SaβG staining (blue) and phospho-Erk1/2 (red). (E) BrdU staining (green) and DAPI staining (blue). (F) H&E staining of panel E. (G) qRT-PCR measuring pronephros-specific gene regucalcin and SASP genes IL-10, IL-8, AREG and IL-6 in pronephric area versus tail tissue caudal to the pronephros. *P≤0.05 (paired t-test), mean±s.e.m. (normalized using GAPDH, n=4). p, pronephros; pd, pronephric duct; n, notochord; r, roof plate. Composite images are shown. Scale bars: 200 µm.
Fig. 2.
Fig. 2.
Axolotl stage 50, rostral area (mouth/nasal pit). (A) Dorsal view showing wholemount SaβG staining (dotted line represent transversal section level). (B) Rostral transverse section (SaβG staining). (C) Tooth, magnified from panel B, marked with * [SaβG staining in blue and nuclei in red (derived from DAPI stain which is blue that was converted to red in Photoshop to be able to overlay with the blue from SaβG)]. (D) Rostral transverse section, BrdU staining (green) and DAPI staining (blue). (E) Tooth magnified from panel D, marked with Δ, BrdU staining (green) and DAPI staining (blue). (F) Rostral transverse section, H&E staining of panel D. (G) Tooth, magnified from panel F, marked with Δ, H&E staining of panel E. (H) Olfactory nerve fascicule from panel B, SaβG staining. (I) Olfactory nerve fascicule from panel D, BrdU staining. (J) Olfactory nerve fascicule from panel F, H&E staining. onf, olfactory nerve fascicle; np, nasal pit; ek, enamel knot; t, tooth. Composite images are shown. Scale bars: 200 µm.
Fig. 3.
Fig. 3.
Axolotl stage 50, mid-body area, SaβG staining. (A) Dorsal view of wholemount SaβG staining with dotted lines showing subsequent transversal section levels. (B) Forelimb SaβG staining. (C) Mid-body transverse section. (D) Caudal transverse section. lo, lateral organ; r, roof plate; n, notochord; pd, pronephric duct. Composite images are shown. Scale bars: 200 µm.
Fig. 4.
Fig. 4.
Zebrafish stages, SaβG staining. Presented from (A) 15 days post-fertilization animal; (A′) transverse section, cloaca level, DAPI staining of nuclei (red) and SaβG staining (blue); (B) 12 days; (C) 8 days; (D) 7 days; (E) 4 days; (F) 72 h; (G) 48 h; (H) 24 h; (I) 20-25 somite; (J) 8-13 somite; (K) Dome; and (L) 32-64 cells embryo. The length of the embryos is indicated in mm on each panel.

References

    1. Coppé J.-P., Patil C. K., Rodier F., Sun Y., Muñoz D. P., Goldstein J., Nelson P. S., Desprez P. Y. and Campisi J. (2008). Senescence-associated secretory phenotypes reveal cell-nonautonomous functions of oncogenic RAS and the p53 tumor suppressor. PLoS Biol. 6, 2853-2868. 10.1371/journal.pbio.0060301 - DOI - PMC - PubMed
    1. Davaapil H., Brockes J. P. and Yun M. H. (2017). Conserved and novel functions of programmed cellular senescence during vertebrate development. Development 144, 106-114. 10.1242/dev.138222 - DOI - PMC - PubMed
    1. Deschenes-Simard X., Gaumont-Leclerc M.-F., Bourdeau V., Lessard F., Moiseeva O., Forest V., Igelmann S., Mallette F. A., Saba-El-Leil M. K., Meloche S. et al. (2013). Tumor suppressor activity of the ERK/MAPK pathway by promoting selective protein degradation. Genes Dev. 27, 900-915. 10.1101/gad.203984.112 - DOI - PMC - PubMed
    1. Donnini S., Solito R., Cetti E., Corti F., Giachetti A., Carra S., Beltrame M., Cotelli F. and Ziche M. (2010). Abeta peptides accelerate the senescence of endothelial cells in vitro and in vivo, impairing angiogenesis. FASEB J. 24, 2385-2395. 10.1096/fj.09-146456 - DOI - PubMed
    1. Francis J. C., Radtke F. and Logan M. P. O. (2005). Notch1 signals through Jagged2 to regulate apoptosis in the apical ectodermal ridge of the developing limb bud. Dev. Dyn. 234, 1006-1015. 10.1002/dvdy.20590 - DOI - PubMed

LinkOut - more resources