. 2017 Jun 15;198(12):4855-4867.
doi: 10.4049/jimmunol.1602175. Epub 2017 May 12.

The Upregulation of Integrin αDβ2 (CD11d/CD18) on Inflammatory Macrophages Promotes Macrophage Retention in Vascular Lesions and Development of Atherosclerosis

Affiliations

The Upregulation of Integrin αDβ2 (CD11d/CD18) on Inflammatory Macrophages Promotes Macrophage Retention in Vascular Lesions and Development of Atherosclerosis

Moammir H Aziz et al. J Immunol. .

Abstract

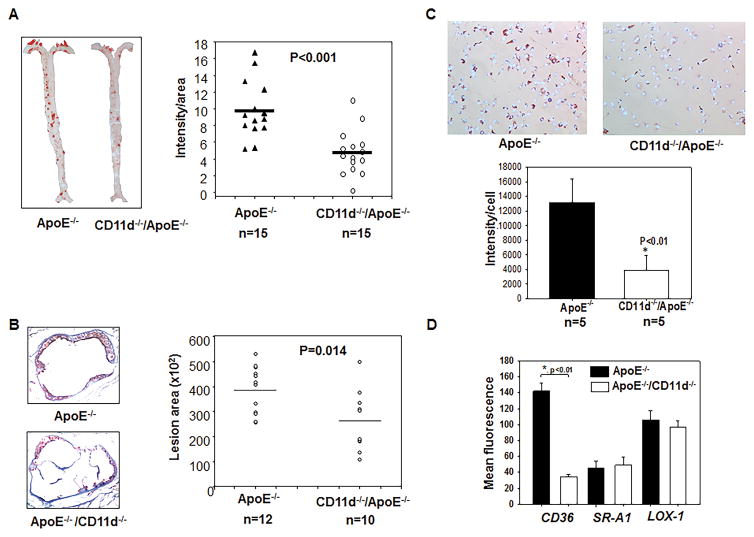
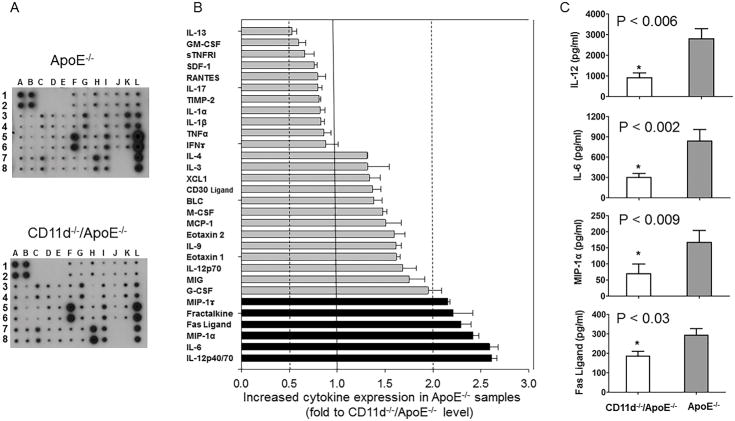
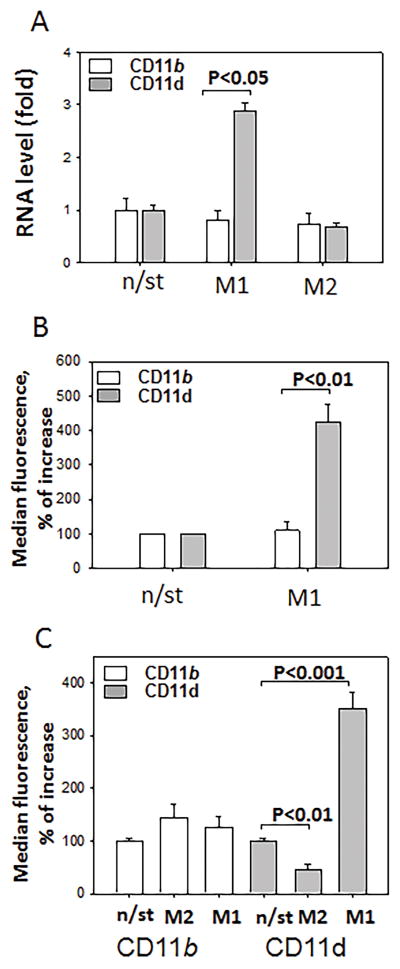
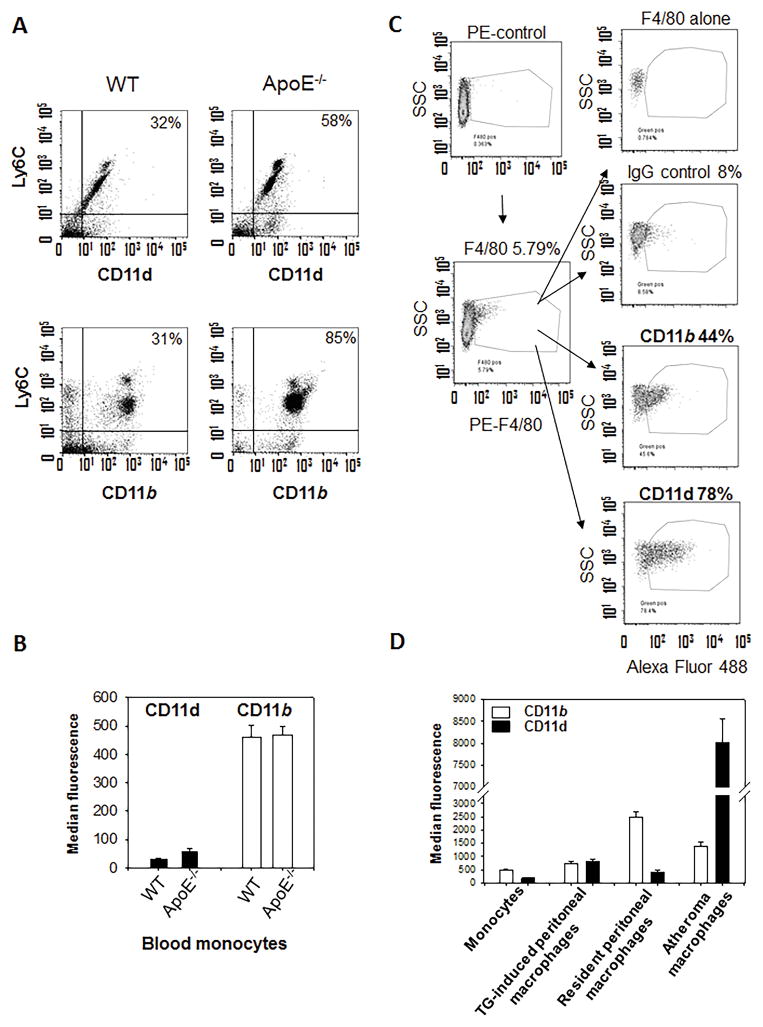
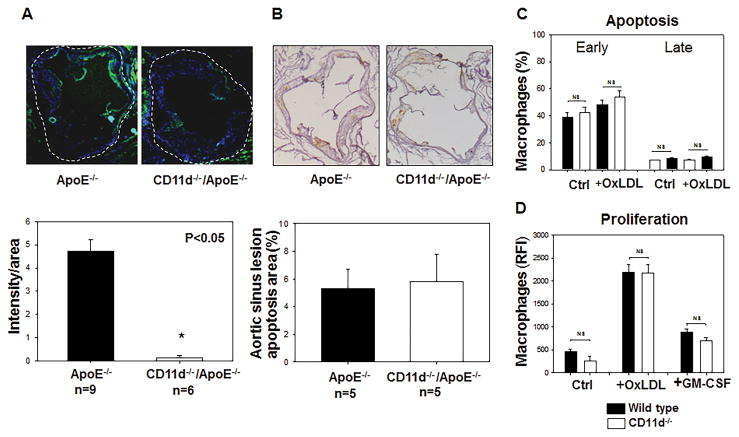
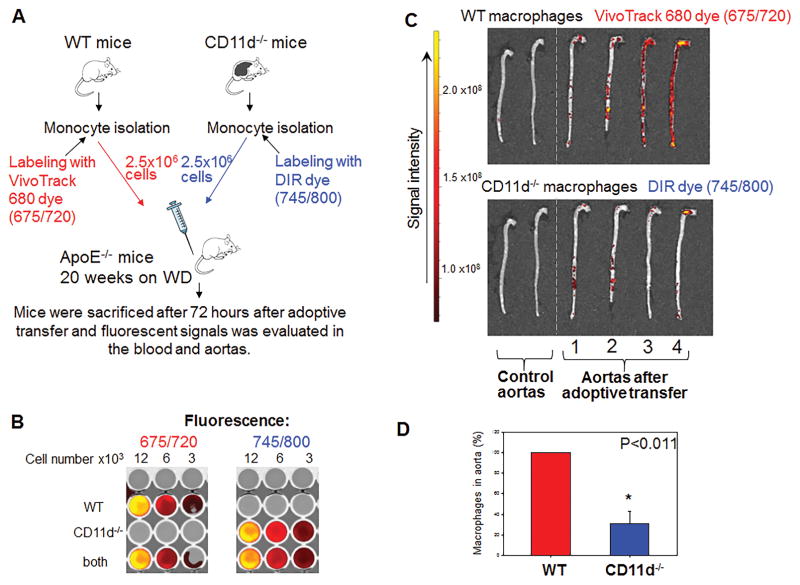
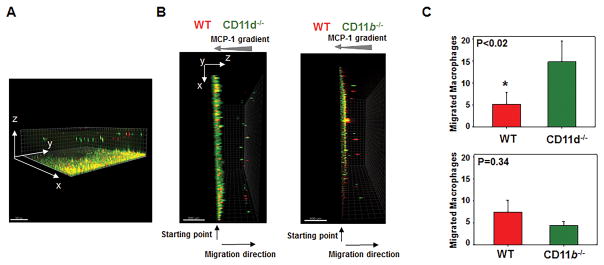
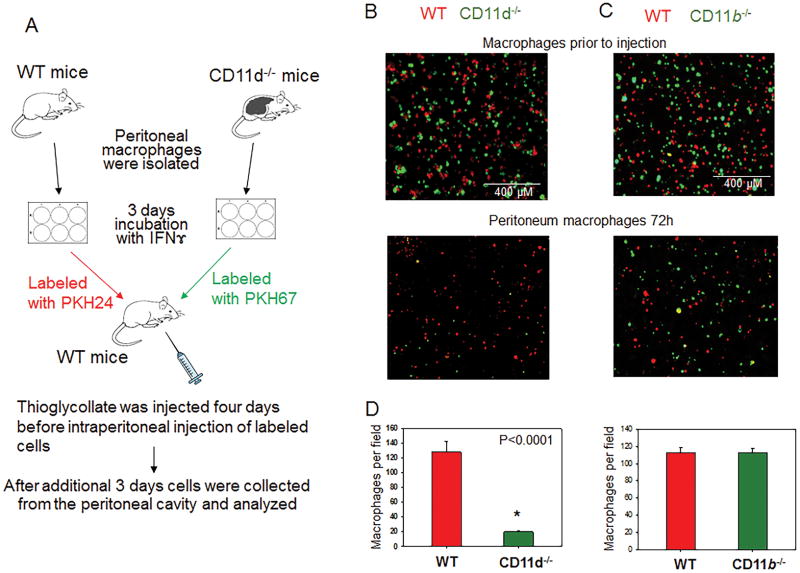
Macrophage accumulation is a critical step during development of chronic inflammation, initiating progression of many devastating diseases. Leukocyte-specific integrin αDβ2 (CD11d/CD18) is dramatically upregulated on macrophages at inflammatory sites. Previously we found that CD11d overexpression on cell surfaces inhibits in vitro cell migration due to excessive adhesion. In this study, we have investigated how inflammation-mediated CD11d upregulation contributes to macrophage retention at inflammatory sites during atherogenesis. Atherosclerosis was evaluated in CD11d-/-/ApoE-/- mice after 16 wk on a Western diet. CD11d deficiency led to a marked reduction in lipid deposition in aortas and isolated macrophages. Macrophage numbers in aortic sinuses of CD11d-/- mice were reduced without affecting their apoptosis and proliferation. Adoptive transfer of fluorescently labeled wild-type and CD11d-/- monocytes into ApoE-/- mice demonstrated similar recruitment from circulation, but reduced accumulation of CD11d-/- macrophages within the aortas. Furthermore, CD11d expression was significantly upregulated on macrophages in atherosclerotic lesions and M1 macrophages in vitro. Interestingly, expression of the related ligand-sharing integrin CD11b was not altered. This difference defines their distinct roles in the regulation of macrophage migration. CD11d-deficient M1 macrophages demonstrated improved migration in a three-dimensional fibrin matrix and during resolution of peritoneal inflammation, whereas migration of CD11b-/- M1 macrophages was not affected. These results prove the contribution of high densities of CD11d to macrophage arrest during atherogenesis. Because high expression of CD11d was detected in several inflammation-dependent diseases, we suggest that CD11d/CD18 upregulation on proinflammatory macrophages may represent a common mechanism for macrophage retention at inflammatory sites, thereby promoting chronic inflammation and disease development.


Figures

Fig. 1
Fig. 1. Integrin CD11d deficiency decreases the development of atherosclerosis and reduces macrophage foam cell formation in mice
CD11d−/−/ApoE−/− and ApoE−/− mice were fed a western diet for 16 weeks, then entire aortas (A) and aorta sinuses (B) and peritoneal macrophages (C) were isolated and stained with Oil Red O. Five slides were analyzed from each mouse. The staining was analyzed with Image-Pro Plus software. Statistical analysis was performed using Student’s t-test. (* P<0.01). D. Scavenger receptor expression was evaluated by flow cytometry on peritoneal macrophages isolated from CD11d−/−/ApoE−/− (white bars) and ApoE−/− (black bars) mice using anti-CD36, anti-SR-A1 and anti-LOX-1 antibodies. The data represent the mean + SEM from 3 mice of each group.
Fig. 2
Fig. 2
Inflammatory cytokine production in the plasma of CD11d−/−/ApoE−/− and ApoE−/− mice after 16 weeks on a western diet. A. The pooled plasma samples from five CD11d−/−/ApoE−/− and five ApoE−/− mice were evaluated in duplicates using the Mouse Inflammation antibody array C1 (RayBiotech, Inc. Norcross, GA) following the manual. The membrane identification chart is shown in the Supplemental materials (Supplemental Table 1). B. The ratio of cytokine expressions ApoE−/− versus CD11d−/−/ApoE−/− was calculated and plotted. Cytokines that demonstrate no difference in the level of expression between two groups, such as I-TAC, sTNRFII, TIMP-1, TECK, Leptin, KC, LIX, TCA-3, IL-2, were not plotted to simplify presentation. C. The levels of expression of IL-12, IL-6, Mip-1α and FAS ligand were verified using ELISA Kits (Boster Ltd., Pleasanton, CA). The data represent the mean + SEM from 6 mice of each group. Statistical analysis was performed using Student’s t-test.
Fig. 3
Fig. 3. Integrin CD11d is upregulated on M1 macrophages in vitro.
Mouse peritoneal macrophages, isolated after the intraperitoneal injection of 4% thioglycollate, were plated and stimulated with 100 U/ml IFNγ or 2 nM IL-4 for 3 days. After incubation integrin expression was evaluated by real-time quantitative PCR (A) and by FACS (B) (n=5). C. Human primary monocytes were stimulated with IFNγ (M1) or IL-13 (M2) for 5 days and integrin expression was evaluated by FACS. Mean fluorescence values are plotted based on 5 independent experiments.
Fig. 4
Fig. 4. Expression of CD11d on monocytes in circulation and on macrophages in atherosclerotic lesions during the development of atherogenesis
A. Integrins CD11d and CD11b expression on monocytes in circulation of WT mice on normal diet and ApoE−/− mice 16 weeks on the western diet. The enriched fraction of blood monocytes was double stained with anti-Ly6C antibody (APC) and anti-CD11d (or anti-CD11b) antibodies (FITC). B. Data were evaluated using FlowJo software. C. Integrins CD11d and CD11b expression in atherosclerotic lesions. Aortas of ApoE−/− mice were isolated, digested and subjected to multi-color FACS with macrophage marker mAb F4/80 and integrin specific antibodies. Data are from a representative experiment of three with similar results. D. CD11d and CD11b expression on murine circulating monocytes; thioglycollate-induced peritoneal, resident peritoneal and atheroma macrophages. Data were plotted as the mean ± SEM.
Fig. 5
Fig. 5. Macrophage accumulation, apoptosis and proliferation in the mouse aortic sinus
A. Macrophage staining in the aortic sinus from ApoE−/− and Apo−/−/CD11d−/− mice: Upper panel. Representative images of a cross section of the aortic sinus stained with Mac3 (40× magnification). The intima of vessel wall is surrounded by dash line. Lower panel, the graph represents the quantification of the surface area positive for Mac3. The data represent the mean + SEM of Mac3 positive areas in 6 sections of each group. *p<0.05. Integrin CD11d-deficiency does not affect macrophage apoptosis (B, C) or proliferation (D). B. Apoptosis was evaluated on aorta sinuses isolated from ApoE−/− and CD11d−/−/ApoE−/− mice using ApopTag peroxidase in Situ apoptosis kit. C. Peritoneal macrophages were isolated from WT and CD11d−/− mice and incubated in vitro in different conditions. Macrophage apoptosis was assessed after 24 hours incubation on plates and an additional 18 hours incubation in the presence of 15 mg/ml OxLDL using Annexin V assay. D. Macrophage proliferation was evaluated after 5 days in culture in the presence of 50 mg/ml OxLDL or 60 ng/ml GM-CSF using CyQUANT® Direct proliferation assay kit. Black bars – wild type macrophages, open bars – CD11d-deficient macrophages. Data were plotted as the mean ± SEM. Statistical analysis was performed using Student’s t-test.
Fig. 6
Fig. 6. Tracking the migration of adoptively transferred fluorescently-labeled monocytes to the atherosclerotic lesions of ApoE-deficient mice
A. WT and CD11d-deficient monocytes were labeled with VivoTrack680 and DIR near infrared fluorescent dyes, correspondingly. An equal number of labeled WT and CD11d−/− cells was injected into the same ApoE−/− mouse. After 72 hours aortas from donor mice were isolated and fluorescence was measured using IVIC Spectrum CT Imaging system. B. The intensity of fluorescent signals and potential overlapping of dyes were normalized to the number of fluorescently labeled cells incubated in vitro by plating labeled monocytes in different concentrations in a 96-well plate. C. Two control aortas (no fluorescent cells injected) and four experimental aortas were evaluated using IVIC Spectrum CT Imaging system. D. The calculated result is based on the ratio between WT and CD11d−/− macrophages in atherosclerotic aortas. Data were plotted as the mean ± SEM. Statistical analysis was performed using Student’s t-test.
Fig. 7
Fig. 7. CD11d-deficiency improves the migration of pro-inflammatory M1-activated macrophages in 3-D fibrin gels
Migration of fluorescently labeled WT and CD11d-deficient (or CD11b-deficient) M1 macrophages in 3D fibrin toward an MCP-1 gradient (A, B). A. The example of 3-D view of migrated macrophages generated by collecting Z-stack images through fibrin matrix. B. Side view of generated 3-D images. WT and CD11d−/− peritoneal macrophages (B, left panel) or WT and CD11b−/− peritoneal macrophages (B, right panel) were activated in vitro for 3 days with IFNγ, labeled with PKH26 and PKH67 fluorescent dyes, respectively, and plated on 3D polymerized fibrin in transwell inserts. Migration of macrophages was stimulated by 30 nM MCP-1 added to the top of the gel. After 24 hours migrating cells were detected by a Leica Confocal microscope (Leica-TCS SP8) and the results were analyzed by IMARIS 8.0 software (C). Statistical analyses were performed using Student’s paired t-tests (n=4 per group). Scale bar – 500 μM.
Fig. 8
Fig. 8. CD11d-deficiency improves the efflux of pro-inflammatory M1-activated macrophages from the peritoneal cavity
A. Peritoneal macrophages were isolated from WT and integrin-deficient mice at 3 days after injection of thioglycollate (TG) and labeled with PKH26 and PKH67 fluorescent dyes. Labeled WT and CD11d−/− or WT and CD11b−/− macrophages were mixed in a 1:1 ratio and further injected intraperitoneally into WT mice at 4 days after TG induced inflammation. The equal ratio of red and green macrophages before the injection was verified by sample cytospin preparation (B). 3 days later, peritoneal macrophages were harvested, cytospun and the percentages of red and green fluorescent macrophages were assessed by fluorescence microscopy using at least 9 fields of view per sample (n=6) (C). The quantification of the data was analyzed by using Image Analysis Software (EVOS, Thermo Fisher) (D). Statistical analysis was performed using Student’s paired t-tests.

References

    1. Tobias P, Curtiss LK. Thematic review series: The immune system and atherogenesis. Paying the price for pathogen protection: toll receptors in atherogenesis. J Lipid Res. 2005;46:404–411. - PubMed
    1. Alexandraki K, Piperi C, Kalofoutis C, Singh J, Alaveras A, Kalofoutis A. Inflammatory process in type 2 diabetes: The role of cytokines. Ann N Y Acad Sci. 2006;1084:89–117. - PubMed
    1. Ouchi N, Kihara S, Funahashi T, Matsuzawa Y, Walsh K. Obesity, adiponectin and vascular inflammatory disease. Curr Opin Lipidol. 2003;14:561–566. - PubMed
    1. Subramanian S, Chait A. The effect of dietary cholesterol on macrophage accumulation in adipose tissue: implications for systemic inflammation and atherosclerosis. Curr Opin Lipidol. 2009;20:39–44. - PubMed
    1. Weaver LC, Bao F, Dekaban GA, Hryciw T, Shultz SR, Cain DP, Brown A. CD11d integrin blockade reduces the systemic inflammatory response syndrome after traumatic brain injury in rats. Exp Neurol. 2015;271:409–422. - PMC - PubMed

Publication types

MeSH terms