. 2017 Jul;174(3):1420-1435.
doi: 10.1104/pp.17.00412. Epub 2017 May 12.

Acyl-CoA-Binding Protein ACBP1 Modulates Sterol Synthesis during Embryogenesis

Affiliations

Acyl-CoA-Binding Protein ACBP1 Modulates Sterol Synthesis during Embryogenesis

Shiu-Cheung Lung et al. Plant Physiol. 2017 Jul.

Abstract

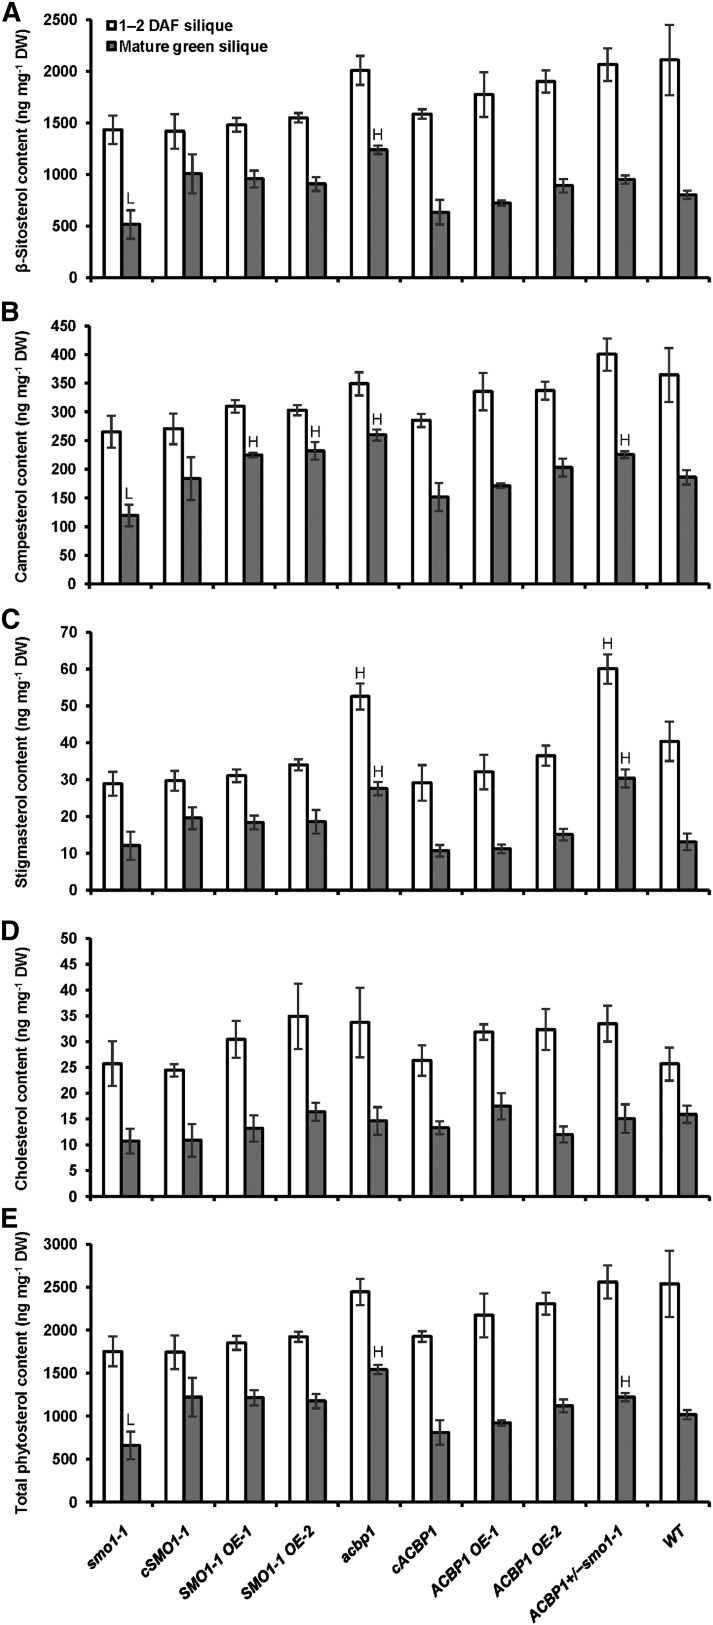
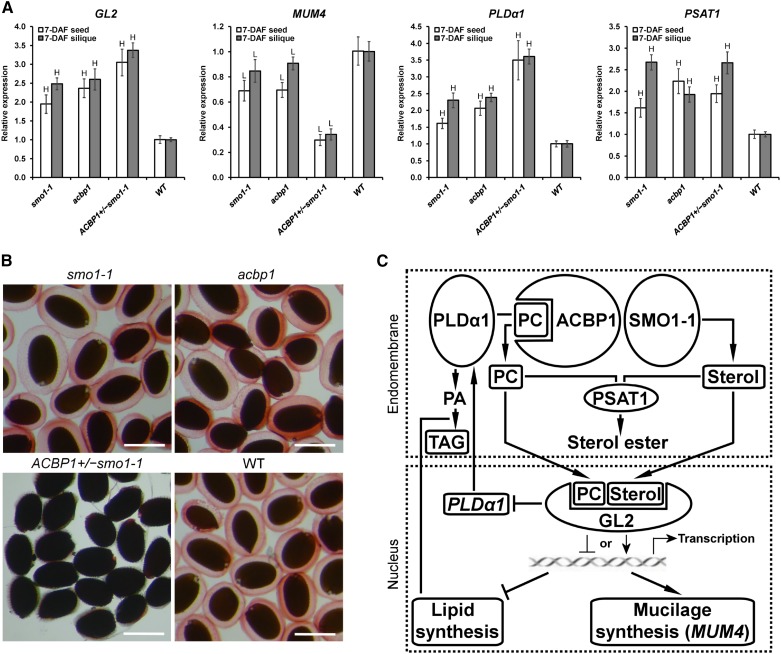
Fatty acids (FAs) and sterols are primary metabolites that exert interrelated functions as structural and signaling lipids. Despite their common syntheses from acetyl-coenzyme A, homeostatic cross talk remains enigmatic. Six Arabidopsis (Arabidopsis thaliana) acyl-coenzyme A-binding proteins (ACBPs) are involved in FA metabolism. ACBP1 interacts with PHOSPHOLIPASE Dα1 and regulates phospholipid composition. Here, its specific role in the negative modulation of sterol synthesis during embryogenesis is reported. ACBP1, likely in a liganded state, interacts with STEROL C4-METHYL OXIDASE1-1 (SMO1-1), a rate-limiting enzyme in the sterol pathway. Proembryo abortion in the double mutant indicated that the ACBP1-SMO1-1 interaction is synthetic lethal, corroborating with their strong promoter activities in developing ovules. Gas chromatography-mass spectrometry revealed quantitative and compositional changes in FAs and sterols upon overexpression or mutation of ACBP1 and/or SMO1-1 Aberrant levels of these metabolites may account for the downstream defect in lipid signaling. GLABRA2 (GL2), encoding a phospholipid/sterol-binding homeodomain transcription factor, was up-regulated in developing seeds of acbp1, smo1-1, and ACBP1+/-smo1-1 in comparison with the wild type. Consistent with the corresponding transcriptional alteration of GL2 targets, high-oil, low-mucilage phenotypes of gl2 were phenocopied in ACBP1+/-smo1-1 Thus, ACBP1 appears to modulate the metabolism of two important lipid classes (FAs and sterols) influencing cellular signaling.


Figures

Figure 1.
Figure 1.
PPI of ACBP1 with SMO1-1. A, Y2H assays. The soluble domain of ACBP1, its derivative without the ankyrin repeat (ANK) or acyl-CoA-binding (ACB) domains, and its mutated (Y171A) versions were cloned into the bait vector. The full-length SMO1-1 sequence was cloned into the prey vector. Cotransformants of bait and prey constructs were verified on double dropout (DDO) plates. The appearance of blue colonies on triple dropout selection plates (TDO/X/A) indicates PPI. The pGADT7-T construct was cotransformed with pGBKT7-53 and pGBKT7-Lam as positive and negative controls, respectively. B, Localization of SMO1-1:EGFP in transgenic Arabidopsis. Leaf epidermal cells of 3-week-old plants and root cells of 1-week-old seedlings were imaged by confocal laser scanning microscopy. Signals were detected at the perinuclear ER (white arrowheads), ER bodies (open arrowheads), and tubular ER network throughout the cells. Signals were colocalized at the membrane of ER-derived vesicles (red arrowheads) using the ER-Tracker in root hair cells (bottom). Bars = 20 µm. C, Colocalization of SMO1-1:EGFP with DsRed:ACBP1. Root and hypocotyl cells of 1-week-old transgenic Arabidopsis seedlings and agroinfiltrated tobacco leaf epidermal cells were imaged by confocal laser scanning microscopy. Signals were colocalized at the plasma membrane, membrane of ER-derived vesicles (red arrowheads), ER cisternae (arrows), and perinuclear ER (white arrowheads). Bars = 20 µm. D, Subcellular fractionation of SMO1-1:HA:StrepII and ACBP1. Proteins (20 µg per lane) from total crude extracts (T), nuclei (N), membranes (M), large particles including mitochondria, plastids, and peroxisomes (LP), and soluble fractions (S) were prepared from aboveground tissues of 6-week-old Arabidopsis and analyzed by western-blot analysis and Coomassie Blue-stained gels. Total proteins from an empty vector line (VC) served as a negative control. Arrowheads indicate the positions of the expected bands (37 kD for SMO1-1:HA:StrepII and 38 kD for ACBP1). E, Strep-Tactin pull-down assays. Membrane proteins were isolated from transgenic Arabidopsis of SMO1-1:HA:StrepII and the vector control, solubilized, and incubated with Strep-Tactin beads. Eluents were analyzed by western-blot analysis using anti-ACBP1 and anti-HA antibodies. F, Coimmunoprecipitation of SMO1-ACBP1 complexes. Membrane proteins were prepared as described in E and incubated with anti-ACBP1 antibodies that had been covalently coupled to Affi-Gel 10 beads. Eluents were analyzed by western-blot analysis using anti-ACBP1 and anti-HA antibodies.
Figure 2.
Figure 2.
Spatial expression pattern of SMO1-1 in Arabidopsis. A, Relative expression levels of SMO1-1 in various tissues of 6-week-old acbp1 and the wild type (WT). Transcript levels were measured by qRT-PCR and normalized against ACTIN2. Each bar represents the mean of three replicates ± sd. H and L indicate statistically significant (P < 0.05) elevation and reduction, respectively, in comparison with the wild type by Student’s t test. B, SMO1-1pro:GUS expression pattern at different stages of floral development. GUS signals were detected in 8-week-old transgenic Arabidopsis. Intact and open pistils at stages 13 and 14 are shown. Bar = 1 mm. C to F, Whole-mount floral parts of SMO1-1pro:GUS, including sepals (inset, guard cells; C), anthers (D), ovaries at stage 13 (E), and ovules at stage 14 (F). Arrowheads and the arrow indicate egg apparatus and a central cell, respectively. Bars = 100 µm (C), 10 µm (inset in C), 50 µm (D and E), and 20 µm (F).
Figure 3.
Figure 3.
Characterization of the smo1-1 mutant. A, Genomic structure of the SMO1-1 gene, indicating the locations of the T-DNA insertion in smo1-1 and the primers for genotyping. Black and white boxes represent coding and untranslated regions of exons, respectively. B, PCR genotyping of smo1-1. The primer combination LBa1/ML2265 was diagnostic for the presence of T-DNA, and ML2251/ML2265 was diagnostic for the wild-type (WT) gene. C, RT-PCR showing knockdown mutation in smo1-1 as measured using 2-week-old seedlings and various organs of 6-week-old plants. ACTIN2 served as a loading control. D, The relative expression levels of SMO1-1 in smo1-1 were compared with those in the wild type (defined value of 1) using 6-week-old plants by qRT-PCR. Transcript levels were normalized against ACTIN2. Each bar represents the mean of three replicates ± sd. L indicates statistically significant (P < 0.05) reduction in comparison with the wild type by Student’s t test.
Figure 4.
Figure 4.
Early embryo abortion in self-pollinated ACBP1+/−smo1-1. A, Representative image of an open silique from a self-pollinated F3 plant showing developing seeds and aborted ovules (as indicated by arrowheads). Bar = 500 µm. B, Seed counts using eight siliques per plant. Each bar represents the mean calculated from four plants ± sd. H and L indicate statistically significant (P < 0.01) elevation and reduction, respectively, in comparison with the wild type (WT) by Student’s t test. A χ2 test showed no significant (P > 0.05) deviation from the hypothesized 3:1 segregation ratio. C, Histological examination of the aborted ovules from self-pollinated ACBP1+/−smo1-1. Siliques at 3 to 4 DAF were sectioned, stained, and imaged by light microscopy. Open and closed arrowheads indicate an aborted ovule and a developing seed, respectively. Bars = 20 µm and 5 µm (inset). D, Nomarski image of the aborted ovule. A representative aborted ovule from acbp1smo1-1 showed a distorted appearance of suspensor cells (left), as magnified in the middle and outlined at right. cc, Central cell; pe, early proembryo; su, suspensor. Bars = 10 µm. E, Genetic transmission of acbp1smo1-1 gametophytes after reciprocal crossing with the wild type. a, Statistically insignificant (P > 0.05) deviation from the hypothesized 1:1 segregation ratio.
Figure 5.
Figure 5.
Phenotypic aberrance of ACBP1+/−smo1-1. A, Representative images showing various organs of 6-week-old plants, including inflorescences (bars = 2 mm), floral buds (bars = 0.25 mm), open flowers with/without sepals and petals removed (bars = 0.5 mm), floral stems (bars = 1 cm), and mature green siliques (bars = 0.4 cm). B to F, Comparison of ACBP1+/−smo1-1 with the wild type (WT) in terms of average silique number per plant (B), average silique length (C), average 250-seed weight (D), germination rate using 250 dry after-ripened seeds sown on Murashige and Skoog (MS) plates for 7 d (E), and primary root length of 8-d-old seedlings (F). Each bar represents the mean obtained from seven plants ± sd (except n = 35 in C and n = 48 in F). L indicates statistically significant (P < 0.01) reduction in comparison with the wild type by Student’s t test.
Figure 6.
Figure 6.
Major sterol content of mutant, complemented, and OE lines of SMO1-1 and ACBP1. Phytosterols were extracted from young (1–2 DAF) and mature green siliques of 6- to 7-week-old Arabidopsis and analyzed by GC-MS. Each bar represents the mean of four replicates ± sd. H and L indicate statistically significant (P < 0.01) elevation and reduction, respectively, in comparison with the wild type by Student’s t test. A, β-Sitosterol. B, Campesterol. C, Stigmasterol. D, Cholesterol. E, Total phytosterols. DW, Dry weight.
Figure 7.
Figure 7.
Knockdown of SMO1-1 and/or ACBP1 affected GL2 function in seeds. A, Relative expression levels of GL2, MUM4, PLDα1, and PSAT1 in various genotypes against the wild type (WT; defined value of 1) using 6-week-old plants by qRT-PCR. Transcript levels were normalized against ACTIN2. Each bar represents the mean of three (7-DAF silique) or four (7-DAF seed) replicates ± sd. H and L indicate statistically significant (P < 0.01) elevation and reduction, respectively, in comparison with the wild type by Student’s t test. B, Seed coat mucilage staining. Mature seeds were hydrated and stained with Ruthenium Red. Bars = 0.5 mm. C, A mechanistic model illustrating the proposed effect of ACBP1 on GL2 function. At endomembranes, ACBP1 interacts with PLDα1 and SMO1-1 to regulate PC and PA metabolism (Du et al., 2013) and sterol synthesis (this study), respectively. The homeostatic levels of PLs and sterols are maintained by converting excessive molecules into sterol esters under the catalysis of PSAT1. In the nucleus, GL2 binds PC and sterols (Ponting and Aravind, 1999; Schrick et al., 2014) that are crucial for its transcriptional regulatory activities, including the activation of MUM4 expression for mucilage synthesis (Shi et al., 2012) and the inhibition of PLDα1 expression (Liu et al., 2014) and lipid synthesis (Shen et al., 2006). This signaling pathway could be affected upon ACBP1 and/or SMO1-1 knockdown, as reflected by changes in mRNA expression of the proteins involved and levels of lipid metabolites.

Similar articles

Cited by

References

    1. Almagro A, Lin SH, Tsay YF (2008) Characterization of the Arabidopsis nitrate transporter NRT1.6 reveals a role of nitrate in early embryo development. Plant Cell 20: 3289–3299 - PMC - PubMed
    1. Bach TJ. (1995) Some new aspects of isoprenoid biosynthesis in plants: a review. Lipids 30: 191–202 - PubMed
    1. Beh CT, Rine J (2004) A role for yeast oxysterol-binding protein homologs in endocytosis and in the maintenance of intracellular sterol-lipid distribution. J Cell Sci 117: 2983–2996 - PubMed
    1. Benveniste P. (2004) Biosynthesis and accumulation of sterols. Annu Rev Plant Biol 55: 429–457 - PubMed
    1. Block MA, Dorne AJ, Joyard J, Douce R (1983) The acyl-CoA synthetase and acyl-CoA thioesterase are located on the outer and inner membrane of the chloroplast envelope, respectively. FEBS Lett 153: 377–381

MeSH terms