. 2017 Jul;174(3):1399-1419.
doi: 10.1104/pp.16.00946. Epub 2017 May 12.

Impaired Mitochondrial Transcription Termination Disrupts the Stromal Redox Poise in Chlamydomonas

Affiliations

Impaired Mitochondrial Transcription Termination Disrupts the Stromal Redox Poise in Chlamydomonas

Andreas Uhmeyer et al. Plant Physiol. 2017 Jul.

Abstract

In photosynthetic eukaryotes, the metabolite exchange between chloroplast and mitochondria ensures efficient photosynthesis under saturating light conditions. The Chlamydomonas reinhardtii mutant stm6 is devoid of the mitochondrial transcription termination factor MOC1 and aberrantly expresses the mitochondrial genome, resulting in enhanced photosynthetic hydrogen production and diminished light tolerance. We analyzed the modulation of mitochondrial and chlororespiration during the acclimation of stm6 and the MOC1-complemented strain to excess light. Although light stress stimulated mitochondrial respiration via the energy-conserving cytochrome c pathway in both strains, the mutant was unable to fine-tune the expression and activity of oxidative phosphorylation complex I in excess light, which was accompanied by an increased mitochondrial respiration via the alternative oxidase pathway. Furthermore, stm6 failed to fully activate chlororespiration and cyclic electron flow due to a more oxidized state of the chloroplast stroma, which is caused by an increased mitochondrial electron sink capacity. Increased susceptibility to photoinhibition of PSII in stm6 demonstrates that the MOC1-dependent modulation of mitochondrial respiration helps control the stromal redox poise as a crucial part of high-light acclimation in C. reinhardtii.


Figures

Figure 1.
Figure 1.
Gene expression modulation of mitorespiratory components in response to excess light is altered in mutant stm6. A, Immunodetection of MOC1 (IB) in the MOC1-complemented strain (B13). A photoautotrophic culture was grown at a low light intensity (100 µmol photons m−2 s−1) before splitting it into two new cultures at t0h. One of the cultures was cultivated at low light intensity (LL) and the other one under high light conditions (1,500 µmol photons m−2 s−1). Protein samples were taken at indicated time points. Loading control: Coomassie Brilliant Blue (CBB) stain. B, RT-qPCR analysis of nd1, cox1, and cob transcript levels in B13 and stm6 before (0h) and distinct hours after the onset of high light stress. Expression levels were normalized to the mRNA level of B13 at t0h (set to 1). ses are derived from three biological replicates, each including at least three technical replicates (n = 3). Asterisks indicate significant differences between B13 and stm6 according to a two-tailed Student’s t test (*P < 0.05; **P < 0.1). C, mRNA levels of nucleus-encoded complex I (NUO5/21) and complex IV subunits (COX3C/5C) before (0 h) and after exposure to high light (3 h). ses are derived from two biological replicates, each including three technical replicates (n = 2). D, Expression levels of transcripts encoding mitochondrial alternative oxidase (AOX1) and two different rotenone-insensitive NAD(P)H dehydrogenases (NDA1/5). ses are derived from three biological replicates, each including three technical replicates (n = 3). E, Immunodetection of proteins AOX1, cox1, COX2B, and histone H3. Top: Representative immunoblot results. Loading control: Immunodetection of histone H3 and Coomassie Brilliant Blue-staining (CBB). Bottom: Relative protein levels (B13 t0 set to 1) obtained by densitometric scanning of immunoblot signals. Error bars indicate the se derived from three biological replicates, each including three technical replicates (n = 3).
Figure 2.
Figure 2.
Perturbed acclimation of mitochondrial respiration in response to high light in the absence of MOC1. A, Dark respiration in stm6 (red bars) and B13 (black bars) before (t0) and after the onset of high light stress (t2-8h). Values are normalized to the respiration rate determined for B13 at t0 (set to 100%). Error bars represent the se derived from five biological replicates (n = 5). Asterisks indicate significant differences between B13 and stm6 according to a two-tailed Student’s t test (P < 0.05). B, The relative contribution of alternative respiration (AOX/PTOX) to dark respiration. Alternative respiration was measured as dark respiration in the presence of 1 mm KCN, which could be inhibited by 1 mm nPG (KCN+nPG). Values are given relative to the dark respiration in the absence of inhibitor (set to 100%). ses are derived from three biological replicates (n = 3). C, The relative contribution of OXPHOS complex IV to dark respiration was measured as dark respiration in the presence of 1 mm nPG, which could be inhibited by 1 mm KCN (nPG+KCN). D, Inhibition of OXPHOS complex I by the addition of 100 µm rotenone. Error bars indicate the se derived from six biological replicates (n = 6).
Figure 3.
Figure 3.
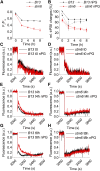
The mutant stm6 shows stronger photoinhibition and lower chlororespiration than the MOC1-complemented strain under high light conditions. A, Fv/Fm of dark-adapted B13 (black squares) and stm6 (red circles) cells determined after photoautotrophic growth in low light (100 µmol photons m−2 s−1; t0h) or following exposure to high light (1,500 µmol photons m−2 s−1; t2-8h) for several hours. Error bars indicate the se derived from five biological replicates (n = 5). B, ФPSII determined for B13 (black squares; t0 set to 100%) and stm6 (red circles) during actinic light illumination (800 µmol photons m−2 s−1) in the presence (dotted lines) or absence (continuous lines) of nPG. Error bars indicate the se derived from three biological replicates (n = 3) and asterisks significant nPG effects (P < 0.05). C, Kinetics of chlorophyll fluorescence emission in the dark after 5 min of illumination with 150 µmol photons m−2 s−1 white actinic light for B13 (C, E, and G) and stm6 (D, F, and H). Samples were taken from low light (t0)- and high light-acclimated (t4h, t8h) cultures and nPG added to inhibit PTOX.
Figure 4.
Figure 4.
The expression of chlororespiratory enzymes is altered in mutant stm6. A, RT-qPCR analysis of PTOX1/2, and NDA2/3 mRNA levels in B13 and stm6 before (t0h) and 2 h after the onset of high light exposure (t2h). Values are normalized to the mRNA level found in B13 at t0h (set to 1). ses are derived from three biological replicates, each including three technical replicates (n = 3). B, Immunodetection of proteins NDA2, PTOX2, and histone H3. Top: Representative immunoblot results. Loading control: Immunodetection of histone H3 and Coomassie Brilliant Blue-staining (CBB). Bottom: Relative protein levels (B13 t0 set to 1) obtained by densitometric scanning of immunoblot signals. Error bars indicate the se derived from three biological replicates, each including three technical replicates (n = 3).
Figure 5.
Figure 5.
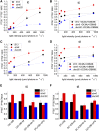
Stromal overoxidation in stm6 is caused by a higher mitochondrial reductant sink capacity. A to D, P700+ accumulation as assessed by the absorbance change at 705 nm during illumination with orange actinic light at different light intensities (35, 82, 170, 560, and 940 µmol photons m−2 s−1). Samples derived from B13 (black curve), stm6 (red curves), and dum20 (blue curves) cultures were analyzed before (A and B) and after acclimation to high light for 8 h (C and D). Measurements were performed in the absence (A and C) or presence (B and D) of DCMU and DBMIB, which inhibits P700 reduction by linear and cyclic electron transport. P700 oxidation kinetics were normalized to the maximum P700+ obtained at 940 µmol photons m−2 s−1 in presence of 1 mm ascorbate and 1 mm methyl viologen. E and F, P700+ oxidation level per PSI determined for B13 (black), stm6 (red), and dum20 (blue) cultures grown for 8 h under high light conditions. Prior to the measurement inhibitors of photosynthetic electron transport were either added to the cultures alone (DCMU [DC]+DBMIB [DB], or together with inhibitors of respiratory electron transport (myxothiazol [M], nPG, or myxothiazole along with salicyl hydroxamic acid [S]). Error bars indicate the sd from three biological replicates (n = 3).
Figure 6.
Figure 6.
Cyclic electron flow capacity is diminished in stm6 cells. P700+ dark rereduction rates (e s−1 per PSI) deduced from first-order dark recovery kinetics of P700 after 20 s of saturating light illumination. Low (t0; A) and high light (t8; B) acclimated cells of B13, stm6, and dum20 were subjected to P700 measurements without or following addition of PET inhibitors (DCMU [DC] / DMCU+DBMIB [DB]) sds are derived from five independent biological experiments (n = 5).
Figure 7.
Figure 7.
Overview of the putative pathways that contribute to the export of excess reducing equivalents from the chloroplast to mitochondria in C. reinhardtii. Genes, up-regulated in stm6 (Fig. 8) under low-light conditions are highlighted in red and those that are down-regulated in green. Genes up-regulated in response to light stress are written in bold. 1,3-BPG, 1,3-bisphosphoglycerate; RuBP, ribulose-1,5-bisphosphate; 2-PGA, 2-phosphoglycerate; LCI20, low CO2-inducible gene; OMT1, 2-oxoglutarate/malate transporter; MITC14, dicarboxylate-tricarboxylate carrier; MDH3-5, malate dehydrogenase; PGK1/2, phosphoglycerate kinase; GAP1/2, glyceraldehyde-3-phosphate dehydrogenase; GAPN1, nonphosphorylating glyceraldehyde-3-phosphate dehydrogenase; PGM, phosphoglycerate mutase; PGH1, enolase.
Figure 8.
Figure 8.
Transcriptome studies indicate an increased flow of plastidic reducing equivalents to mitochondria in light-stressed C. reinhardtii cells. A to C, RT-qPCR analyses with RNA extracted from low light (t0) and high light (t3h) acclimated B13 and stm6 cultures. For each gene, mRNA levels are normalized to the level found in low light-acclimated B13 cells (set to 1). Error bars indicate ses derived from three biological replicates, each including at least three technical replicates (n = 3). Asterisks indicate significant differences between the two strains, according to a two-tailed Student’s t test (*P < 0.05; **P < 0.1).

References

    1. Ahmad N, Michoux F, Nixon PJ (2012) Investigating the production of foreign membrane proteins in tobacco chloroplasts: Expression of an algal plastid terminal oxidase. PLoS One 7: e41722 - PMC - PubMed
    1. Alric J, Lavergne J, Rappaport F (2010) Redox and ATP control of photosynthetic cyclic electron flow in Chlamydomonas reinhardtii (I) aerobic conditions. Biochim Biophys Acta 1797: 44–51 - PubMed
    1. Atteia A, Adrait A, Brugière S, Tardif M, van Lis R, Deusch O, Dagan T, Kuhn L, Gontero B, Martin W, et al. (2009) A proteomic survey of Chlamydomonas reinhardtii mitochondria sheds new light on the metabolic plasticity of the organelle and on the nature of the α-proteobacterial mitochondrial ancestor. Mol Biol Evol 26: 1533–1548 - PubMed
    1. Bailleul B, Berne N, Murik O, Petroutsos D, Prihoda J, Tanaka A, Villanova V, Bligny R, Flori S, Falconet D, et al. (2015) Energetic coupling between plastids and mitochondria drives CO2 assimilation in diatoms. Nature 524: 366–369 - PubMed
    1. Bailleul B, Cardol P, Breyton C, Finazzi G (2010) Electrochromism: a useful probe to study algal photosynthesis. Photosynth Res 106: 179–189 - PubMed

MeSH terms

LinkOut - more resources