. 2017 Jul;174(3):1747-1763.
doi: 10.1104/pp.17.00542. Epub 2017 May 12.

A Rice NAC Transcription Factor Promotes Leaf Senescence via ABA Biosynthesis

Affiliations

A Rice NAC Transcription Factor Promotes Leaf Senescence via ABA Biosynthesis

Chanjuan Mao et al. Plant Physiol. 2017 Jul.

Abstract

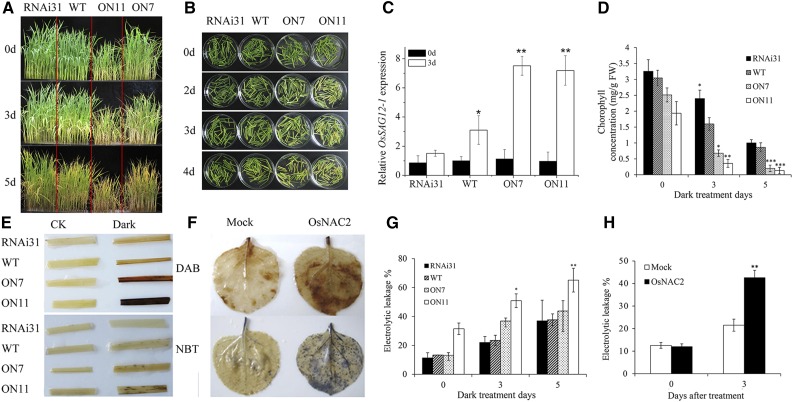
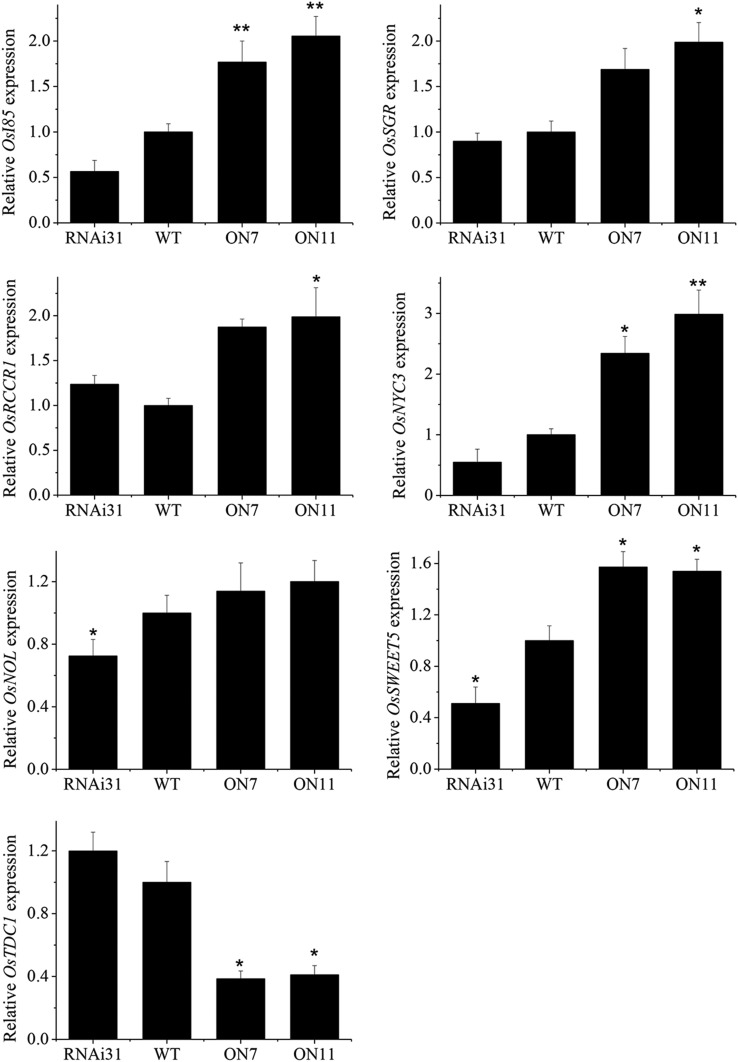
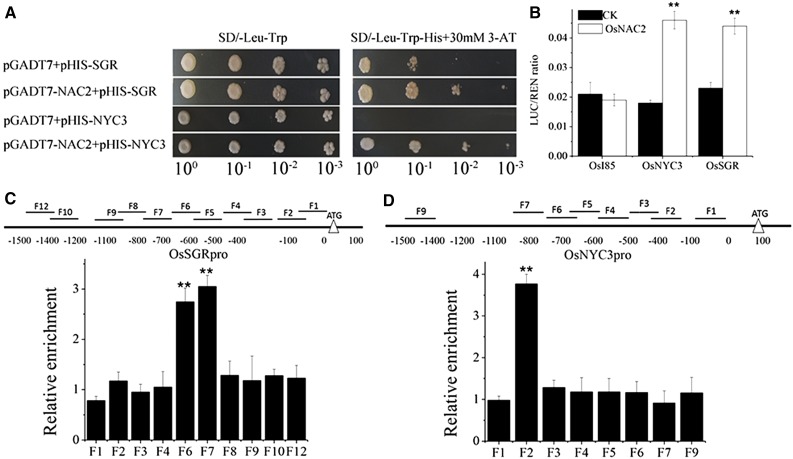
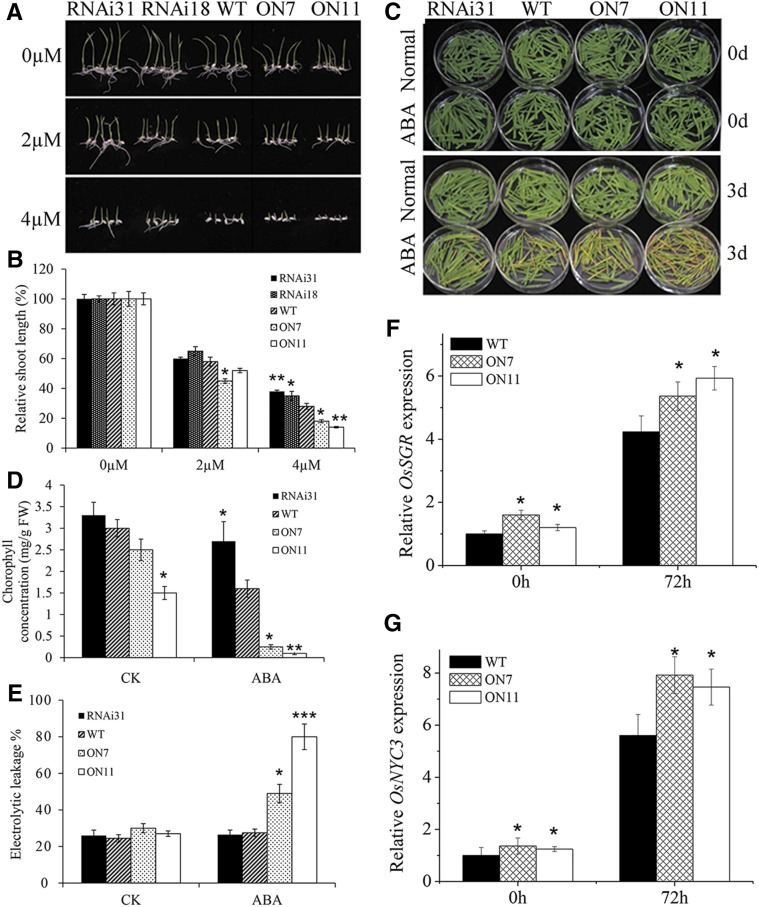
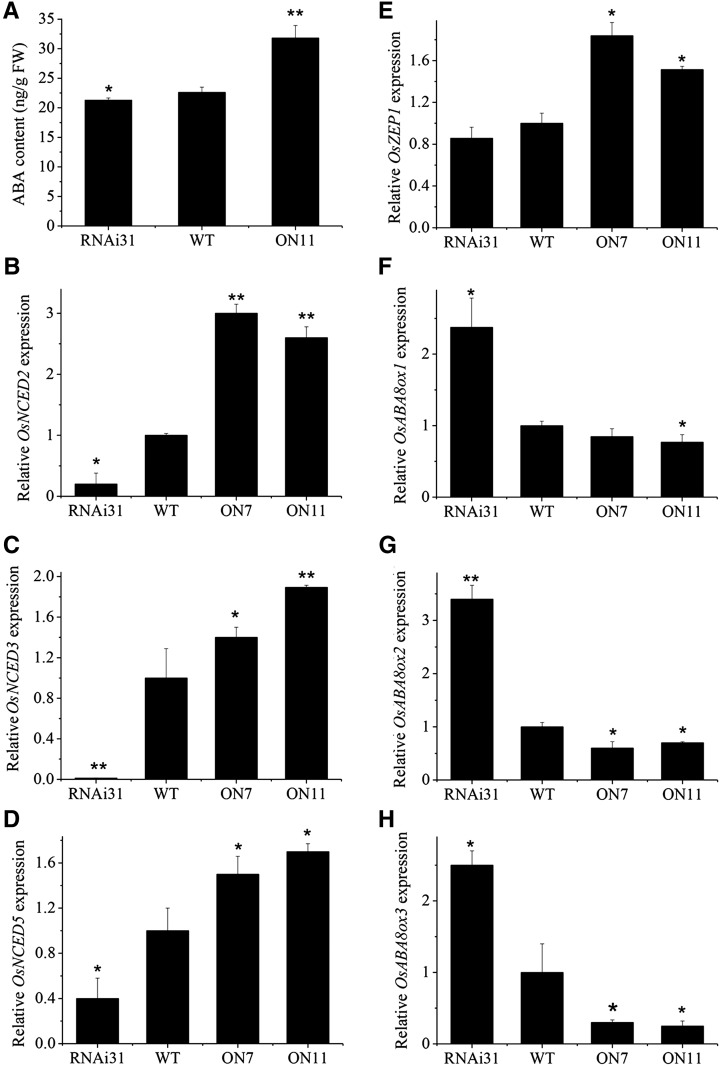
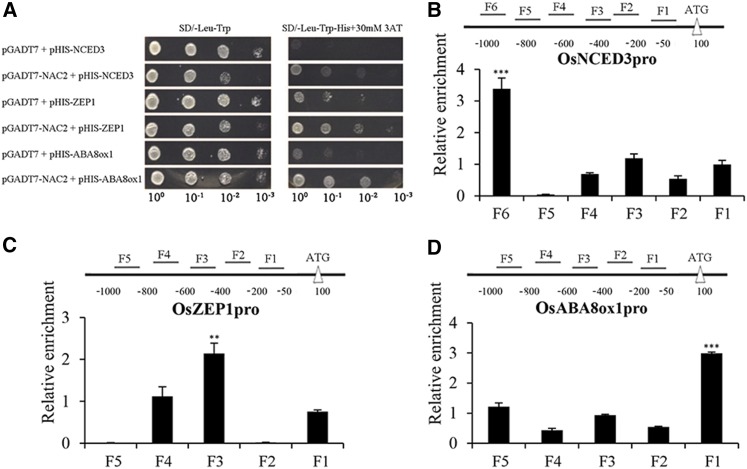
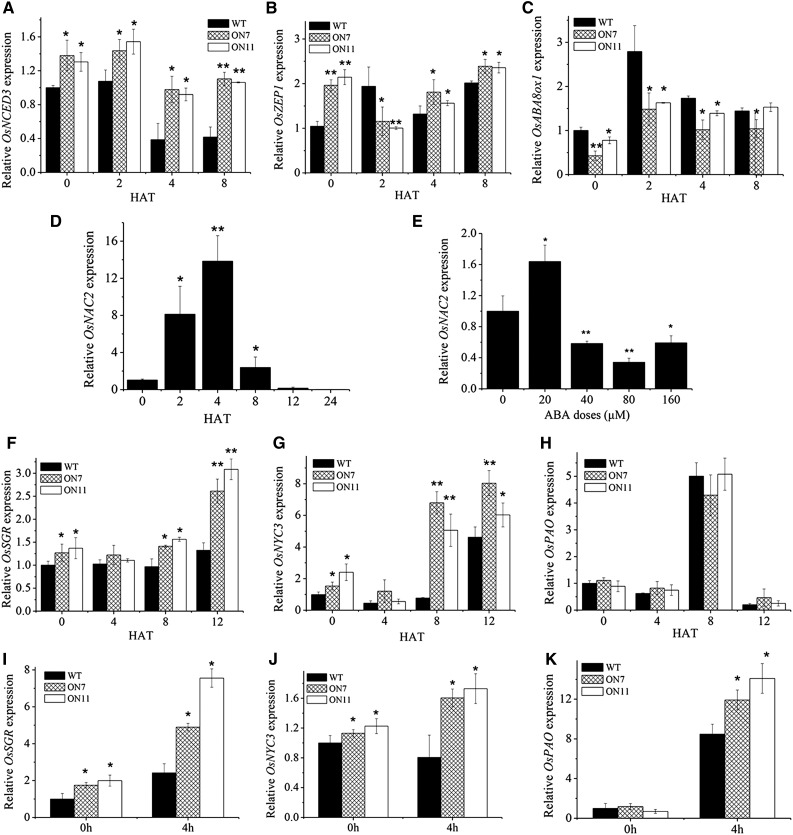
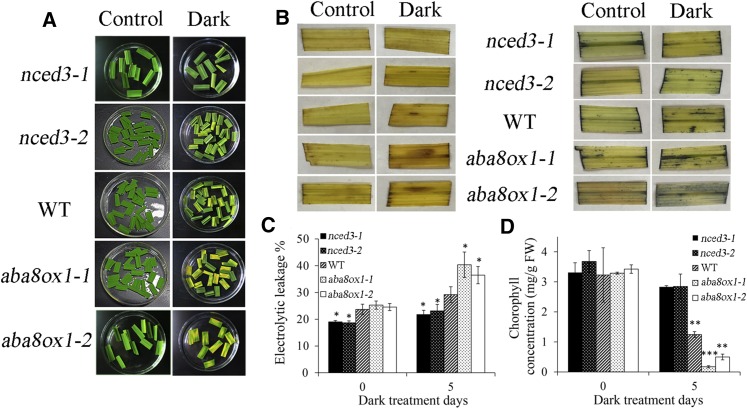
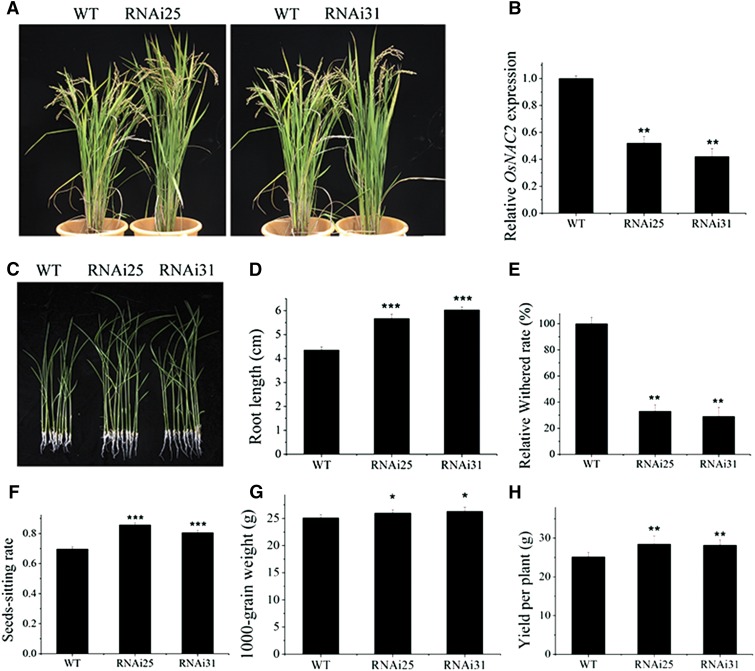
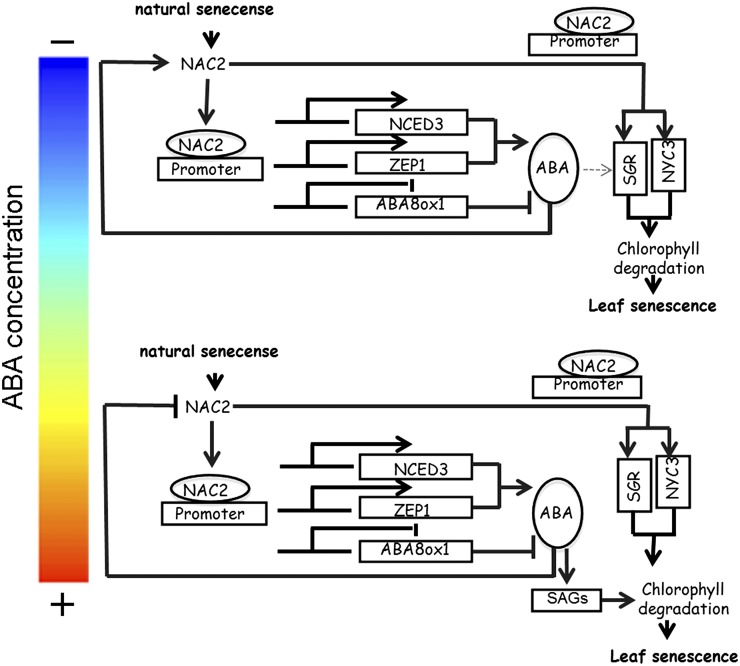
It is well known that abscisic acid (ABA)-induced leaf senescence and premature leaf senescence negatively affect the yield of rice (Oryza sativa). However, the molecular mechanism underlying this relationship, especially the upstream transcriptional network that modulates ABA level during leaf senescence, remains largely unknown. Here, we demonstrate a rice NAC transcription factor, OsNAC2, that participates in ABA-induced leaf senescence. Overexpression of OsNAC2 dramatically accelerated leaf senescence, whereas its knockdown lines showed a delay in leaf senescence. Chromatin immunoprecipitation-quantitative PCR, dual-luciferase, and yeast one-hybrid assays demonstrated that OsNAC2 directly activates expression of chlorophyll degradation genes, OsSGR and OsNYC3 Moreover, ectopic expression of OsNAC2 leads to an increase in ABA levels via directly up-regulating expression of ABA biosynthetic genes (OsNCED3 and OsZEP1) as well as down-regulating the ABA catabolic gene (OsABA8ox1). Interestingly, OsNAC2 is upregulated by a lower level of ABA but downregulated by a higher level of ABA, indicating a feedback repression of OsNAC2 by ABA. Additionally, reduced OsNAC2 expression leads to about 10% increase in the grain yield of RNAi lines. The novel ABA-NAC-SAGs regulatory module might provide a new insight into the molecular action of ABA to enhance leaf senescence and elucidates the transcriptional network of ABA production during leaf senescence in rice.


Figures

Figure 1.
Figure 1.
OsNAC2 is upregulated during leaf senescence. A, Phenotype of the third leaves in 6-week-old wild-type and OsNAC2 transgenic plants. B, Quantitative analysis of the yellowing rate of the leaves shown in A. C, qPCR analysis of OsNAC2 expression in various ages and regions of rice leaves. LS, ES, NS, and YL mean late-senescing, early-senescing, no senescing, and young leaves, respectively. T, M, and B mean the top, middle, and base of the leaf. Relative mRNA level was calculated using the ΔΔCT method from triplicate data. OsActin was used as an internal control to normalize the different samples with the same amount of plant RNA. Data are mean ± se with three replicates. Asterisk indicates a significant difference between the wild type and OsNAC2 transgenic lines by t test: *P < 0.05.
Figure 2.
Figure 2.
Overexpression of OsNAC2 causes early senescence in rice and tobacco. A, Phenotypes of 4-week-old wild-type and OsNAC2-transgenic plants after 0, 3, and 5 d dark treatment. B, Phenotypes of detached leaves in 4-week-old wild-type and transgenic plants after 0, 2, 3, and 4 d dark treatment. C, Expression of OsSAG12-1 in OsNAC2-OX, the wild type, and OsNAC2-RNAi lines after 3 d dark treatment. D, Chlorophyll content of the leaves in OsNAC2 plants after 0, 3, and 5 d dark treatment. Values are means ± sd of five replicates. E, DAB and NBT staining of wild-type and transgenic seedlings leaves after 4 d dark treatment. F, DAB and NBT staining in tobacco leaves by a transient expression of OsNAC2 after 3 d dark treatment. G, Ion leakage analysis of leaves in 4-week-old wild-type and transgenic rice plants after 0, 3, and 5 d dark treatment. Values are means ± sd of five replicates. H, Ion leakage analysis of leaves in tobacco leaves with OsNAC2 transient expression after 3 d dark treatment. Values are means ± sd of five replicates. Asterisks indicate a significant difference between wild-type and OsNAC2 transgenic lines by t test: *P < 0.05 and **P < 0.01.
Figure 3.
Figure 3.
qPCR confirmation of expression of senescence-related genes in the 2-week-old wild type and OsNAC2-OX. Relative mRNA level was calculated using the ΔΔCT method from triplicate data. OsActin was used as internal control to normalize the different samples with the same amount of plant RNA. Data are mean ± se with three replicates. Asterisks indicate a significant difference between wild-type and OsNAC2 transgenic lines by t test: *P < 0.05 and **P < 0.01.
Figure 4.
Figure 4.
OsSGR and OsNYC3 are the direct target genes of OsNAC2. A, Interaction of OsNAC2 with the promoters of OsSGR and OsNYC3 by yeast one-hybrid assays. The yeast cells were grown on SD/-Leu/-Trp/-His/+30 mm 3-amino-1, 2,4-triazole medium. B, Interaction of OsNAC2 with the promoters of OsSGR and OsNYC3 by dual-luciferase promoter activation assays in tobacco. C and D, ChIP-qPCR assays. Total protein extracted from 35S:OsNAC2-mGFP transgenic plants hydroponically cultivated for 4 weeks were immunoprecipitated with an anti-GFP antibody. Fragmented genomic DNA was eluted from the protein-DNA complexes and subjected to qPCR analysis. The long black bars represent promoter regions for which we designed primers. The numbers under the bar show the distance from ATG start codon. Short bars represents for the corresponding region of each pair of primers on the promoter. Error bars are the se for three biological repeats: *P < 0.05 and **P < 0.01.
Figure 5.
Figure 5.
Effects of exogenous ABA on chlorophyll content and SAG gene transcript levels in wild-type, OsNAC2-OX, and OsNAC2-RNAi plants. A, ABA effect on seedling growth on MS media. B, Relative shoot length of wild-type, OsNAC2-OX, and OsNAC2-RNAi plants in the presence of different ABA concentrations. The value of shoot length without ABA treatment was set to 1. C, Phenotype of detached leaves from wild-type, OsNAC2-OX, and OsNAC2-RNAi plants in the presence of 20 µm ABA. D, Chlorophyll content of the leaves in wild-type, OsNAC2-OX, and OsNAC2-RNAi plants treated with 20 µm ABA for 3 d. E, Ion leakage analysis of leaves in 2-week-old wild-type, OsNAC2-OX, and OsNAC2-RNAi plants treated with 20 µm ABA for 3 d. F and G, Relative expression of OsSGR and OsNYC3 72 h after 20 µm ABA treatment. HAT, hours after treatment. Data are means ± se with at least three biological replicates. Asterisks represent statistically significant differences between wild-type and transgenic plants: *P < 0.05, **P < 0.01, and ***P < 0.001.
Figure 6.
Figure 6.
ABA content and expression of ABA metabolism-related genes in wild-type, OsNAC2-OX, and OsNAC2-RNAi plants. Data were means ± se with at least three biological replicates. Asterisks represent statistically significant differences between wild-type and transgenic plants: *P < 0.05 and **P < 0.01.
Figure 7.
Figure 7.
Interactions between OsNAC2 and the promoters of OsNCED3, OsZEP1, and OsABA8ox1. A, Interaction of OsNAC2 with the promoters of OsNCED3, OsZEP1, and OsABA8ox1 by yeast one-hybrid assays. The yeast cells were grown on SD/-Leu/-Trp/-His/+30 mm 3-amino-1, 2,4-triazole medium. B to D, ChIP-qPCR assays of OsNAC2 binding to the promoters of OsNCED3 (B), OsZEP1 (C), and OsABA8ox1 (D). Total protein extracted from 35S:OsNAC2-mGFP transgenic plants hydroponically cultivated for 4 weeks was immunoprecipitated with an anti-GFP antibody. Fragmented genomic DNA was eluted from the protein-DNA complexes and subjected to qPCR analysis. The long black bars represent for promoter region for which we designed primers. The numbers under the bar show the distance from ATG start codon. Short bars represents for the corresponding region of each pair of primers on the promoter. Error bars are the se for three biological repeats: *P < 0.05, **P < 0.01, and ***P < 0.001.
Figure 8.
Figure 8.
Expression of ABA metabolism and senescence-related genes after different concentration of ABA treatments. A to D and F to H, Treatments with 20 µm ABA. I to K, Treatments with 80 µm ABA. Relative mRNA level was calculated using the ΔΔCT method from triplicate data. OsActin was used as an internal control to normalize the different samples with the same amount of plant RNA. Data are mean ± se with three replicates. Asterisks indicate a significant difference between wild-type and OsNAC2 transgenic lines by t test: *P < 0.05, **P < 0.01, and ***P < 0.001.
Figure 9.
Figure 9.
Effect of darkness on detached leaves of 8-week-old wild-type, nced3-1,2, and aba8ox1-1,2 plants. A, Phenotype of wild-type, nced3-1,2, and aba8ox1-1,2 leaves after 5 d dark treatment. B, DAB and NBT staining of 6-week-old wild-type, nced3-1,2, and aba8ox1-1,2 leaves treated with dark for 5 d. C, Ion leakage analysis of leaves in 6-week-old wild-type, nced3-1,2, and aba8ox1-1,2 leaves after 5 d dark treatment. D, Chlorophyll content in leaves prior to and after dark treatment. Values are means ± sd of five measurements. Asterisks indicate a significant difference between wild-type and OsNAC2 transgenic lines by t test: *P < 0.05, **P < 0.01, and ***P < 0.001.
Figure 10.
Figure 10.
Agronomic traits of OsNAC2-RNAi transgenic lines. A, Morphology of 4-month-old mature OsNAC2-RNAi lines grown in field conditions. B, Expression of OsNAC2 in RNAi plants. C, Root phenotype of 2-week-old wild-type and OsNAC2-RNAi lines. D, Root length of 2-week-old OsNAC2-RNAi plants compared with the wild type. E, Relative withered rate of 2-week-old wild-type and OsNAC2-RNAi line 3 d after 150 mm NaCl treatment. F to H, Seed-setting rate (F), 1,000-grain weight (G), and grain yield per plant (H) in the RNAi lines. Values are means ± sd of 10 measurements. Asterisks indicate a significant difference between wild-type and OsNAC2 transgenic lines by t test: *P < 0.05, **P < 0.01, and ***P < 0.001.
Figure 11.
Figure 11.
Proposed model of OsNAC2 role in plant leaf senescence of rice.

Similar articles

Cited by

References

    1. Abe H, Yamaguchi-Shinozaki K, Urao T, Iwasaki T, Hosokawa D, Shinozaki K (1997) Role of arabidopsis MYC and MYB homologs in drought- and abscisic acid-regulated gene expression. Plant Cell 9: 1859–1868 - PMC - PubMed
    1. Balazadeh S, Kwasniewski M, Caldana C, Mehrnia M, Zanor MI, Xue GP, Mueller-Roeber B (2011) ORS1, an H2O2-responsive NAC transcription factor, controls senescence in Arabidopsis thaliana. Mol Plant 4: 346–360 - PMC - PubMed
    1. Balazadeh S, Siddiqui H, Allu AD, Matallana-Ramirez LP, Caldana C, Mehrnia M, Zanor MI, Köhler B, Mueller-Roeber B (2010) A gene regulatory network controlled by the NAC transcription factor ANAC092/AtNAC2/ORE1 during salt-promoted senescence. Plant J 62: 250–264 - PubMed
    1. Becker W, Apel K (1993) Differences in gene expression between natural and artificially induced leaf senescence. Planta 189: 74–79
    1. Bu Q, Jiang H, Li CB, Zhai Q, Zhang J, Wu X, Sun J, Xie Q, Li C (2008) Role of the Arabidopsis thaliana NAC transcription factors ANAC019 and ANAC055 in regulating jasmonic acid-signaled defense responses. Cell Res 18: 756–767 - PubMed

MeSH terms